Lost and Forgotten Books Title Visualization
MAT 259, 2016
Hannah Wolfe
Concept
In this project I mapped the relationship between words in titles from fiction starting with the dataset from the 2D assignment. For the 2D assignment, I thought it would be interesting to see what books were only checked out once, sometimes due to never being returned. During this process I started to think about the relationship between words in the titles. I used a machine learning algorithm to analyze the words in the title list of books that had been checked out once and never returned. The result was a 3D point for each word. This visualization explores how to display these titles and navigate through the data.
Query
SELECT
    c, checkout, checkin, title, callNumber,
    CASE WHEN callNumber LIKE '%SCI-FIC%' THEN 1 ELSE 0 END AS sci,
    CASE WHEN callNumber LIKE '%MYSTERY%' THEN 1 ELSE 0 END AS mys,
    CASE WHEN callNumber LIKE '%WESTERN%' THEN 1 ELSE 0 END AS wes,
    CASE WHEN callNumber LIKE 'FIC%' or callNumber LIKE 'CAS FIC%' or
              callNumber LIKE 'CD FIC%' THEN 1 ELSE 0 END AS fic,
    CASE WHEN callNumber LIKE 'YA%' or callNumber LIKE 'CAS YA%' or
              callNumber LIKE 'CD YA%' THEN 1 ELSE 0 END AS YA,
    spl_2016.transactions.bibNumber, t.itemNumber
FROM
    (SELECT
        COUNT(checkOut) AS c, spl_2016.callNumber.itemNumber
	FROM spl_2016.callNumber
	INNER JOIN spl_2016.transactions
	      ON spl_2016.transactions.itemNumber = spl_2016.callNumber.itemNumber
	where callNumber LIKE '%SCI-FIC%' OR callNumber LIKE '%MYSTERY%' OR
	  callNumber LIKE '%WESTERN%' or callNumber LIKE 'FIC%' or
	  callNumber LIKE 'CAS FIC%' or callNumber LIKE 'CD FIC%'or
	  callNumber LIKE 'YA%' or callNumber LIKE 'CAS YA%' or
	  callNumber LIKE 'CD YA%'
	GROUP BY spl_2016.callNumber.itemNumber
	ORDER BY c) t

    INNER JOIN spl_2016.transactions
        ON spl_2016.transactions.itemNumber = t.itemNumber
    LEFT JOIN spl_2016.callNumber
        ON spl_2016.callNumber.itemNumber = spl_2016.transactions.itemNumber
    LEFT JOIN spl_2016.title
        ON spl_2016.transactions.bibNumber = spl_2016.title.bibNumber
    LEFT JOIN spl_2016.deweyClass
        ON spl_2016.transactions.bibNumber = spl_2016.deweyClass.bibNumber
WHERE
    c = 1 AND YEAR(checkout) > 2004 and deweyClass = ""
ORDER BY checkout;

/*This just gets the checkouts for the items that have only been checked out once*/
/*Includes 114 YA bibliographies that we might want to get rid of */
/*runtime duration: 684.374 sec, fetch: 0.170 sec, 18757 rows */
I wrote a query to get all of the fiction items, but I got an out of memory error while running the t-SNE analysis and couldn't complete the analysis.
SELECT
  spl_2016.title.bibNumber, spl_2016.title.title, spl_2016.callNumber.callNumber
	FROM spl_2016.callNumber
    INNER JOIN spl_2016.itemToBib
      ON spl_2016.callNumber.itemNumber = spl_2016.itemToBib.bibNumber
    LEFT JOIN spl_2016.deweyClass
      ON spl_2016.itemToBib.bibNumber = spl_2016.deweyClass.bibNumber
    INNER JOIN spl_2016.title
      ON spl_2016.itemToBib.bibNumber = spl_2016.title.bibNumber
    where deweyClass = ""
    and (callNumber LIKE '%SCI-FIC%' or callNumber LIKE '%MYSTERY%'
         or callNumber LIKE '%WESTERN%' or callNumber LIKE 'FIC%'
         or callNumber LIKE 'CAS FIC%' or callNumber LIKE 'CD FIC%'
         or callNumber LIKE 'YA%' or callNumber LIKE 'CAS YA%'
         or callNumber LIKE 'CD YA%')
    and title not like 'ILLM%'
    group by spl_2016.title.bibNumber, spl_2016.title.title,
             spl_2016.callNumber.callNumber
/*runtime duration: 3.280 sec, fetch: 2.557 sec, 54623 rows */
Design
I had previously learned about using word2vec for analyzing text in a Neural Networks class. When I was thinking of a way to map text into fewer dimensions this was the first thing that came to mind. Once I had the word cloud then I started to explore different ways of visualizing the titles using it.
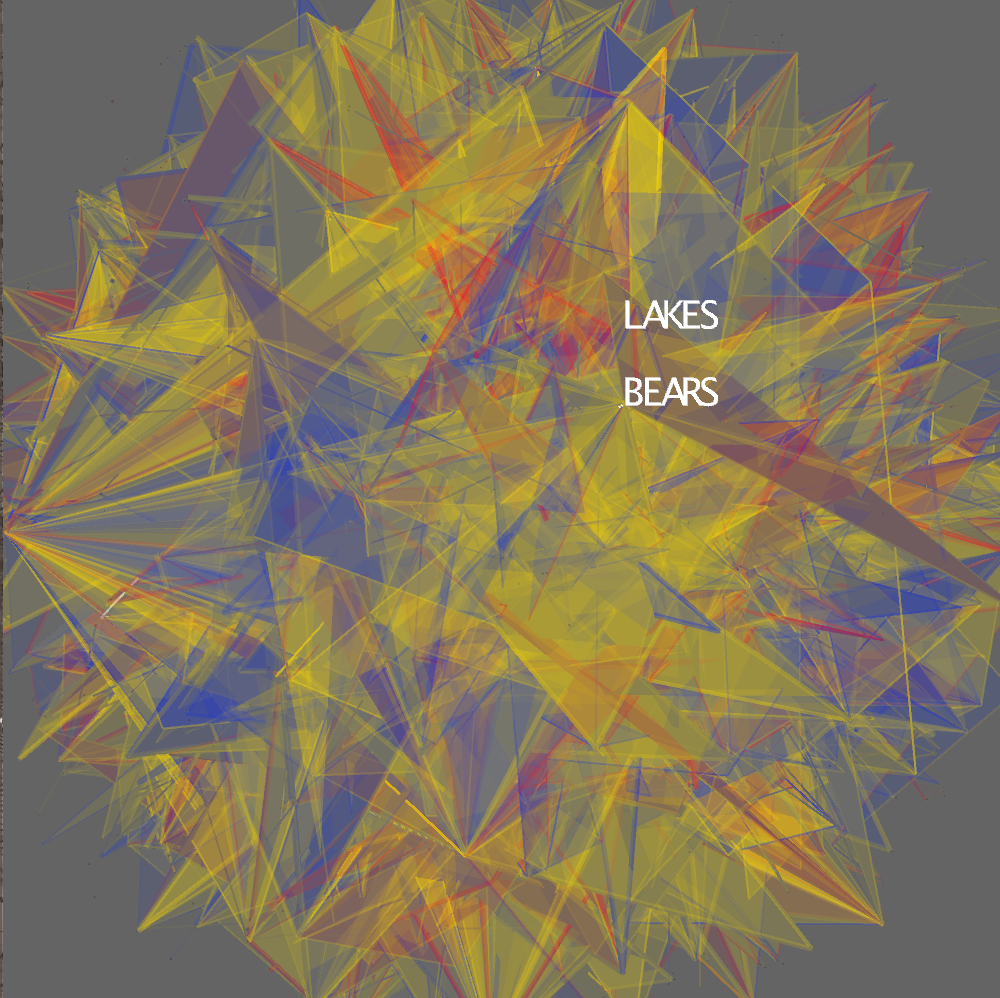
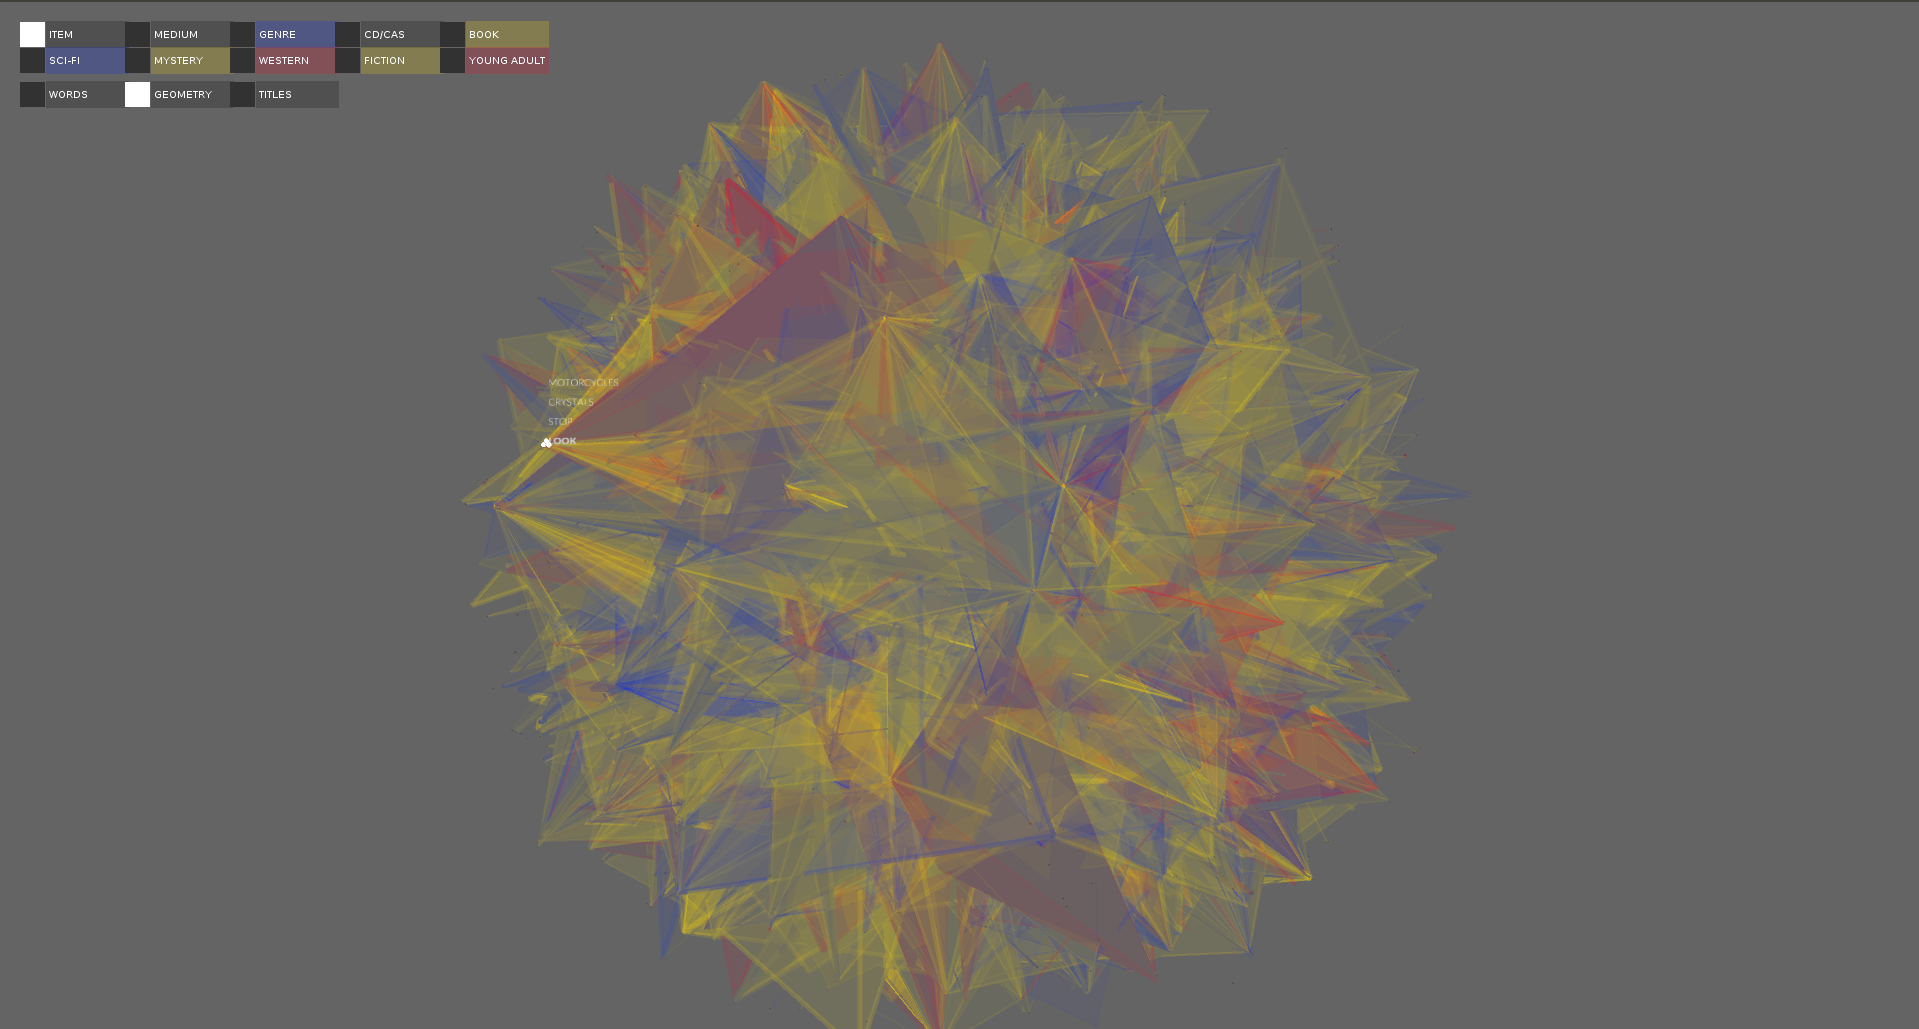
I didn't really sketch for this project, because I didn't know what the results were going to look like until I programmed it. I first tried to visualize it by creating geometries with the words in the title being verticies. While I found the results visually appealling they also overwhelmed the data and it was very hard to see the individual titles.
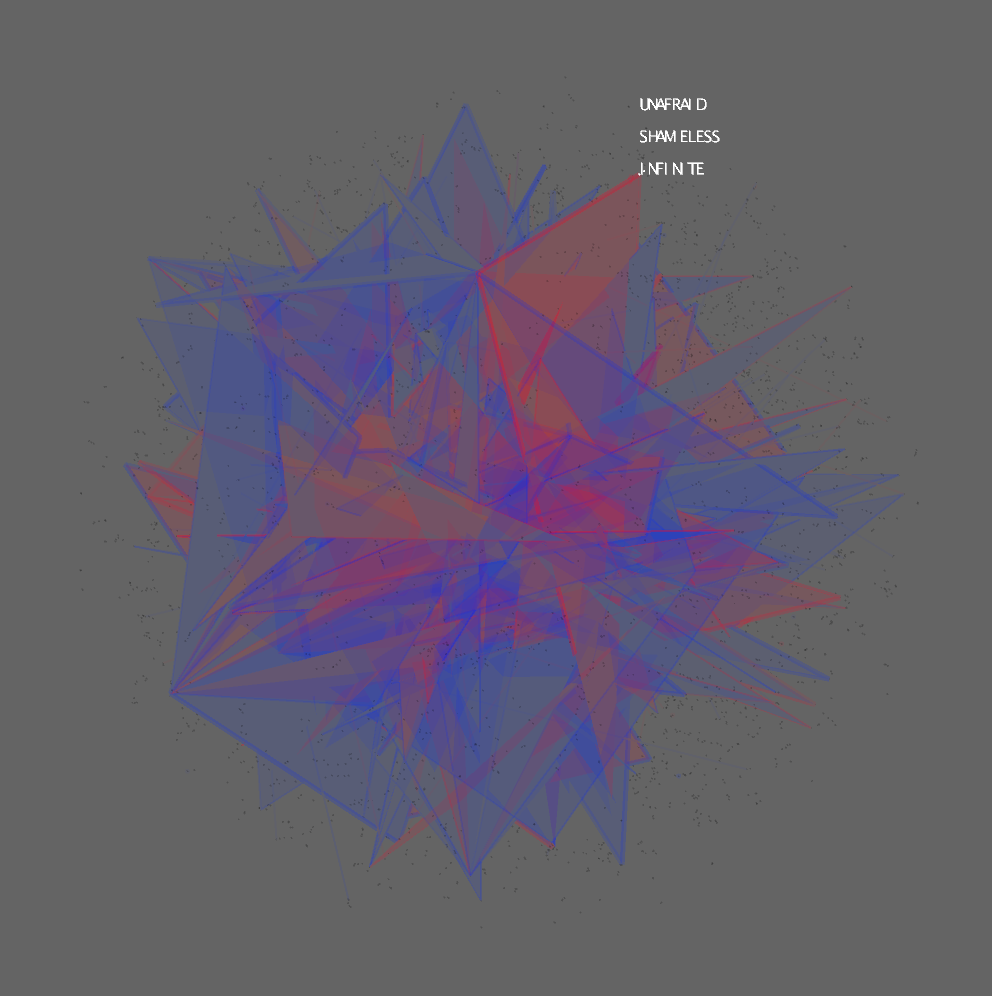
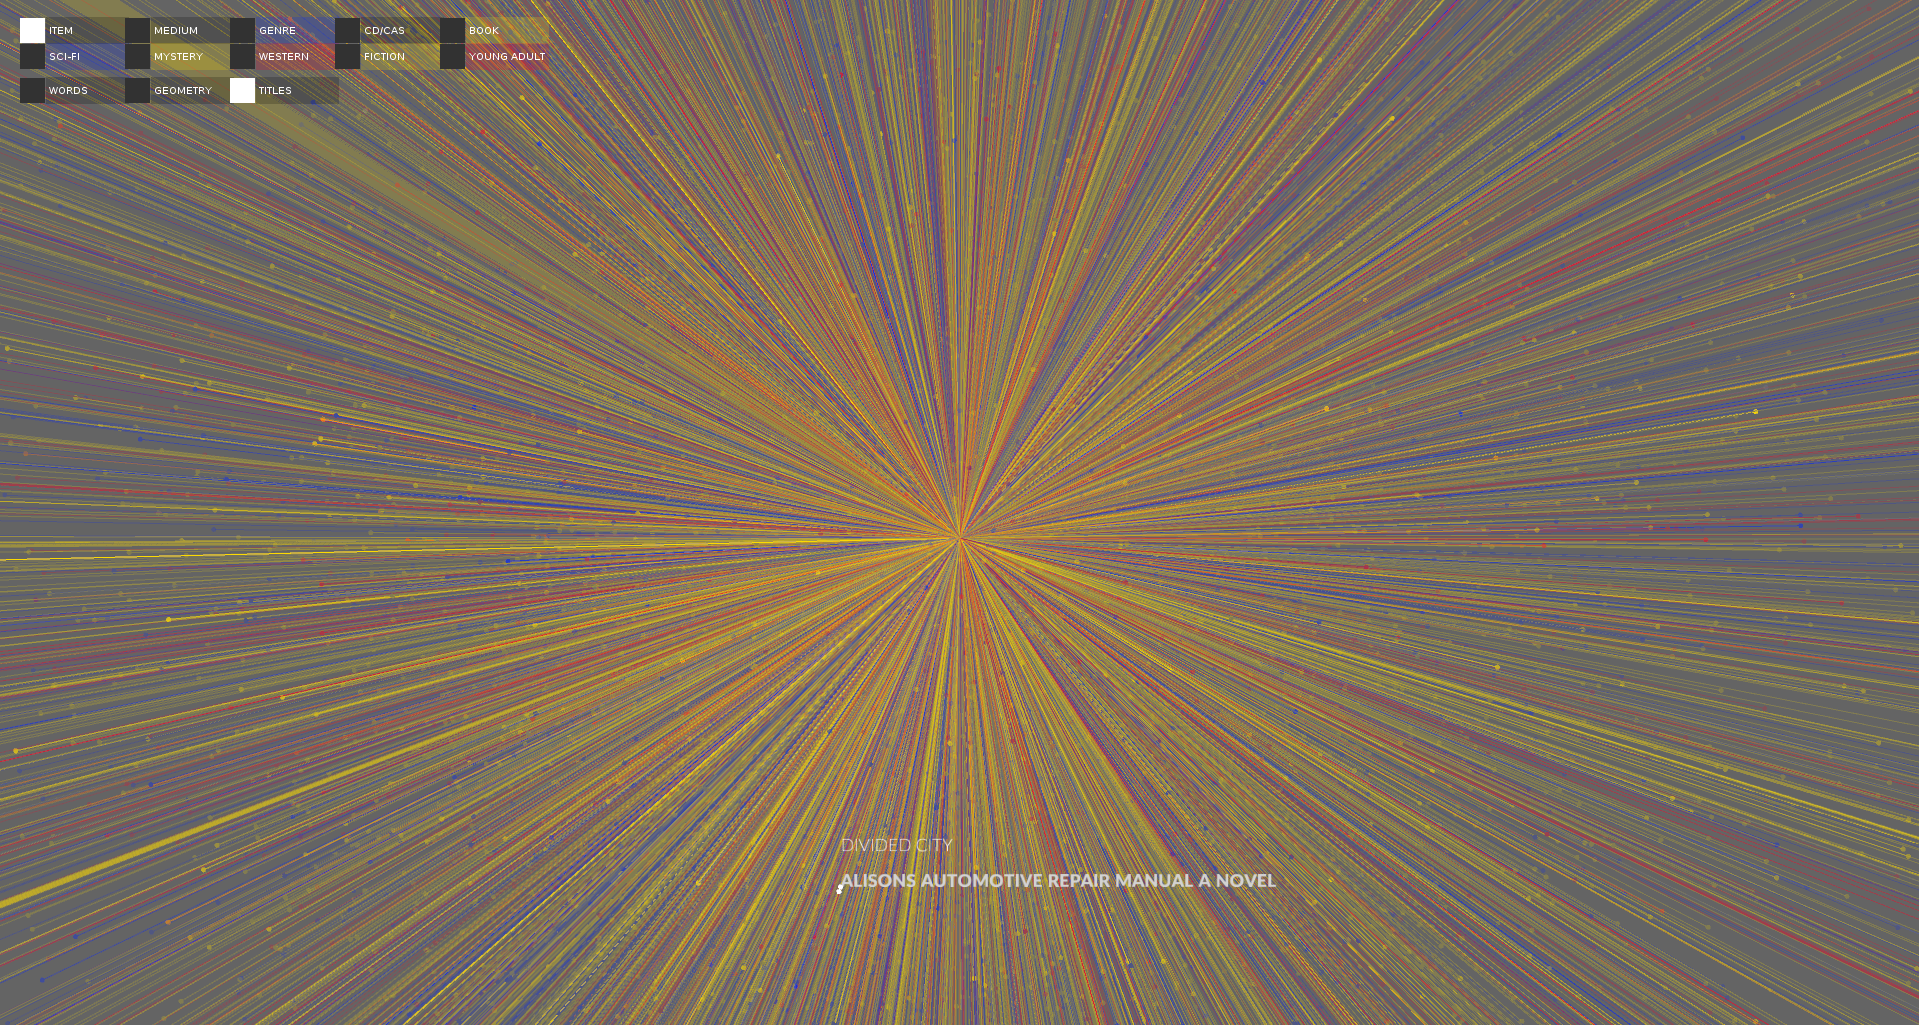
When reading about word2vec I read that people would create "sentence" vectors by averaging all the word vectors from the sentence. I tried to visual the titles in the same way, by creating title vectors. The results felt underwhelming. It looked similar to the word space, but just colored dots. Because they were vectors I decided to draw them like such with a line from the origin to the vector point. I found this visually appealling and when the corpus was filtered patterns could potentially emerge.
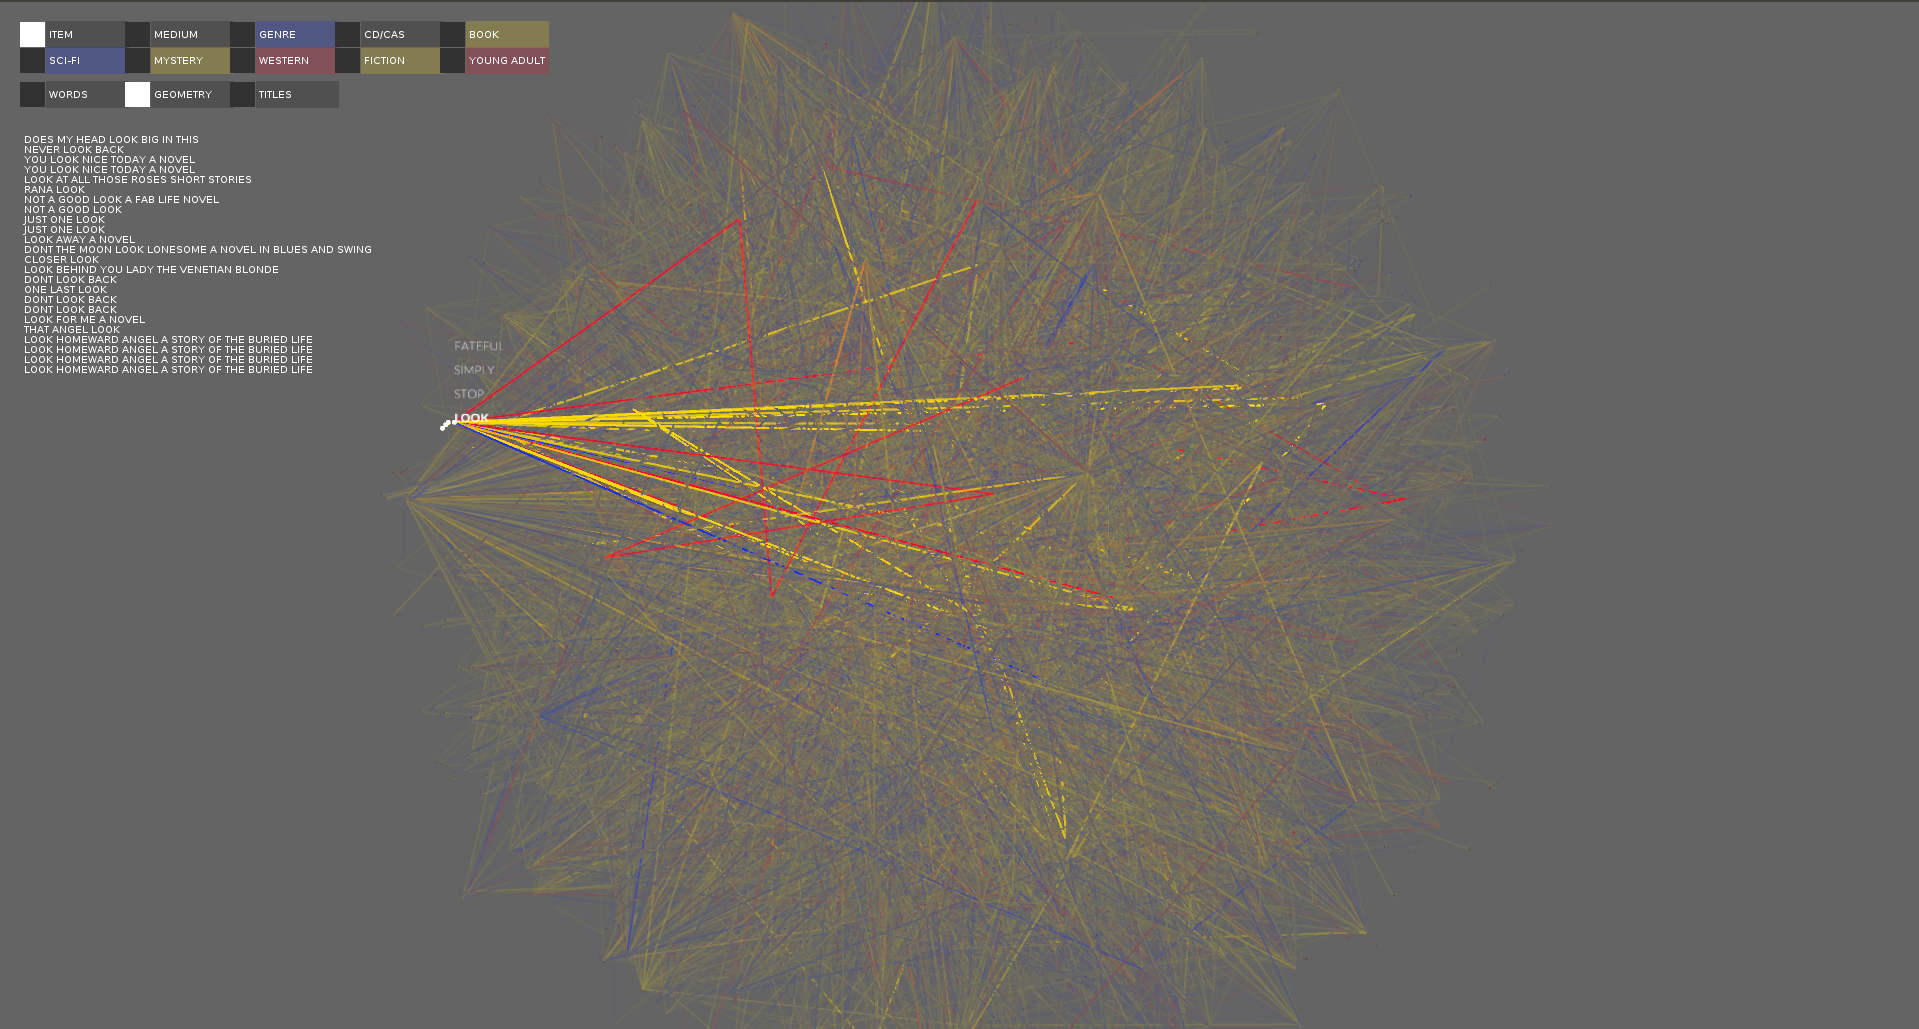
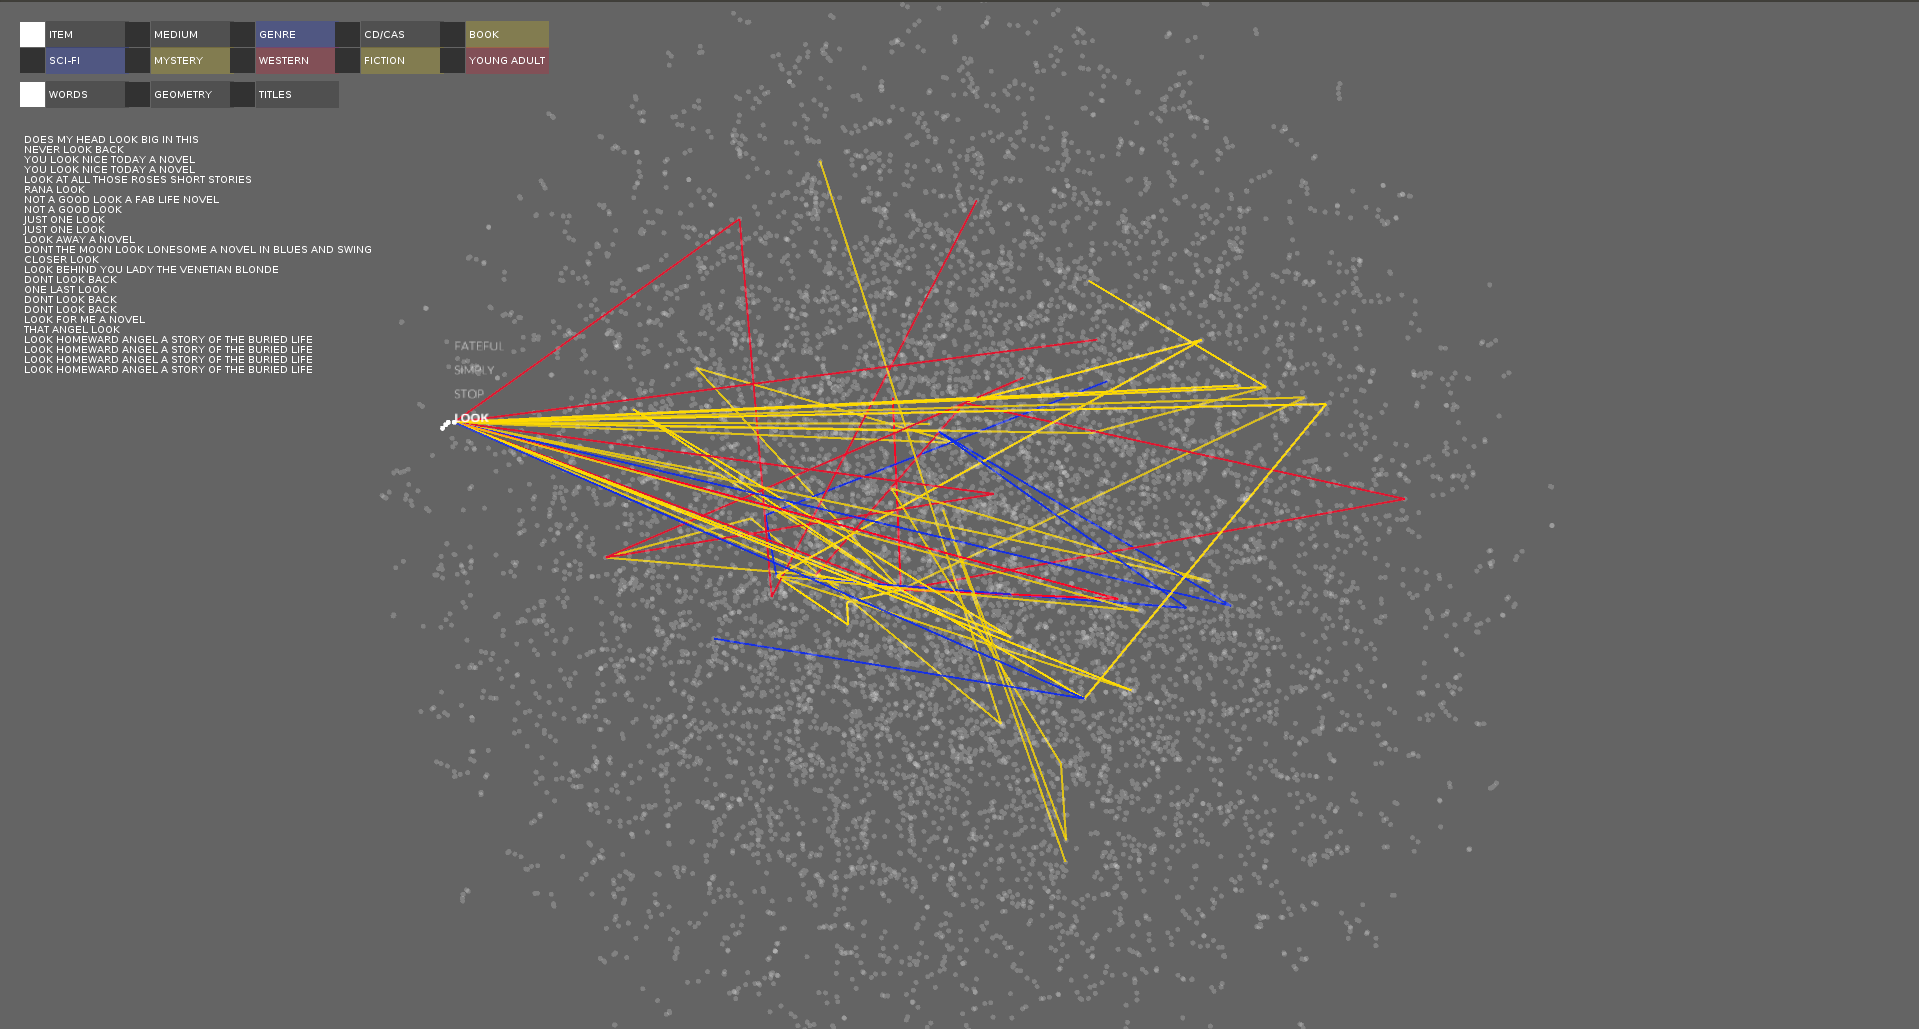
I wanted to find a way to visualize all the titles associated with one word. At first I tried to do this by making the geometries solid in the geometry view. This was very hard to read. I felt like there might be a better way to visualize the titles so lastly I decided to create paths for each title connecting the word verticies together. This displayed the titles in the most meaningful way without too much information.
For the final visualization I combined these different ways to visualize the data to create a comprehensive view of the data.
I didn't really sketch for this project, because I didn't know what the results were going to look like until I programmed it. I first tried to visualize it by creating geometries with the words in the title being verticies. While I found the results visually appealling they also overwhelmed the data and it was very hard to see the individual titles.
When reading about word2vec I read that people would create "sentence" vectors by averaging all the word vectors from the sentence. I tried to visual the titles in the same way, by creating title vectors. The results felt underwhelming. It looked similar to the word space, but just colored dots. Because they were vectors I decided to draw them like such with a line from the origin to the vector point. I found this visually appealling and when the corpus was filtered patterns could potentially emerge.
I wanted to find a way to visualize all the titles associated with one word. At first I tried to do this by making the geometries solid in the geometry view. This was very hard to read. I felt like there might be a better way to visualize the titles so lastly I decided to create paths for each title connecting the word verticies together. This displayed the titles in the most meaningful way without too much information.
For the final visualization I combined these different ways to visualize the data to create a comprehensive view of the data.
Process
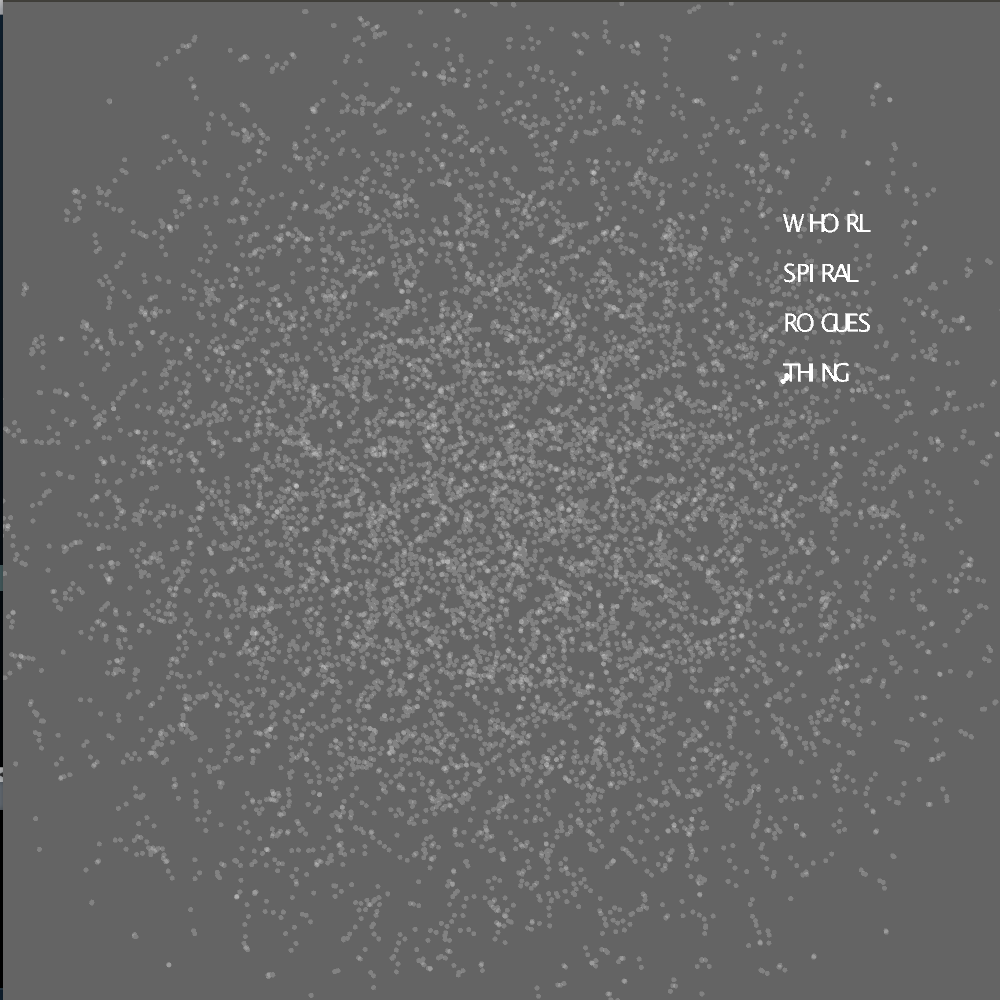
I implemented a visualization of the word point cloud. The words and points hovered over is show as hover text.
A polygon is created for each title connecting up to the first four words in the title.
The user can zoom into the polygon mesh.

These titles can be filtered using the keyboard. This screen shot shows cds and cassettes.
A polygon is created for each title connecting up to the first four words in the title.
The user can zoom into the polygon mesh.
These titles can be filtered using the keyboard. This screen shot shows cds and cassettes.
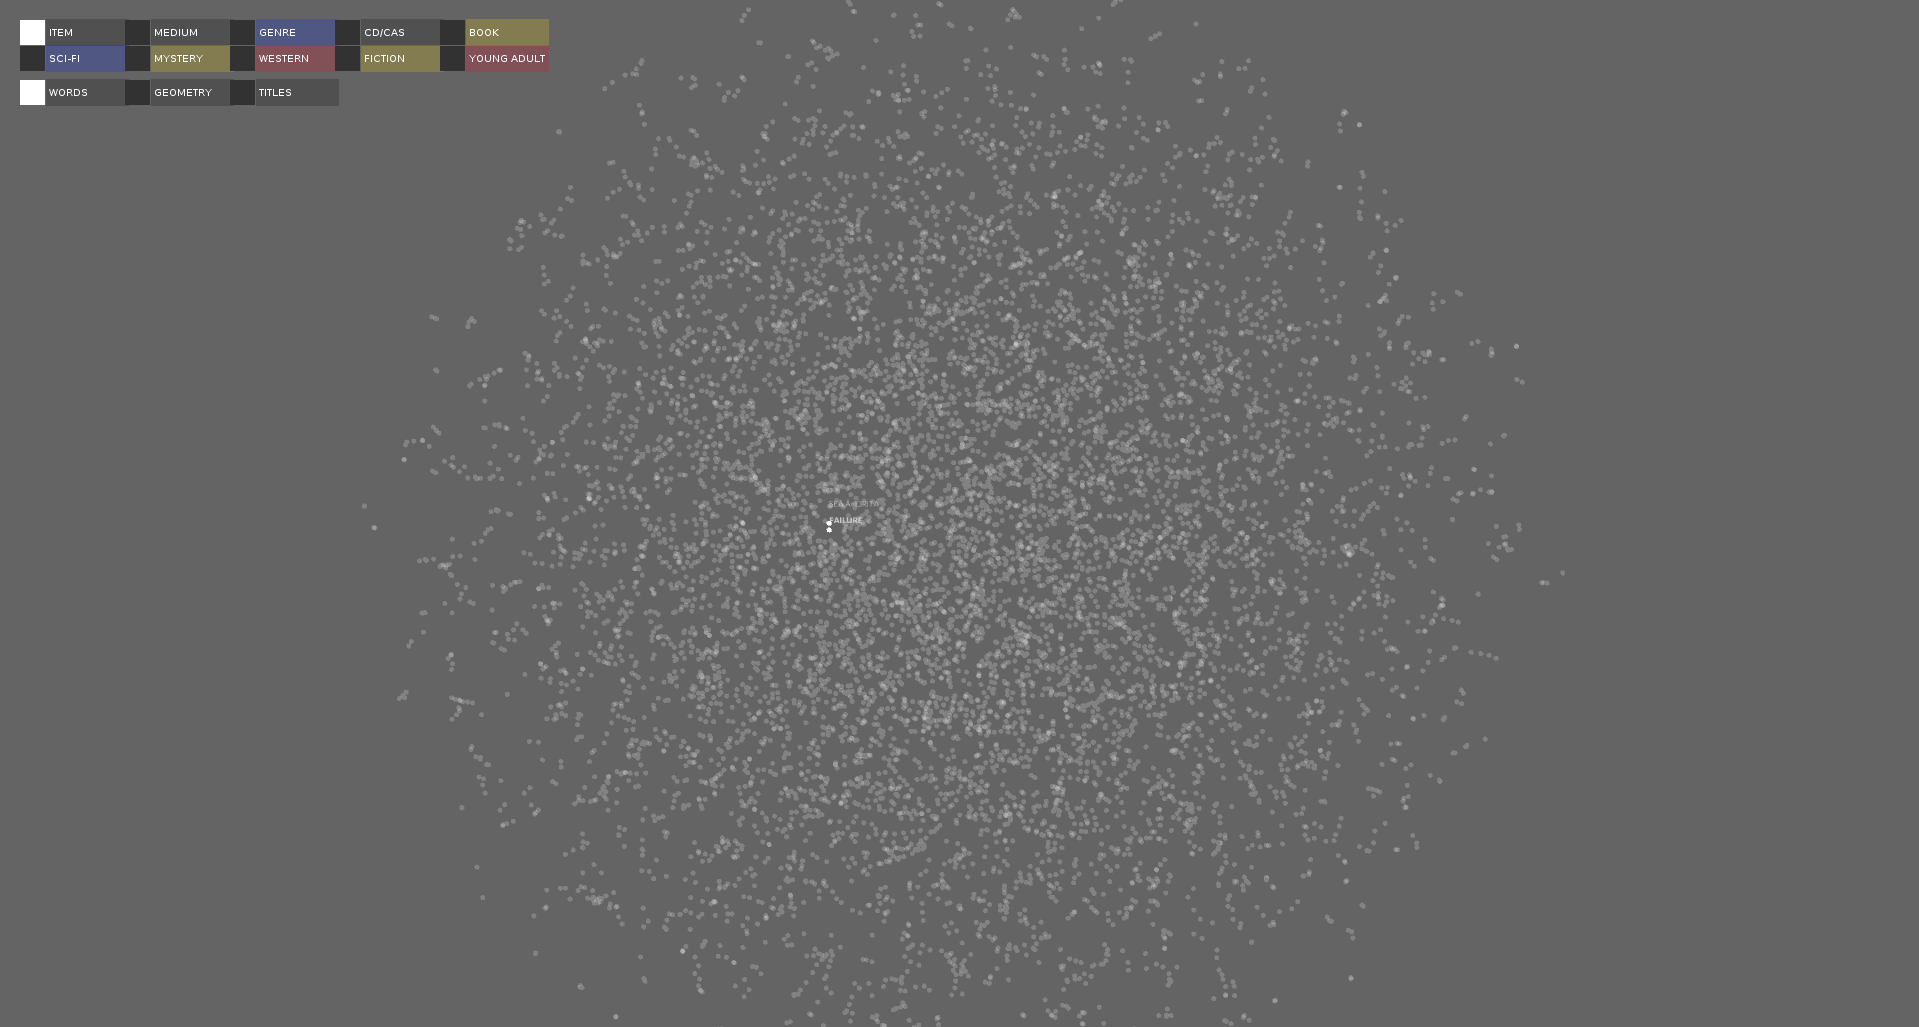
Interface
Keyboard Interaction:
Pressing the numbers 0-9 show 10 different filters of the data.
0 charts the items in the categories of "genre", "fiction" and "young adult".
1 charts the items by item type, "book", "CD" and "casette"
2 charts the "genre" books in the categories "mystery", "western" and "science fiction"
3 charts the CDs and Casettes only
4-9 charts "books", "science fiction", "mystery", "western", "fiction" and "young adult" separately
Pressing a-z filters the chart to the authors who's books start with the typed letter.
Pressing the spacebar resets it to be able to see all the books.
Pressing comma switches between title view and word view.
Pressing period switches between point cloud view and geometry view.
ControlP5 Interaction:
The first two rows filter the data, similar to pressing 0-9.
The third row switches between word, geometry and title view, similar to pressing period and comma.
Mouse+Keyboard Interaction:
I added hover text so that the viewer can see the titles or words hovered over.
The arrow keys can be used to select a word or title. Up and down cycles through the words/titles, and left/right selects/deselects the word/title highlighted. When a word or title is selected the nearby words or titles by a certain radius are also highlighted. When in "word" or "geometry" view the path of all titles that include the selected word is drawn and the titles are listed on the left below the UI. When in "title" view the path of the title is drawn.
Final result
A visualization of the point cloud.
A visualization of the title geometry.
A visualization of the titles associated with the selected word over the geometry.
A visualization of the titles associated with the selected word over the point cloud.
A visualization of the titles as vectors.
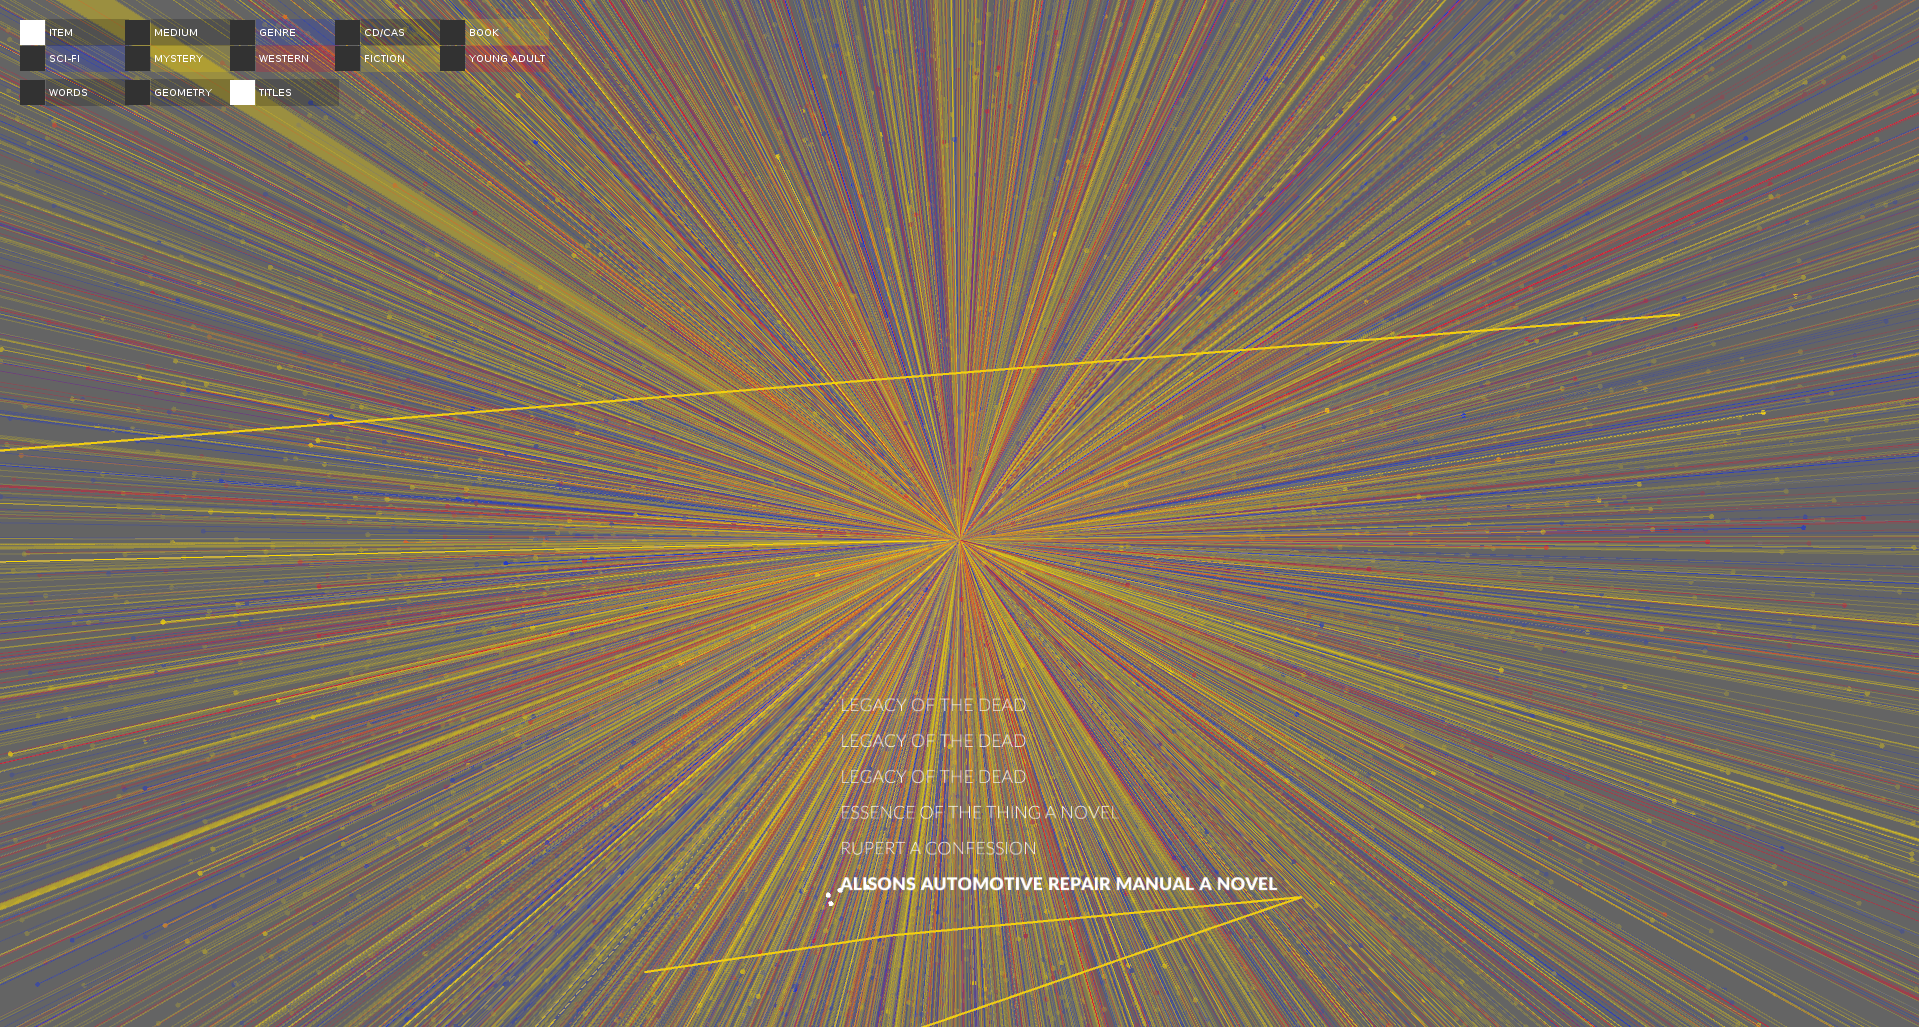
A visualization of the titles with one title selected and it's path drawn zoomed in.
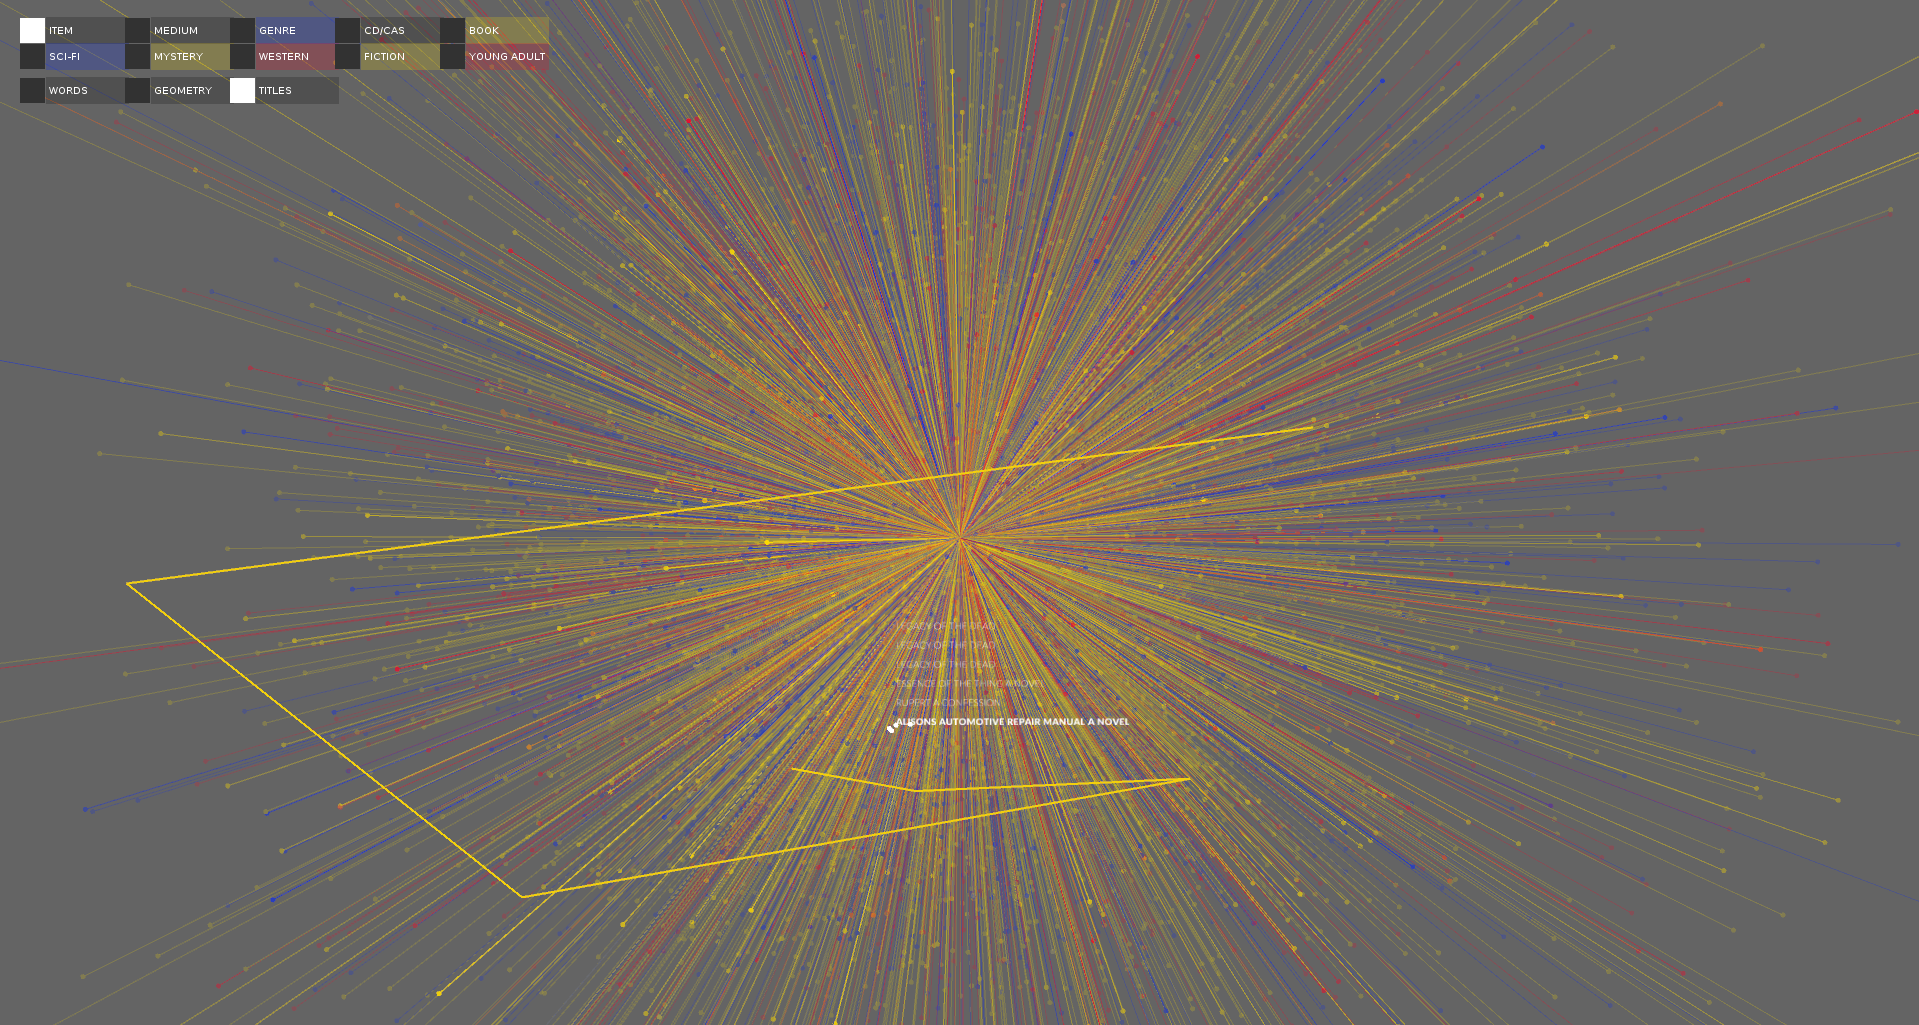
A visualization of the titles with one title selected and it's path drawn zoomed out.
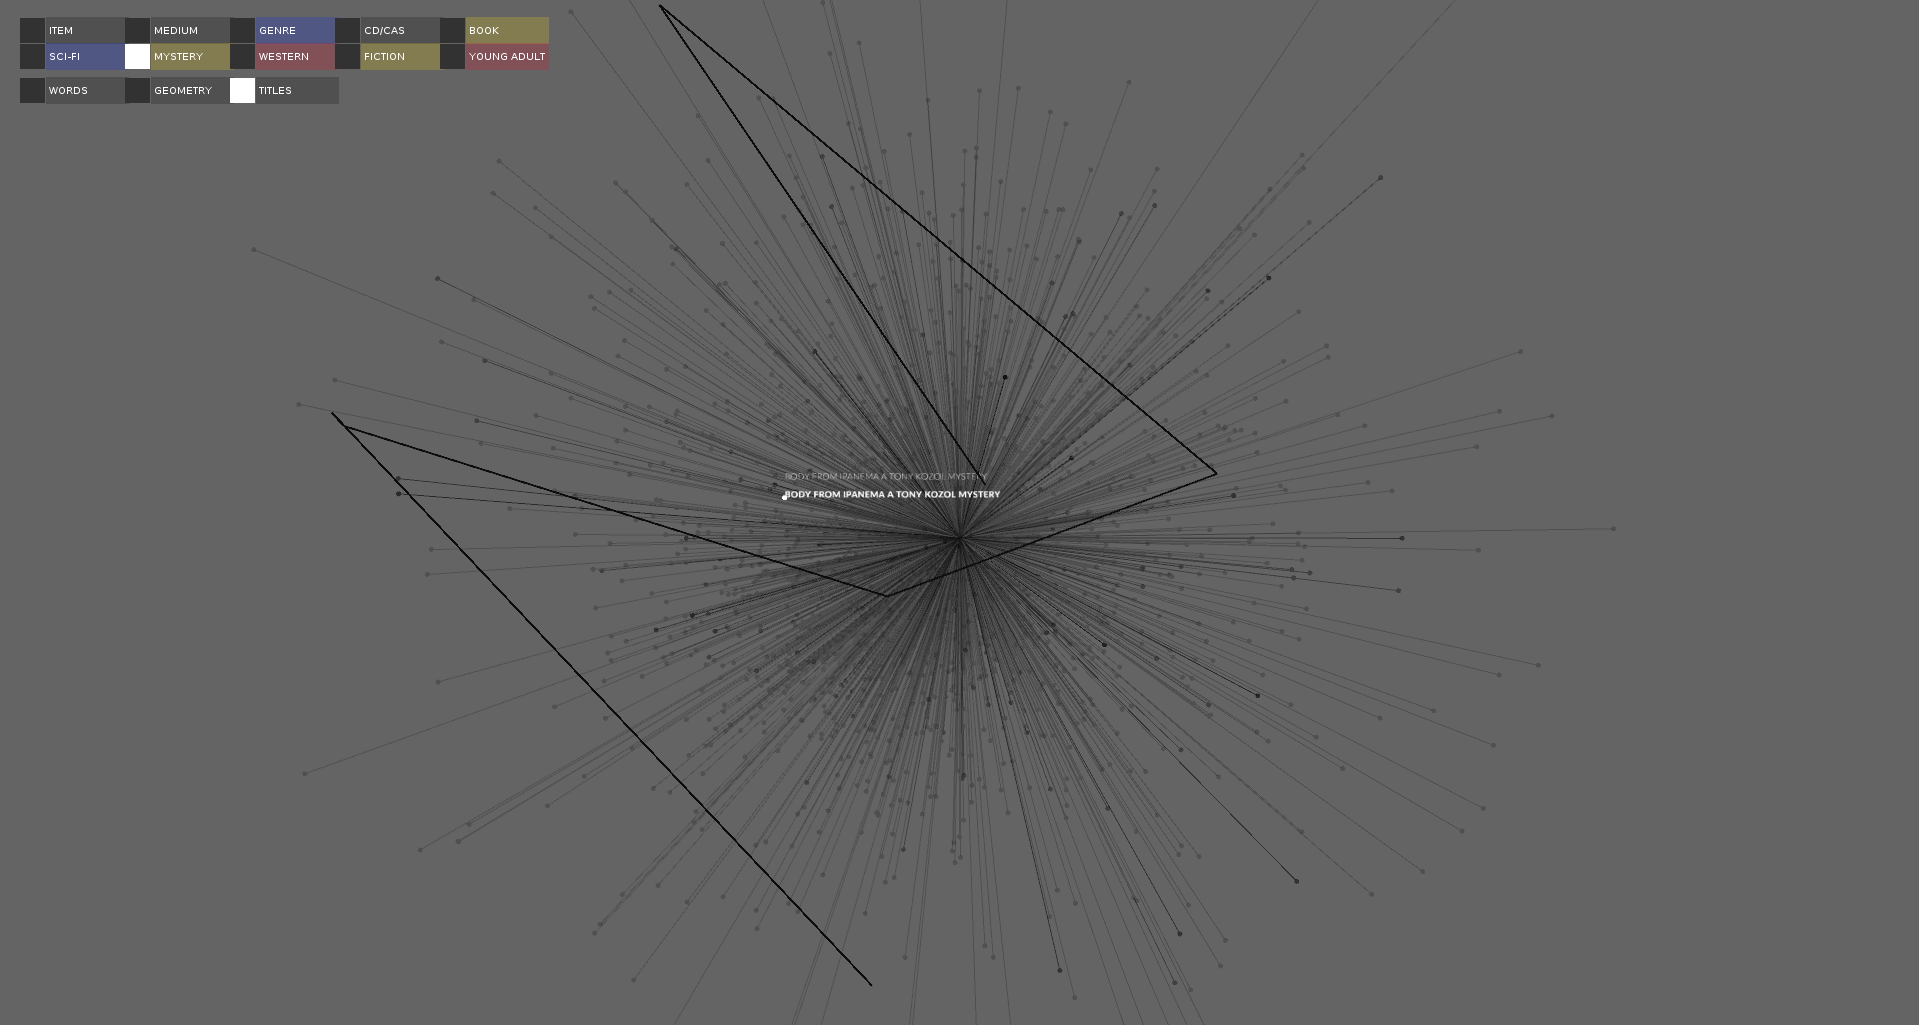
A filtered view of the visualization of the titles with one title selected and it's path drawn.
A visualization of the title geometry.
A visualization of the titles associated with the selected word over the geometry.
A visualization of the titles associated with the selected word over the point cloud.
A visualization of the titles as vectors.
A visualization of the titles with one title selected and it's path drawn zoomed in.
A visualization of the titles with one title selected and it's path drawn zoomed out.
A filtered view of the visualization of the titles with one title selected and it's path drawn.
Evaluation/Analysis
Figuring out the best way to visualize the relationships between words in titles was a complex problem. This project shows 3 different ways to visualize titles using the results from a word2vec analysis of the titles. I found the title paths the most meaningful way to visualize the titles.
The next step would be to generate the word cloud from a larger dataset, like all the fiction titles. More work could be done on designing the word2vec neural network to find the best results.
The next step would be to generate the word cloud from a larger dataset, like all the fiction titles. More work could be done on designing the word2vec neural network to find the best results.
Code