Cultural Interaction through Library Checkouts
MAT 259, Winter 2017
Kimberly Schlesinger
Concept
My goal in this project is to explore how often Seattle Public Library patrons check out media about different countries, and how these patterns differ between dewey categories and change over time. This will give an idea of the contexts in which SPL users most commonly interact with these cultures, and identify changing interest in different aspects of these cultures.
Query
I wrote a query for the total number of checkouts since 2006 in each dewey category that have the country's name or adjective (e.g., "Ireland" or "Irish") in the title. I started with a list of about twenty countries that sounded interesting to explore, and wrote a simple query to look at all the items with each specific country in the title or subject, ordered by number of checkouts. Using regular expressions, I made sure to allow for both the country name and its adjective — e.g., both “Ireland” and “Irish.”I chose a set of interesting countries with enough records to use, and grouped the results by year and by dewey division. I narrowed my original list to a set of 12 countries that had at least about 1,000 titles apiece to ensure I had enough records to work with.
Next, for each country, I broke up the number of checkouts by year, and binned by Dewey number (in increments of 10). I compiled a query to search for all 12 countries and sum up the number of checkouts per year and Dewey bin. I modified the query to search only for country names in titles, since those are already listed in the “outraw” table; searching in subjects requires joining the “subject” table to the “outraw” table, which takes an extremely long time to run when combined with the sum CASE statements for all countries. Including the country name condition in the WHERE statement as well as the sum CASE statements shortened the runtime somewhat, giving the CASE statements a smaller table to work with. Here is the final query, which runs in approximately 5 minutes:
SELECT year(cout), floor(deweyClass/10)*10 as deweyBin,
sum(CASE WHEN spl_2016.outraw.title LIKE "%mexic%" THEN 1 ELSE 0 END) as Mexico,
sum(CASE WHEN spl_2016.outraw.title LIKE "%ireland%" OR spl_2016.outraw.title LIKE "%irish%" THEN 1 ELSE 0 END) as Ireland,
sum(CASE WHEN spl_2016.outraw.title LIKE "%spain%" OR spl_2016.outraw.title LIKE "%spanish%" THEN 1 ELSE 0 END) as Spain,
sum(CASE WHEN spl_2016.outraw.title LIKE "%israel%" THEN 1 ELSE 0 END) as Israel,
sum(CASE WHEN spl_2016.outraw.title LIKE "%egypt%" THEN 1 ELSE 0 END) as Egypt,
sum(CASE WHEN spl_2016.outraw.title LIKE "%viet%nam%" THEN 1 ELSE 0 END) as Vietnam,
sum(CASE WHEN spl_2016.outraw.title LIKE "%german%" THEN 1 ELSE 0 END) as Germany,
sum(CASE WHEN spl_2016.outraw.title LIKE "%russia%" THEN 1 ELSE 0 END) as Russia,
sum(CASE WHEN spl_2016.outraw.title LIKE "%china%" OR spl_2016.outraw.title LIKE "%chinese%" THEN 1 ELSE 0 END) as China,
sum(CASE WHEN spl_2016.outraw.title LIKE "%cuba%" THEN 1 ELSE 0 END) as Cuba,
sum(CASE WHEN spl_2016.outraw.title LIKE "%iraq%" THEN 1 ELSE 0 END) as Iraq,
sum(CASE WHEN spl_2016.outraw.title LIKE "%japan%" THEN 1 ELSE 0 END) as Japan
FROM spl_2016.outraw
WHERE year(cout) > 2005
AND (spl_2016.outraw.title LIKE "%mexic%" OR
spl_2016.outraw.title LIKE "%ireland%" OR spl_2016.outraw.title LIKE "%irish%" OR
spl_2016.outraw.title LIKE "%spain%" OR spl_2016.outraw.title LIKE "%spanish%" OR
spl_2016.outraw.title LIKE "%israel%" OR
spl_2016.outraw.title LIKE "%egypt%" OR
spl_2016.outraw.title LIKE "%viet%nam%" OR
spl_2016.outraw.title LIKE "%german%" OR
spl_2016.outraw.title LIKE "%russia%" OR
spl_2016.outraw.title LIKE "%china%" OR spl_2016.outraw.title LIKE "%chinese%" OR
spl_2016.outraw.title LIKE "%cuba%" OR
spl_2016.outraw.title LIKE "%iraq%" OR
spl_2016.outraw.title LIKE "%japan%")
GROUP BY deweyBin, year(cout)
ORDER BY deweyBin, year(cout);
This data was then run through an external Python script to extract the maximum number of checkouts for each (year, dewey category) combination, which will be useful in scaling the final 2D visualization. I also created .csv files containing the names of all the countries used, as well as the overall total checkouts for each country for normalization purposes.
Preliminary sketch
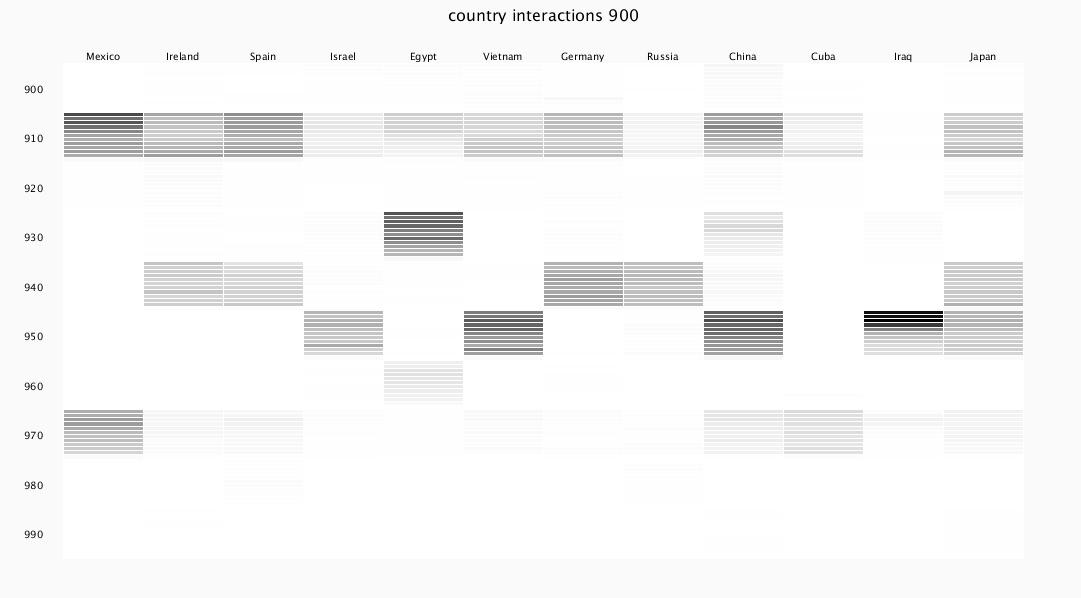
At first, I started by plotting the data as a grid, shown in the initial sketch below. Columns are countries, and rows correspond to (year, dewey category) combos. They are sorted by dewey class, and within class they are sorted by year. Grayscale intensity indicates number of checkouts of books with the name of the country or its possessive in the title. In this early stage, there is already interesting structure in the data, as certain countries stand out as particularly popular within certain dewey divisions.
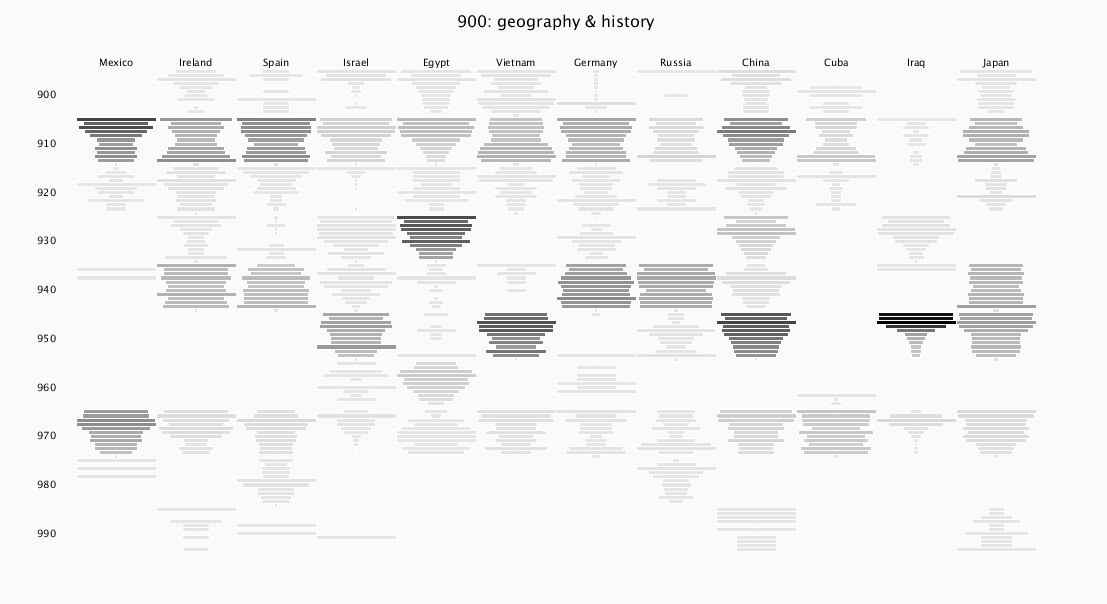
I wanted to make the temporal "profile" of popularity for each country within each dewey category stand out more clearly. In my next iteration, shown below, I accomplished this by changing the widths of the bars. Within each dewey category block, the top bar is 2006 and the year increases as the bars descend the screen, depicting the profile of popularity for the country in that category over the past decade. (Note: the bottom bar in each block shows data for 2017, which actually helps to distinguish the blocks from each other, because the 2017 bars are all very light/narrow and mostly look like gaps.)
I wanted to make the temporal "profile" of popularity for each country within each dewey category stand out more clearly. In my next iteration, shown below, I accomplished this by changing the widths of the bars. Within each dewey category block, the top bar is 2006 and the year increases as the bars descend the screen, depicting the profile of popularity for the country in that category over the past decade. (Note: the bottom bar in each block shows data for 2017, which actually helps to distinguish the blocks from each other, because the 2017 bars are all very light/narrow and mostly look like gaps.)
Process
In addition to the above sketches, which began as just plotting rectangles based on a class demo and then altering their shapes to fit the data, I explored how to make text displays that change with the mouse location, to give more information about the data. I also added other elements of interactivity, such as color and normalisation.
Final result
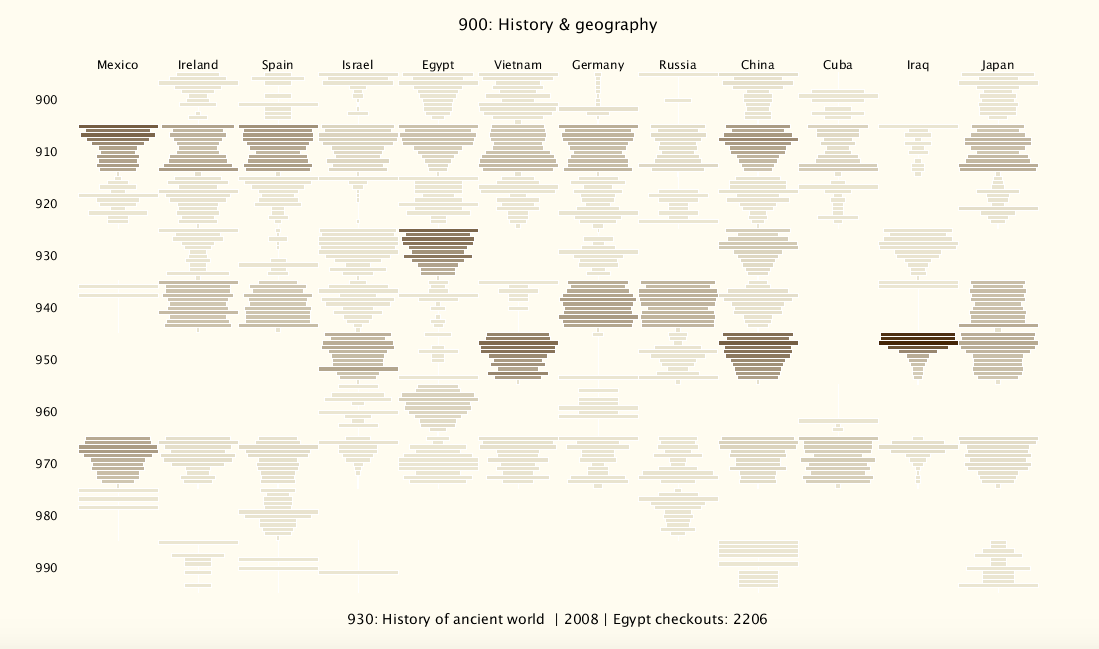
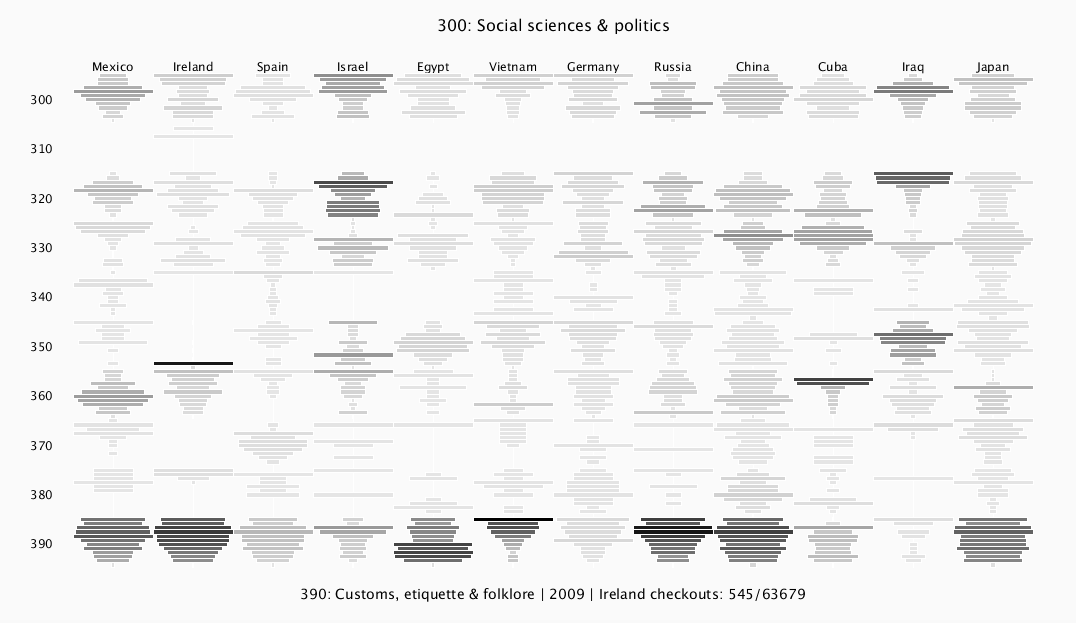
Screen shots of the final version, both colored and non-colored, are shown below. The display can be switched between different dewey classes (900s, 800s, etc.) by pressing the number keys (0-9). The 900 level and the 300 level are shown here.
By default, all the bar intensities correspond directly to number of overall checkouts, so intensities can be compared between countries and years in the same panel. The bar widths are renormalized within each individual dewey category "block" -- the most popular year within each block has a bar that spans the whole block, and the remaining bars in that block are scaled proportionally to that longest bar. This creates a distinctive shape within each block that represents the waxing and/or waning of interest in that country/category over the years. The darkest bars in the entire layout still correspond to the most popular overall categories. For example, "Iraq" has bars that span the whole column in both 930 and 950, representing the most popular year in each block. But the color shows that there were many more checkouts in 950 overall compared to 930.
The most significant interactive feature is a mouse-over component. Mousing over a bar will print the country, the year, and the information about that dewey classification (e.g. "war/military" for 350, "the Bible" for 220, "ancient history" for 930, "home and family management" for 640). This is displayed at the bottom of the visualization, along with the total number of checkouts in that category/country/year, and provides much more meaning to explorations of the data.
Since some countries have consistently many more checkouts overall than others (China has the most), I added the ability to normalize by total overall checkouts per country by pressing the "n" key. This sometimes prevents China's intensities from overpowering the other ones. In the screen shots, the 300-layer version is normalized, and the overall total checkouts for the country are also displayed.
I added a color scheme, which can be turned on/off by pressing "c." After talking about it in class, I think that the black and white version actually brings out the data and patterns quite clearly, so I stuck with a very subtle color scheme that uses brown tones and slowly changes the saturation with the number of checkouts (visible in the screen shot above). I accomplished this by using two RGB colors and interpolating between them, using the processing function "lerpColor," but a better way may have been to switch to HSB mode and directly alter the saturation.
Code
This project was developed with Processing, with the code included here. The query for the main .csv file is included (commented out) in a .pde file. I also wrote a python script to take the main .csv file and generate a new .csv file that lists the maximum number of checkouts for each dewey category "block," which is necessary for calculating the box widths. Both .csv files are included here, along with the python script for reference.
Source Code + Data