People's habit of keeping their precious moments in form of photographs is intersting and study-worthy. Contributed by that hobby, there grows up a massive dataset of photographs in social networks like Instgram and Flickr. This project aims to explore the general patterns of when, where and how people take photos, through the basic geo, time information of each photo on Flickr shot within certain period. On the other hand, this project aims to see beyond the visible photograph content, thereby making inferences, about invisible metaphorical background of the photgraph based on the photograph's EXIF.
I choose the data that is most related to exposure in EXIF of each photo, the F-number(Aperture), Shutter speed and ISO to calculate Exposure Value(EV) of each photo. EV, to some extent can reveals the lighting condition where the photo is taken. With EV, I can infer the the intensity of sunlight or the shot time in a day.
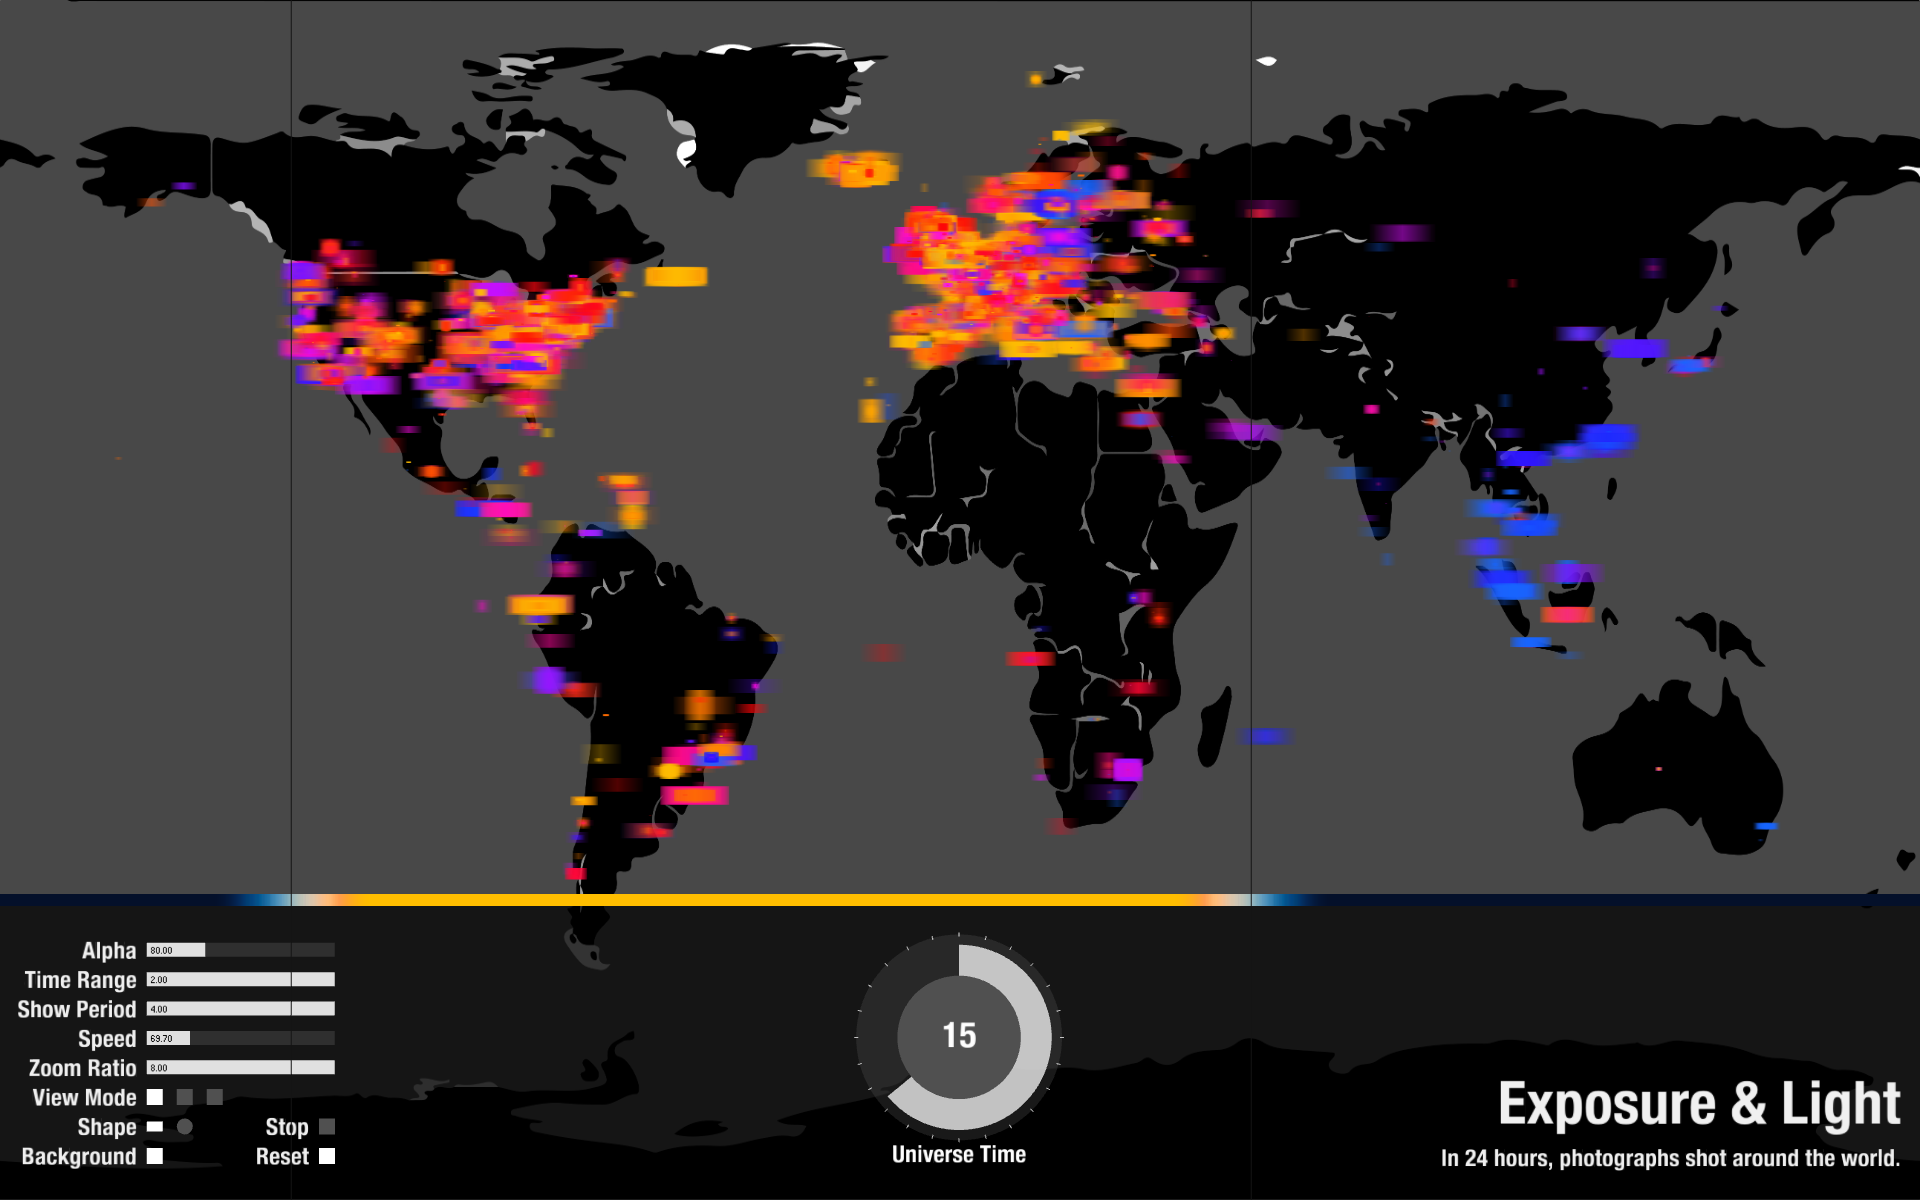
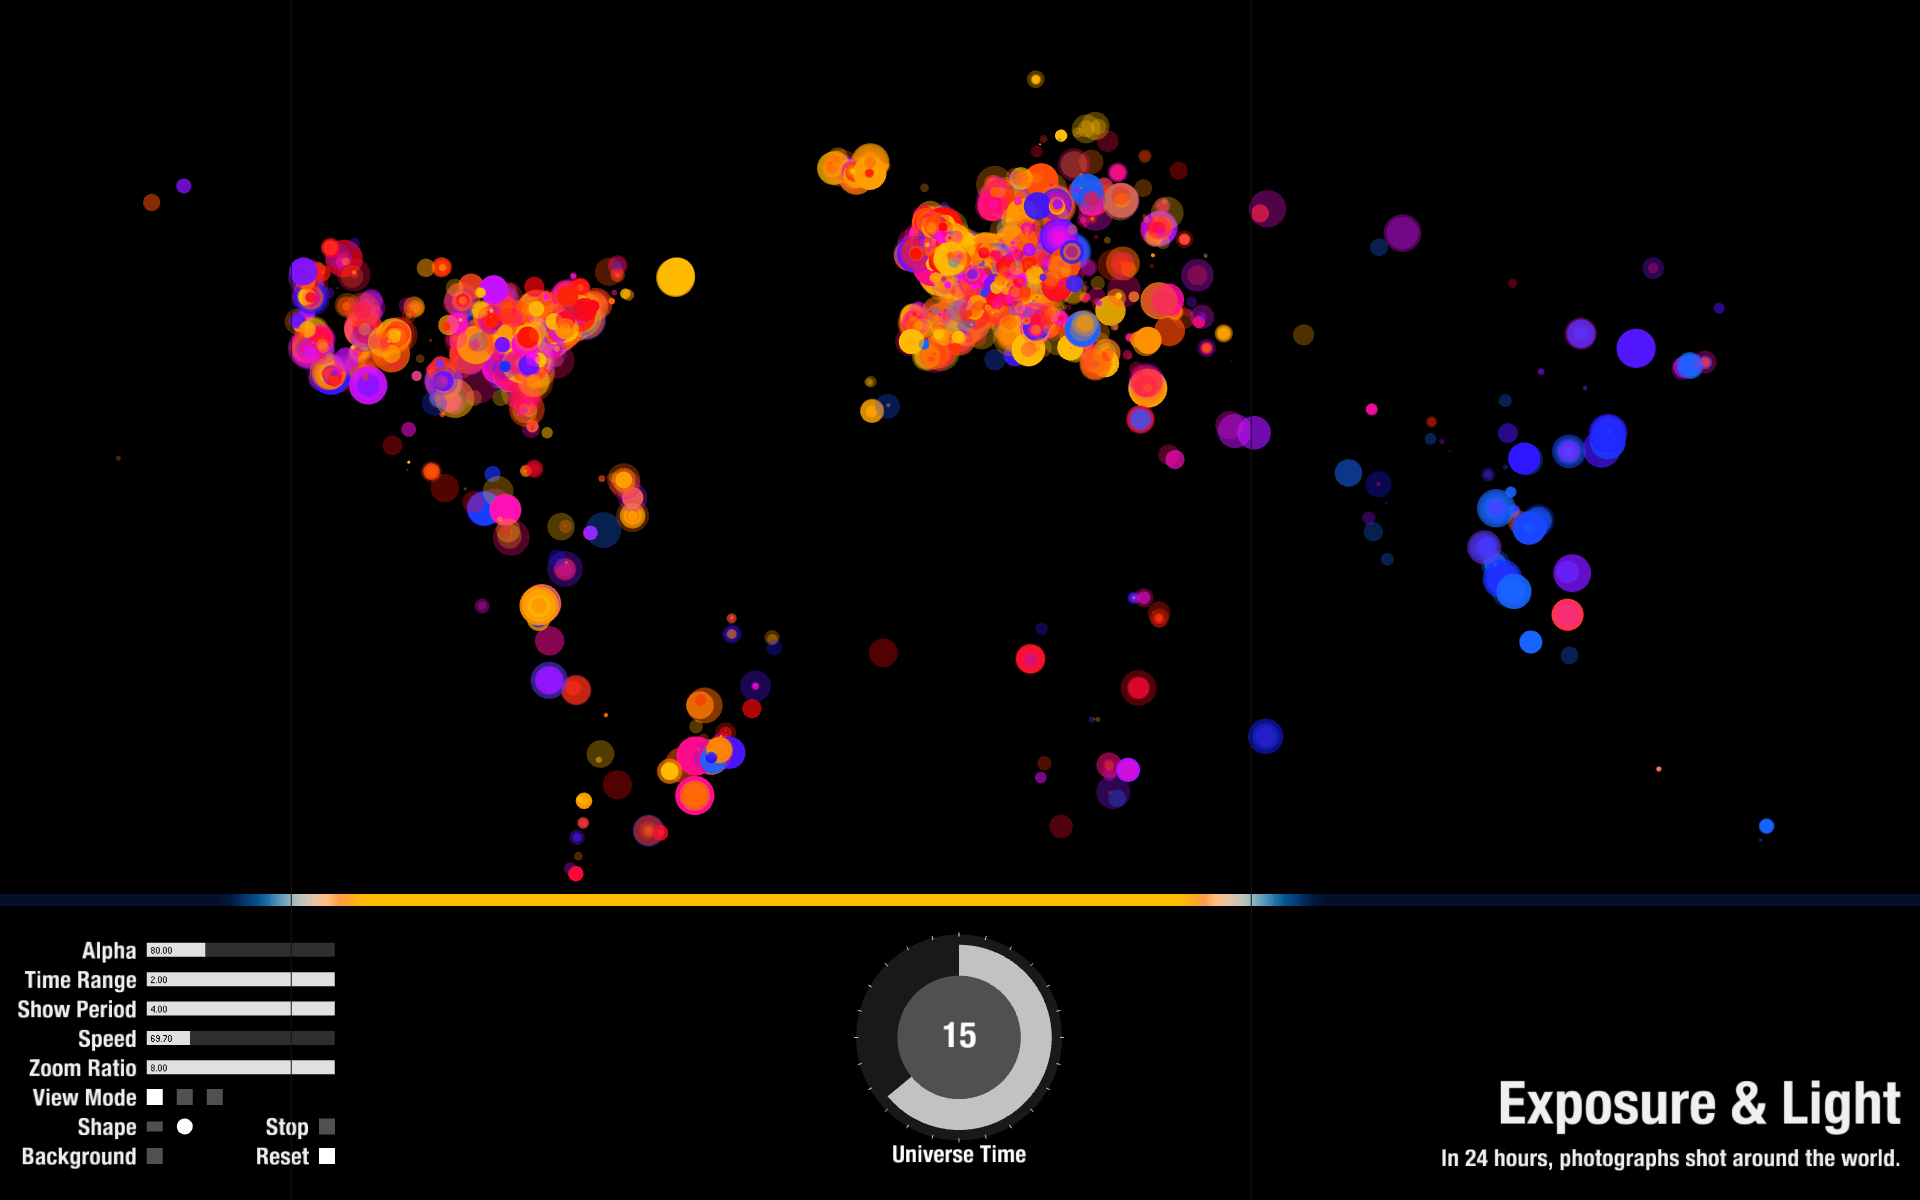
The main idea is to draw out each photo as a cell on the world map. The geo information tells where to draw it, the shot time determines when, and the EV or actual color value determines the cell's color. In addition, focal length determines the shape of the cell. By this way, user can see both the general pattern of people's photography activity and the indrect patterns of images' EV and average color.
StringList photoID;
Table table;
String api_key;
void setup() {
size(100,100,P2D);
api_key="ed88994bbcb534c7c994f858de1f7d75";
photoID = new StringList();
table = new Table();
table.addColumn("id");
table.addColumn("Time");
table.addColumn("ExposureTime");
table.addColumn("Aperture");
table.addColumn("ISO");
table.addColumn("FocalLength");
table.addColumn("Lon");
table.addColumn("Lat");
float[] bbox = new float[4];
bbox[0] = -180;
bbox[1] = -90;
bbox[2] = 180;
bbox[3] = 90;
String date = "2015-07-17";
for (int t = 0; t<48; t++) {
table = new Table();
table.addColumn("id");
table.addColumn("Time");
table.addColumn("ExposureTime");
table.addColumn("Aperture");
table.addColumn("ISO");
table.addColumn("FocalLength");
table.addColumn("Lon");
table.addColumn("Lat");
table.addColumn("Red");
table.addColumn("Green");
table.addColumn("Blue");
int page = 1;
int pages = 1;
String JSON_url = getJSONUrl(date, t, bbox, page);
//println(JSON_url);
JSONObject jsobj = loadJSONObject(JSON_url);
if (jsobj.getString("stat").equals("ok")) {
pages = jsobj.getJSONObject("photos").getInt("pages");
}
println(pages);
for (int i =1; i<=pages; i++) {
JSON_url = getJSONUrl(date, t, bbox, i);
//println(JSON_url);
jsobj = loadJSONObject(JSON_url);
if (jsobj.getString("stat").equals("ok")) {
JSONArray photoArray = jsobj.getJSONObject("photos").getJSONArray("photo");
for (int j = 0; j < photoArray.size(); j ++) {
photoID.append(photoArray.getJSONObject(j).getString("id"));
String onePhotoID = photoArray.getJSONObject(j).getString("id");
String exposure="";
String fNumber="";
String iso="";
String focalLength="";
String shootDate = "";
int shootTime = 0;
float longitude = 0;
float latitude = 0;
float red = 0 ;
float green = 0;
float blue = 0;
String url_exif = " https://api.flickr.com/services/rest/?method=flickr.photos.getExif"
+ "&api_key=" + api_key
+ "&photo_id=" + onePhotoID
+ "&format=json&nojsoncallback=1";
JSONObject jsobj2 = loadJSONObject(url_exif);
//saveJSONObject(jsobj2, "data/"+ onePhotoID+".json");
if (!jsobj2.isNull("photo")) {
JSONArray tempArray = jsobj2.getJSONObject("photo").getJSONArray("exif");
//println(tempJSON2.getJSONObject("photo").getString("id"));
for (int k = 0; k
String tag = oneExifLine.getString("tag");
//println(label);
if (tag.equals("ExposureTime")) {
exposure = oneExifLine.getJSONObject("raw").getString("_content");
//hm.put(photoId, "ExposureTime"+exposure);
}
if (tag.equals("FNumber")) {
fNumber = oneExifLine.getJSONObject("raw").getString("_content");
//hm.put(photoId, "FNumber"+exposure);
}
if (tag.equals("ISO")) {
iso= oneExifLine.getJSONObject("raw").getString("_content");
//hm.put(photoId, "ISO"+exposure);
}
if (tag.equals("FocalLength")) {
focalLength = oneExifLine.getJSONObject("raw").getString("_content");
//hm.put(photoId, "FocalLength"+exposure);
}
if (tag.equals("DateTimeOriginal")) {
shootDate = oneExifLine.getJSONObject("raw").getString("_content");
int hour=0;
int minute=0;
int second=0;
if (shootDate.length() > 1) {
hour = parseInt(shootDate.substring(11, 13));
minute = parseInt(shootDate.substring(14, 16));
shootTime = 3600*hour+60*minute+second;
//println(" hour: "+str(hour)
//+" minute: "+str(minute)
//+" second: "+str(second)
//+" time: "+str(dataMatrix[i][0]));
}
//hm.put(photoId, "FocalLength"+exposure);
}
}
}
String url_geo ="https://api.flickr.com/services/rest/?method=flickr.photos.geo.getLocation"
+ "&api_key="+ api_key
+ "&photo_id=" + onePhotoID
+ "&format=json&nojsoncallback=1";
JSONObject jsobj3 = loadJSONObject(url_geo);
//saveJSONObject(jsobj3, "data/geo_"+ onePhotoID+".json");
if (jsobj3.getString("stat").equals("ok")) {
//println(onePhotoID);
longitude = jsobj3.getJSONObject("photo").getJSONObject("location").getFloat("longitude");
latitude = jsobj3.getJSONObject("photo").getJSONObject("location").getFloat("latitude");
}
String url_size = "https://api.flickr.com/services/rest/?method=flickr.photos.getSizes"
+ "&api_key=" + api_key
+ "&photo_id=" + onePhotoID
+ "&format=json&nojsoncallback=1";
JSONObject jsobj4 = loadJSONObject(url_size);
if (jsobj4.getString("stat").equals("ok")) {
JSONArray jsa = jsobj4.getJSONObject("sizes").getJSONArray("size");
for (int ss=0; ss < jsa.size(); ss++) {
JSONObject ssJSO = jsa.getJSONObject(ss);
if (ssJSO.getString("label").equals("Thumbnail")) {
String url_img_raw = ssJSO.getString("source");
String[] url_img_parts = splitTokens(url_img_raw, "\\");
String url_img = join(url_img_parts, "");
//println(url_img);
float [] rgb = averageColor(url_img, "data/img/"+date+"/"+str(t)+"/"+onePhotoID+".jpg");
red = rgb[0];
green = rgb[1];
blue = rgb[2];
//println(rgb);
}
}
}
TableRow row = table.addRow();
row.setString("id", onePhotoID);
row.setInt("Time", shootTime);
row.setString("ExposureTime", exposure);
row.setString("Aperture", fNumber);
row.setString("ISO", iso);
row.setString("FocalLength", focalLength);
row.setFloat("Lon", longitude);
row.setFloat("Lat", latitude);
row.setFloat("Red", red);
row.setFloat("Green", green);
row.setFloat("Blue", blue);
}
}
}
saveTable(table, "data/"+date+"_"+str(t)+"_withColor.csv");
println(photoID.size());
//saveJSONObject(jsobj,"data/"+startDate+"_"+str(page)+".json");
}
}
String getJSONUrl(String date, int t, float[] bbox, int page) {
String JSON_url = "https://api.flickr.com/services/rest/?method=flickr.photos.search"
+ "&api_key=" + api_key
+ "&min_taken_date=" + date + "+" + nf(t/2, 2) + "%3A" + nf(t%2*30, 2) + "%3A00"
+ "&max_taken_date=" + date + "+" + nf((t+1)/2, 2) + "%3A" + nf((t+1)%2*30, 2) + "%3A00"
+ "&sort=date-taken-asc"
+ "&bbox=" + str(bbox[0]) + "%2C+" + str(bbox[1]) + "%2C+"+ str(bbox[2]) + "%2C+" + str(bbox[3])
+ "&accuracy=11&has_geo=1"
+ "&page=" + str(page)
+ "&format=json&nojsoncallback=1";
println(JSON_url);
return JSON_url;
}
float[] averageColor(String img_url, String output_url) {
PImage img = loadImage(img_url);
int imgWidth = img.width;
int imgHeight = img.height;
//PGraphics pg = createGraphics(imgWidth, imgHeight, P2D, output_url);
//pg.size(imgWidth,imgHeight);
saveStream(output_url,img_url);
//pg.beginDraw();
//pg.image(img, 0, 0);
//pg.endDraw();
//pg.save("11.png");
float redSum = 0 ;
float greenSum = 0;
float blueSum = 0;
for (int i = 0; i
redSum += red(c);
greenSum += green(c);
blueSum += blue(c);
}
}
float[] rgb = new float[3];
rgb[0] = redSum/(imgWidth*imgHeight);
rgb[1] = greenSum/(imgWidth*imgHeight);
rgb[2] = blueSum/(imgWidth*imgHeight);
return rgb;
} 2. Organize the data
Table[] dataTable;
Table outputTable;
Table inputTable;
void setup() {
outputTable = new Table();
outputTable.addColumn("id");
outputTable.addColumn("Time");
outputTable.addColumn("ExposureTime");
outputTable.addColumn("Aperture");
outputTable.addColumn("ISO");
outputTable.addColumn("FocalLength");
outputTable.addColumn("Lon");
outputTable.addColumn("Lat");
outputTable.addColumn("Red");
outputTable.addColumn("Green");
outputTable.addColumn("Blue");
outputTable.addColumn("ImgDic");
for (int i = 24; i<48; i++) {
inputTable = loadTable("2015-07-16_"+str(i)+"_withColor.csv", "header");
for (int j = 0; j
TableRow temprow = outputTable.addRow(inputTable.getRow(j));
temprow.setInt("ImgDic", 16*100+i);
}
}
}
for (int i = 0; i<48; i++) {
inputTable = loadTable("2015-07-17_"+str(i)+"_withColor.csv", "header");
for (int j = 0; j
TableRow temprow = outputTable.addRow(inputTable.getRow(j));
temprow.setInt("ImgDic", 17*100+i);
}
}
}
for (int i = 0; i<24; i++) {
inputTable = loadTable("2015-07-18_"+str(i)+"_withColor.csv", "header");
for (int j = 0; j
TableRow temprow = outputTable.addRow(inputTable.getRow(j));
temprow.setInt("ImgDic", 18*100+i);
}
}
}
saveTable(outputTable, "tableNew.csv");
}
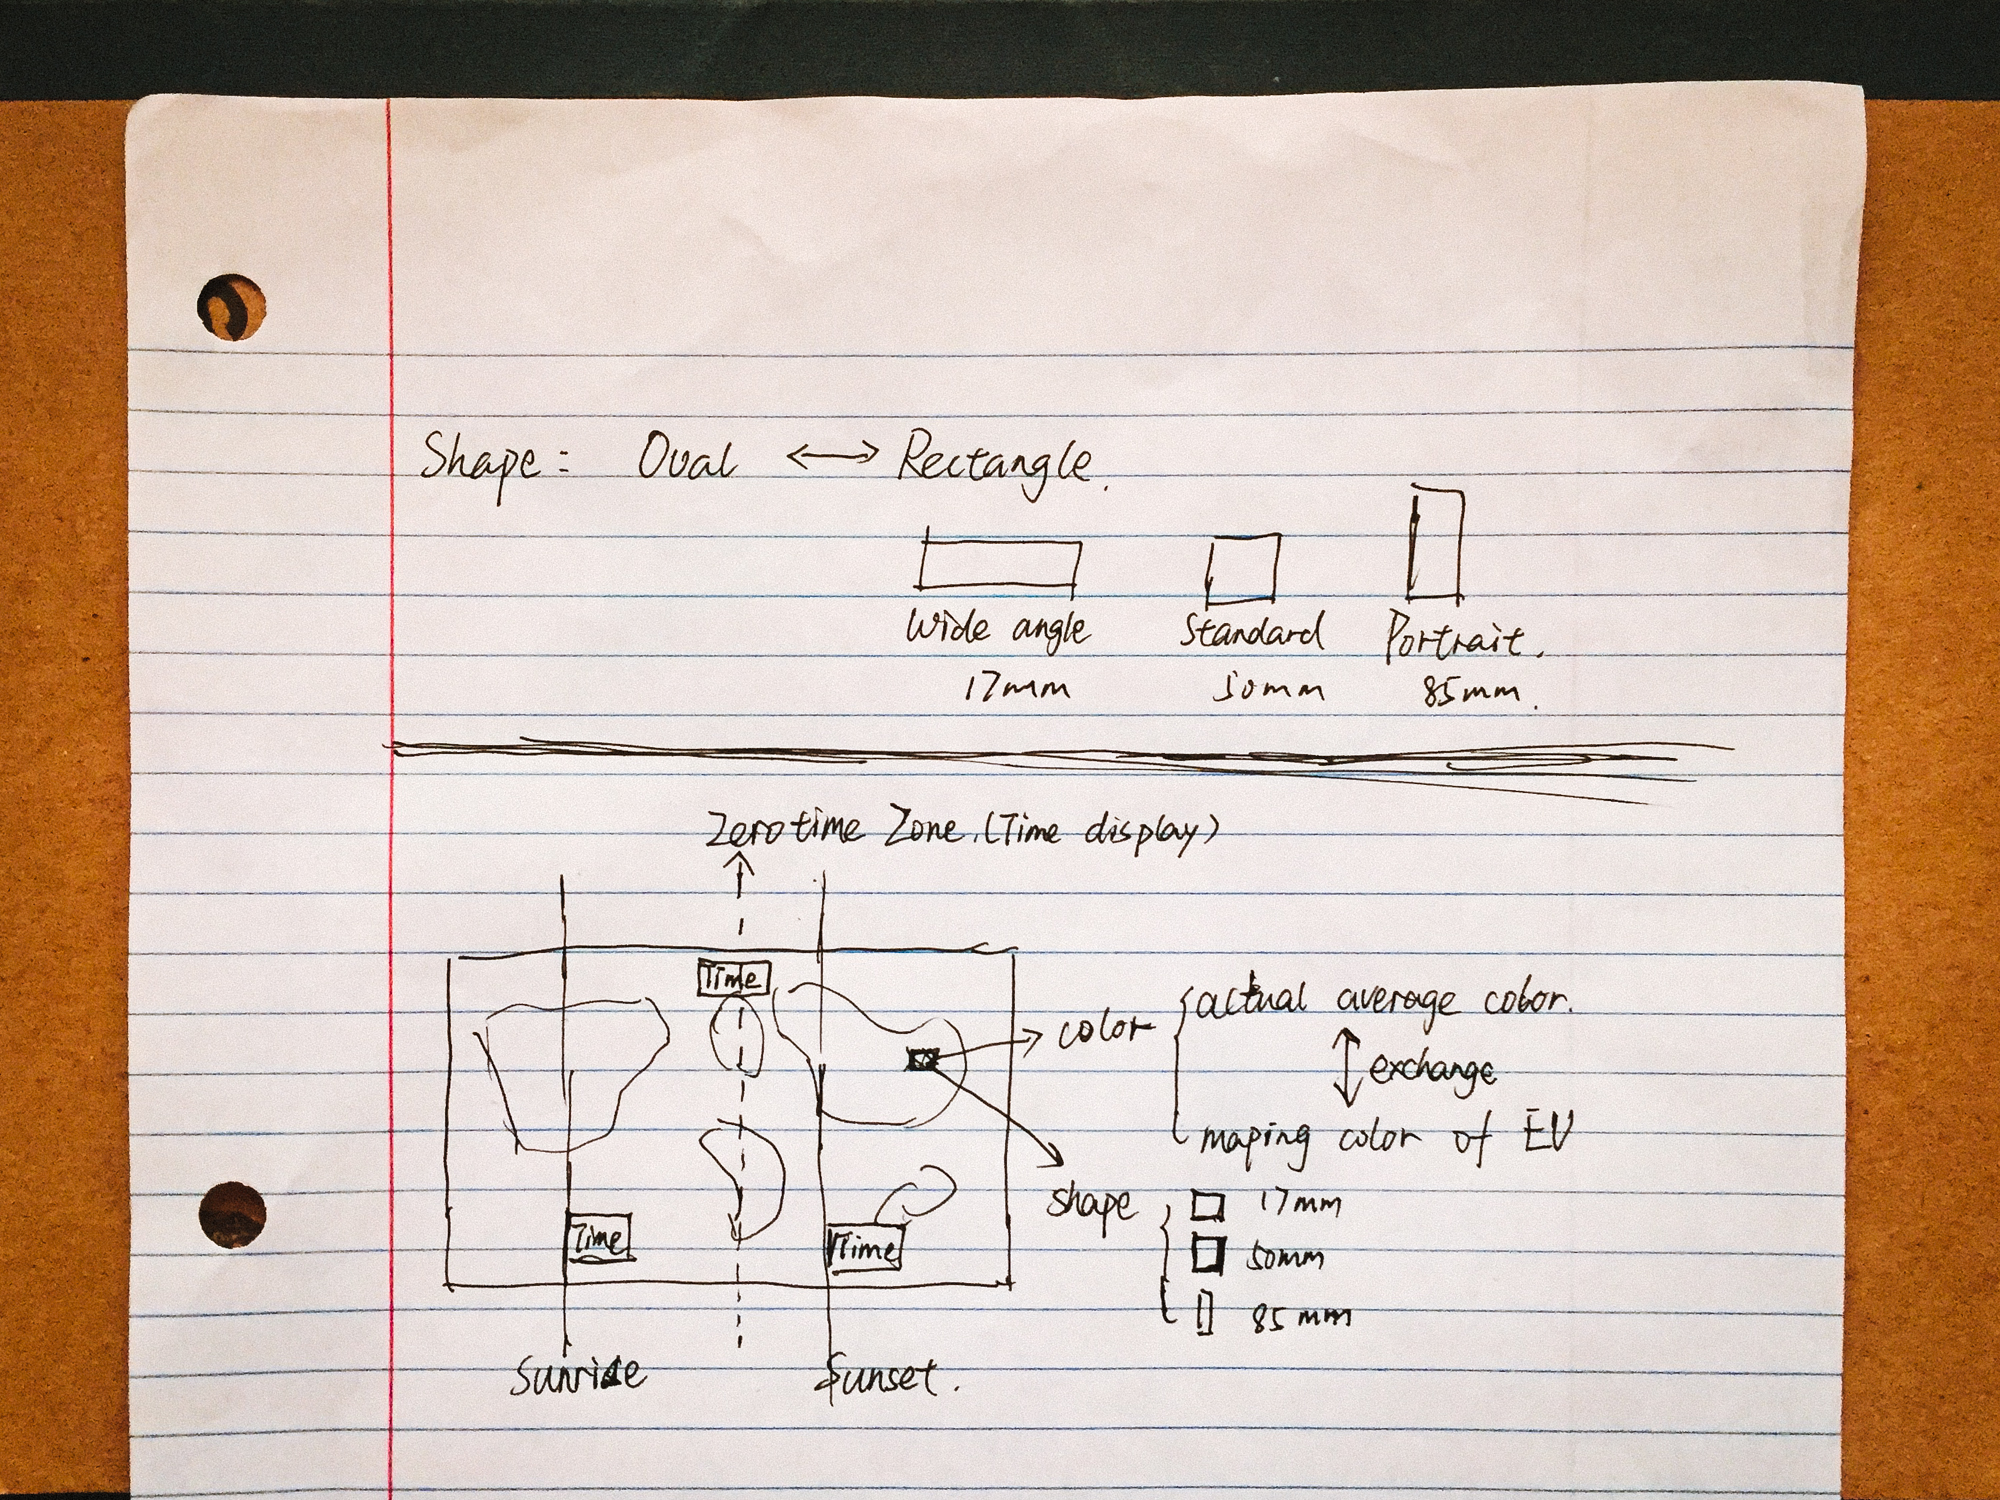
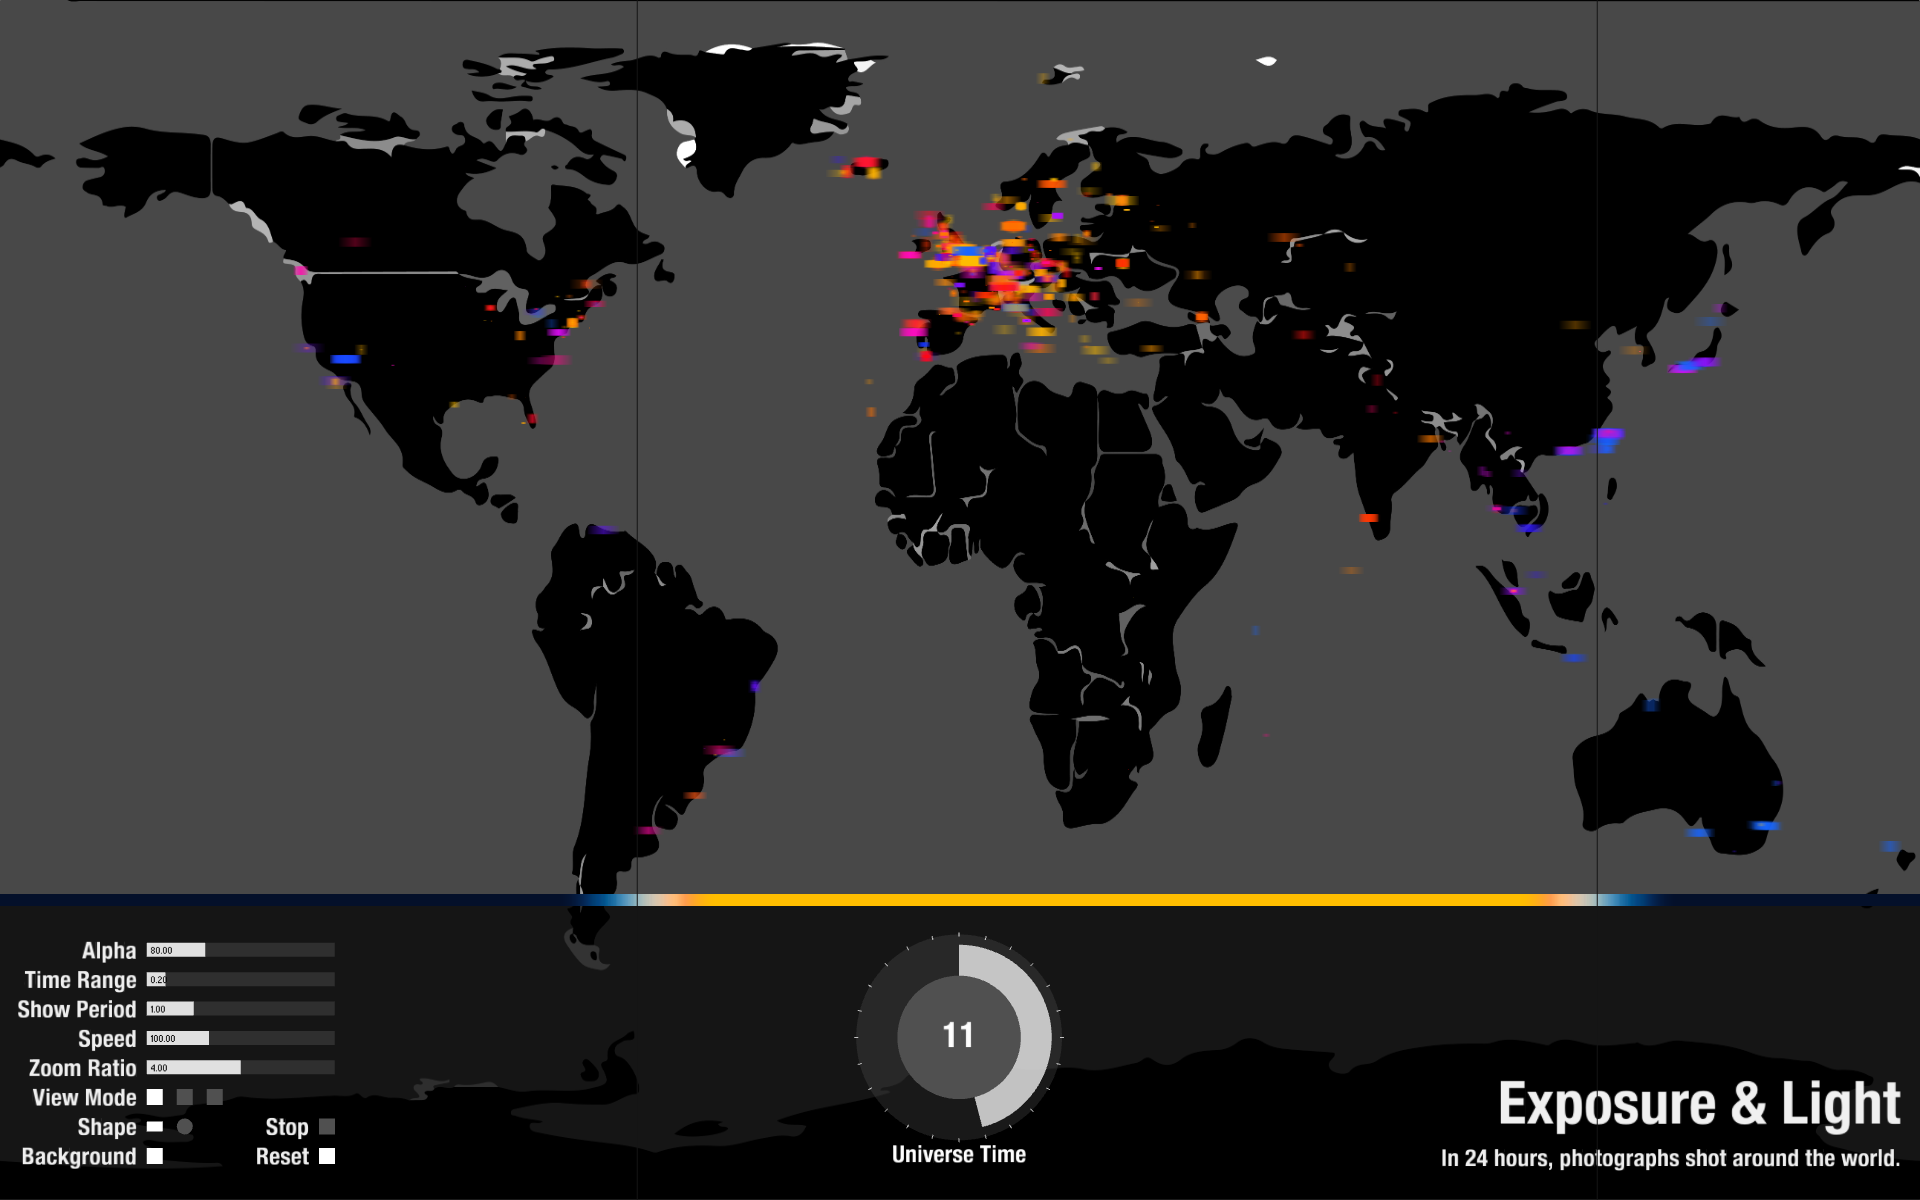
This sketch mainly demonstrates how to decide each cells color and shape. The idea is to map the Exposure Value(EV) into colors, ranging from blue to red and then to yellow as EV increases. Moreover, whether the shape is landscape-direction or portrait-direction is decided by focal length.
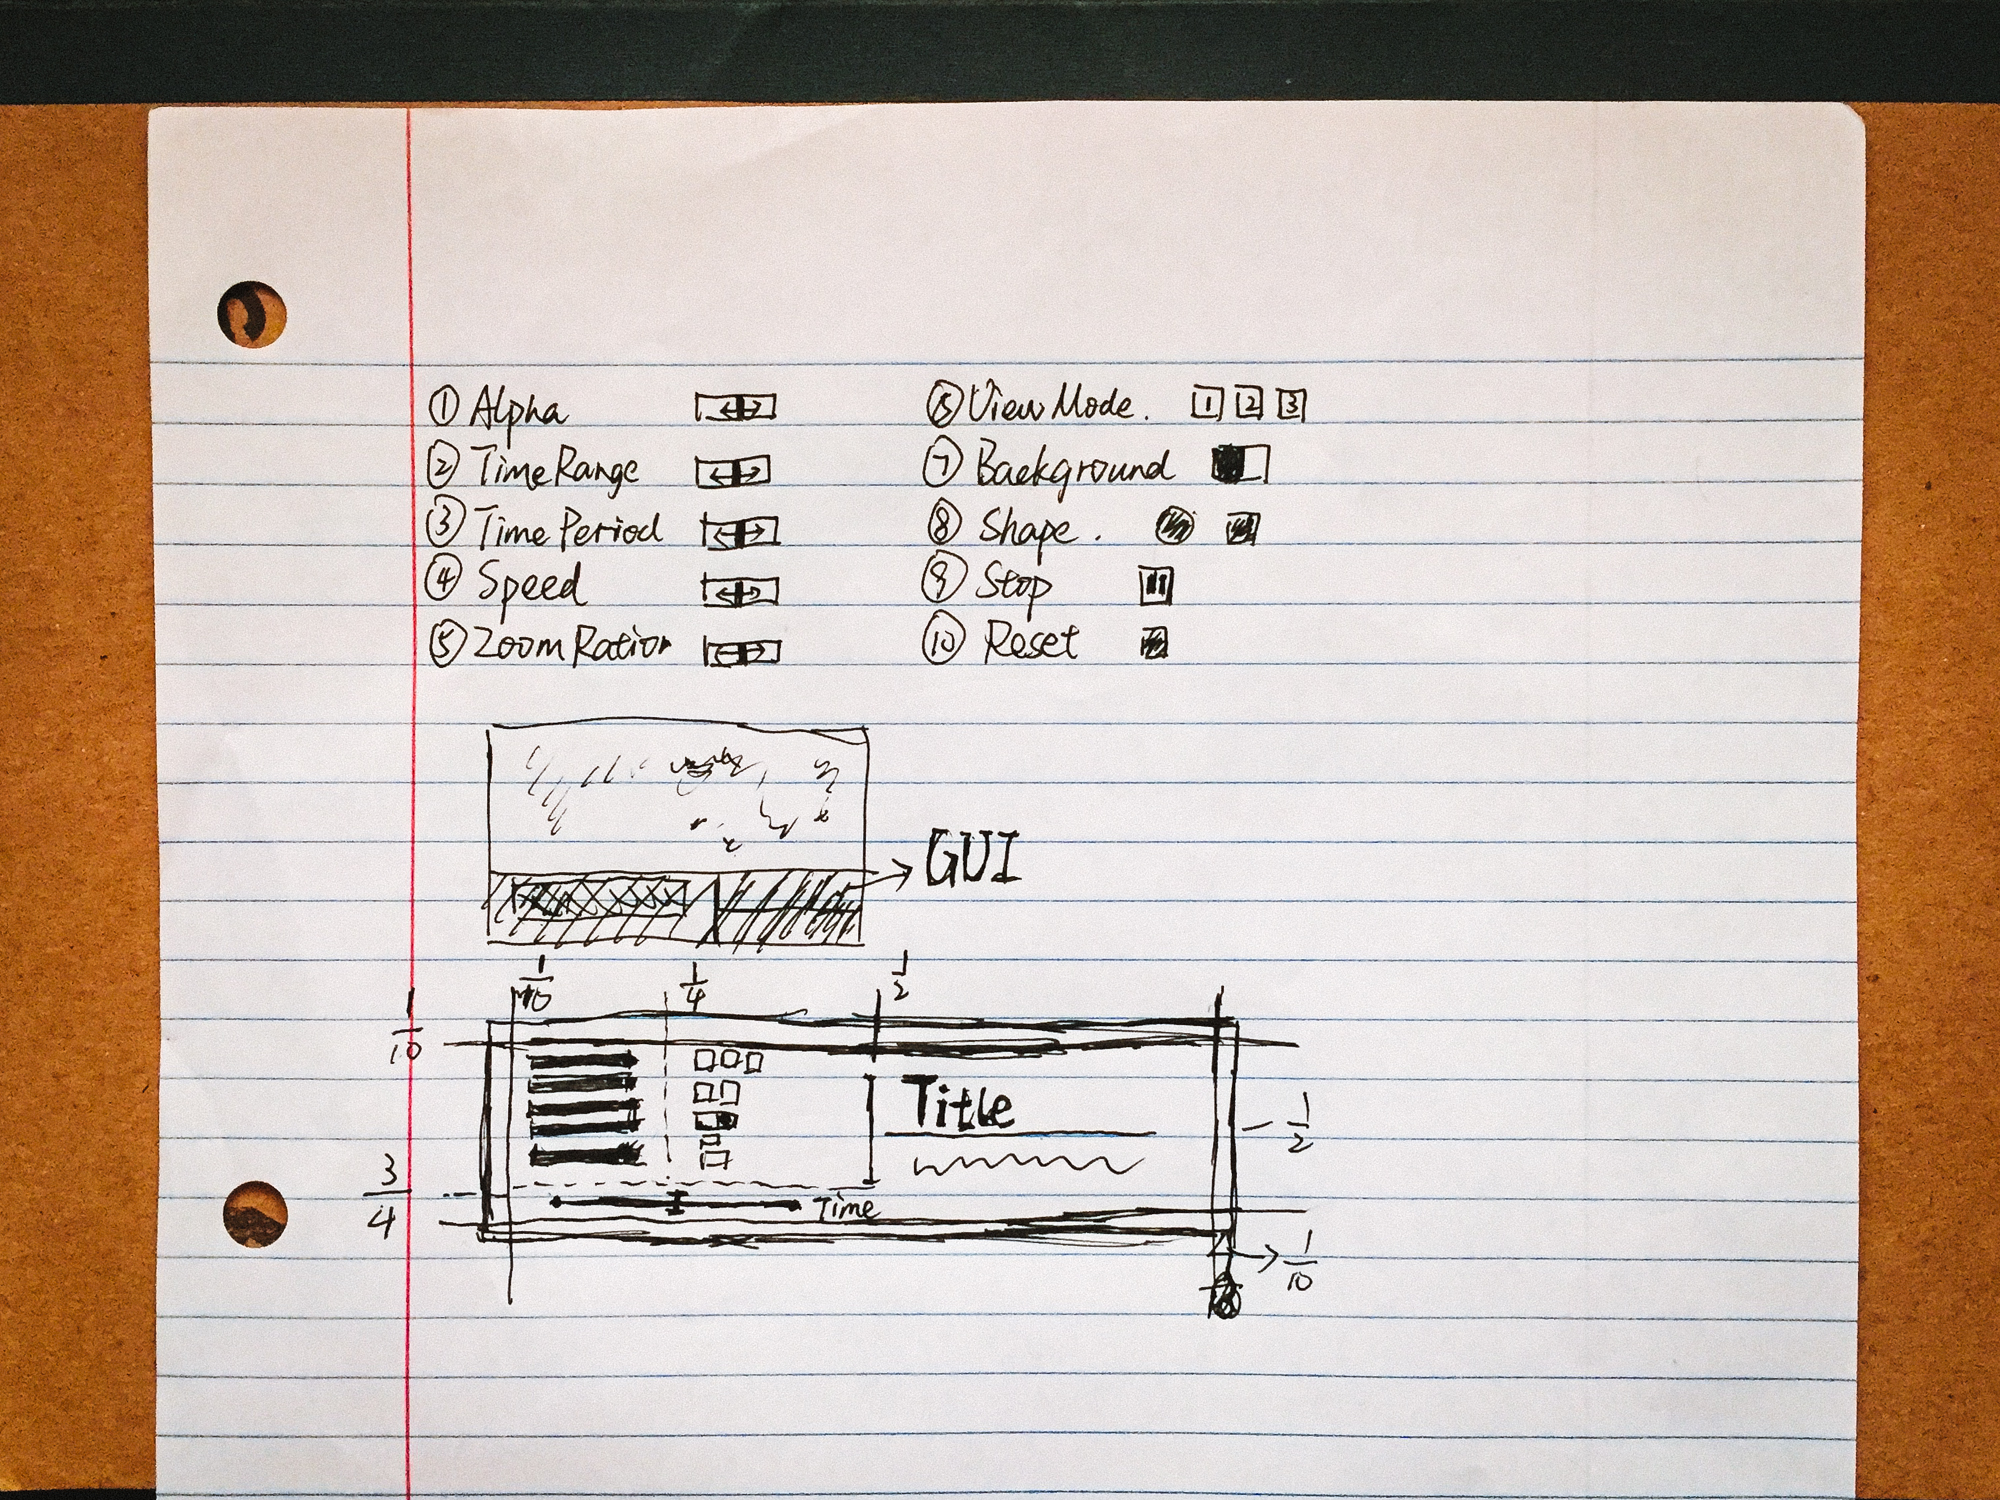
This sketch manly shows the layout of the foot area, which is the user interface. I arrange the controllers mainly at the left area and the title texts right area.
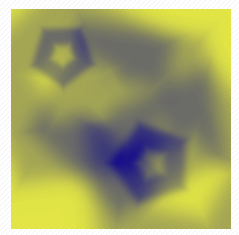
I was inspired by this kind of effect. I am thinking to make each photo a low-transparency color shape, which could be ellipse, rectangle or polygon, and make photos overlap together but not completely covered by others.
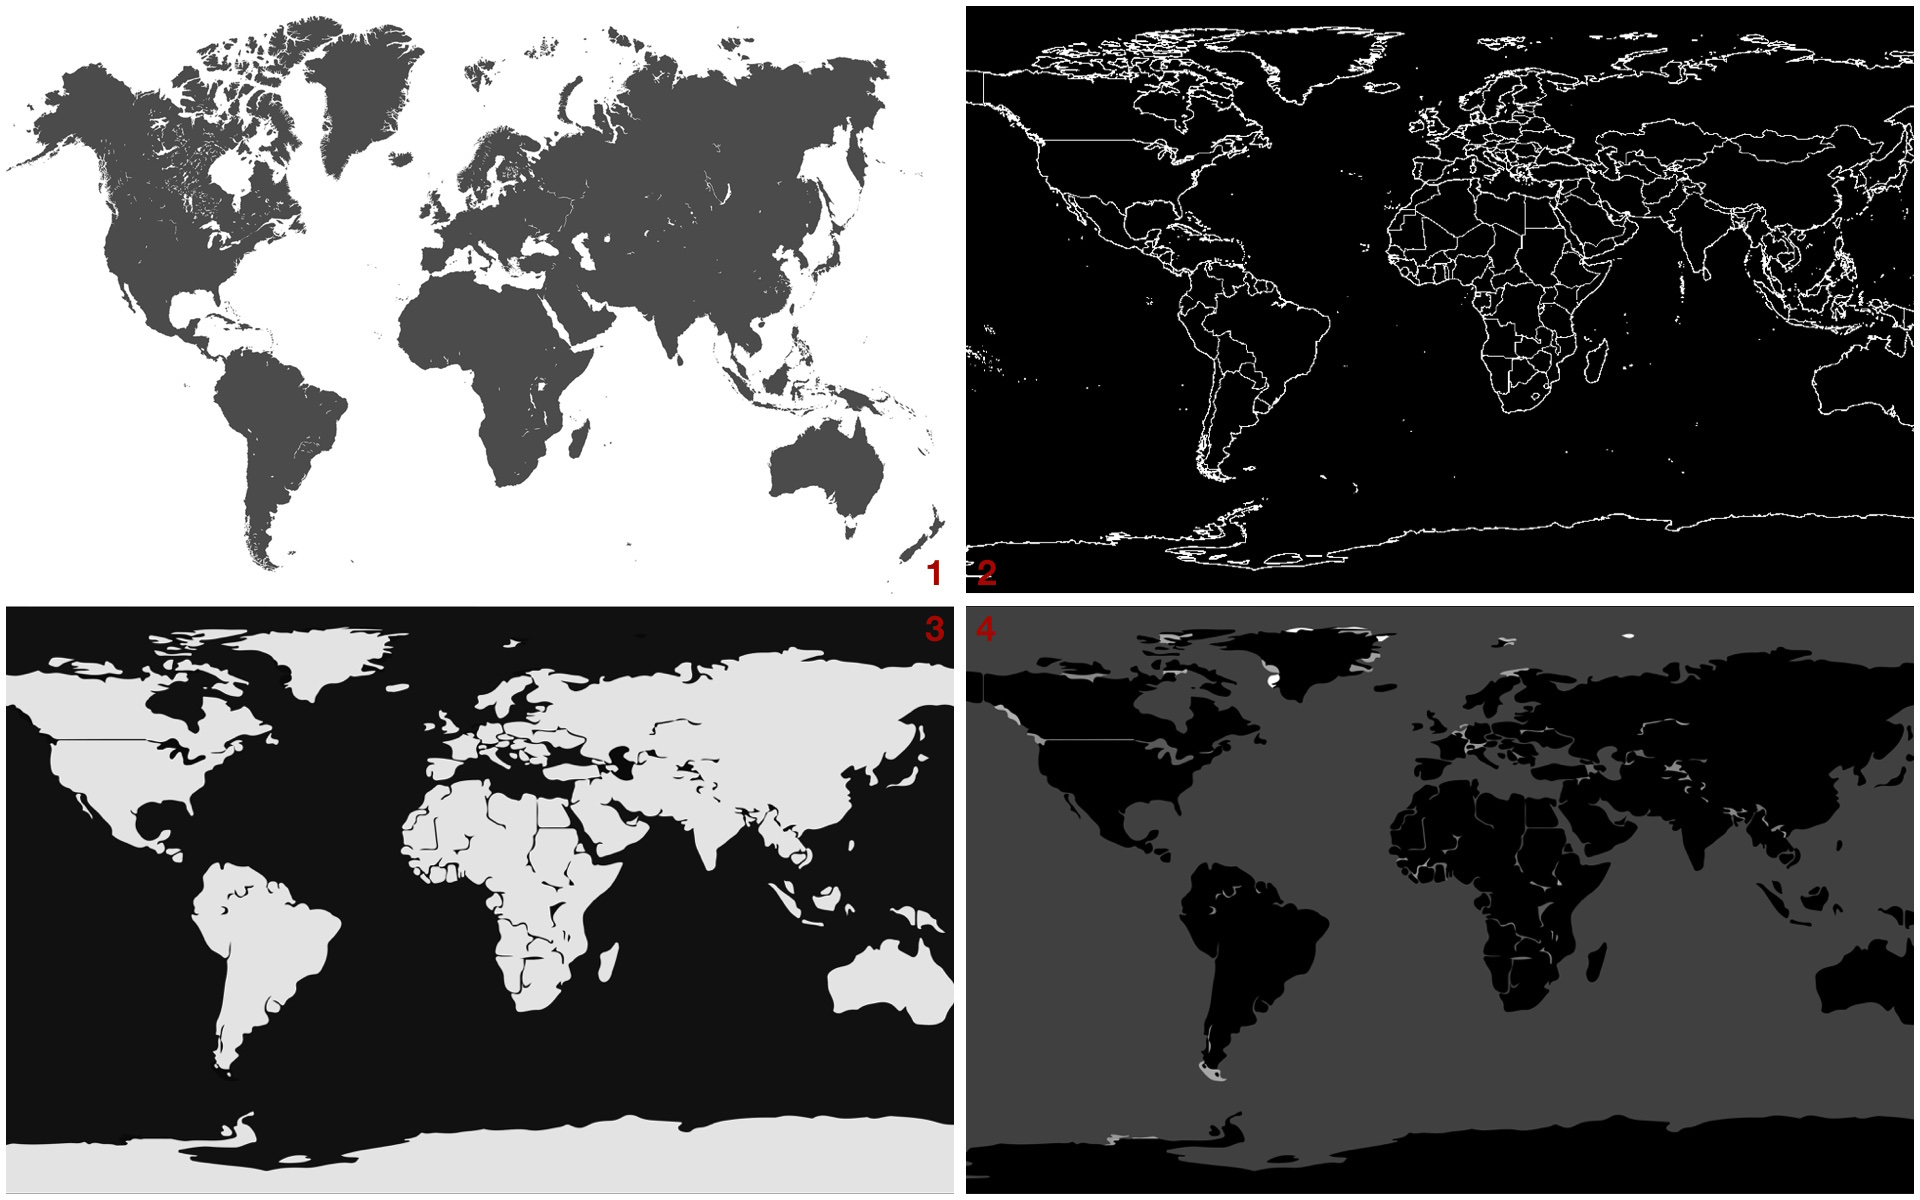
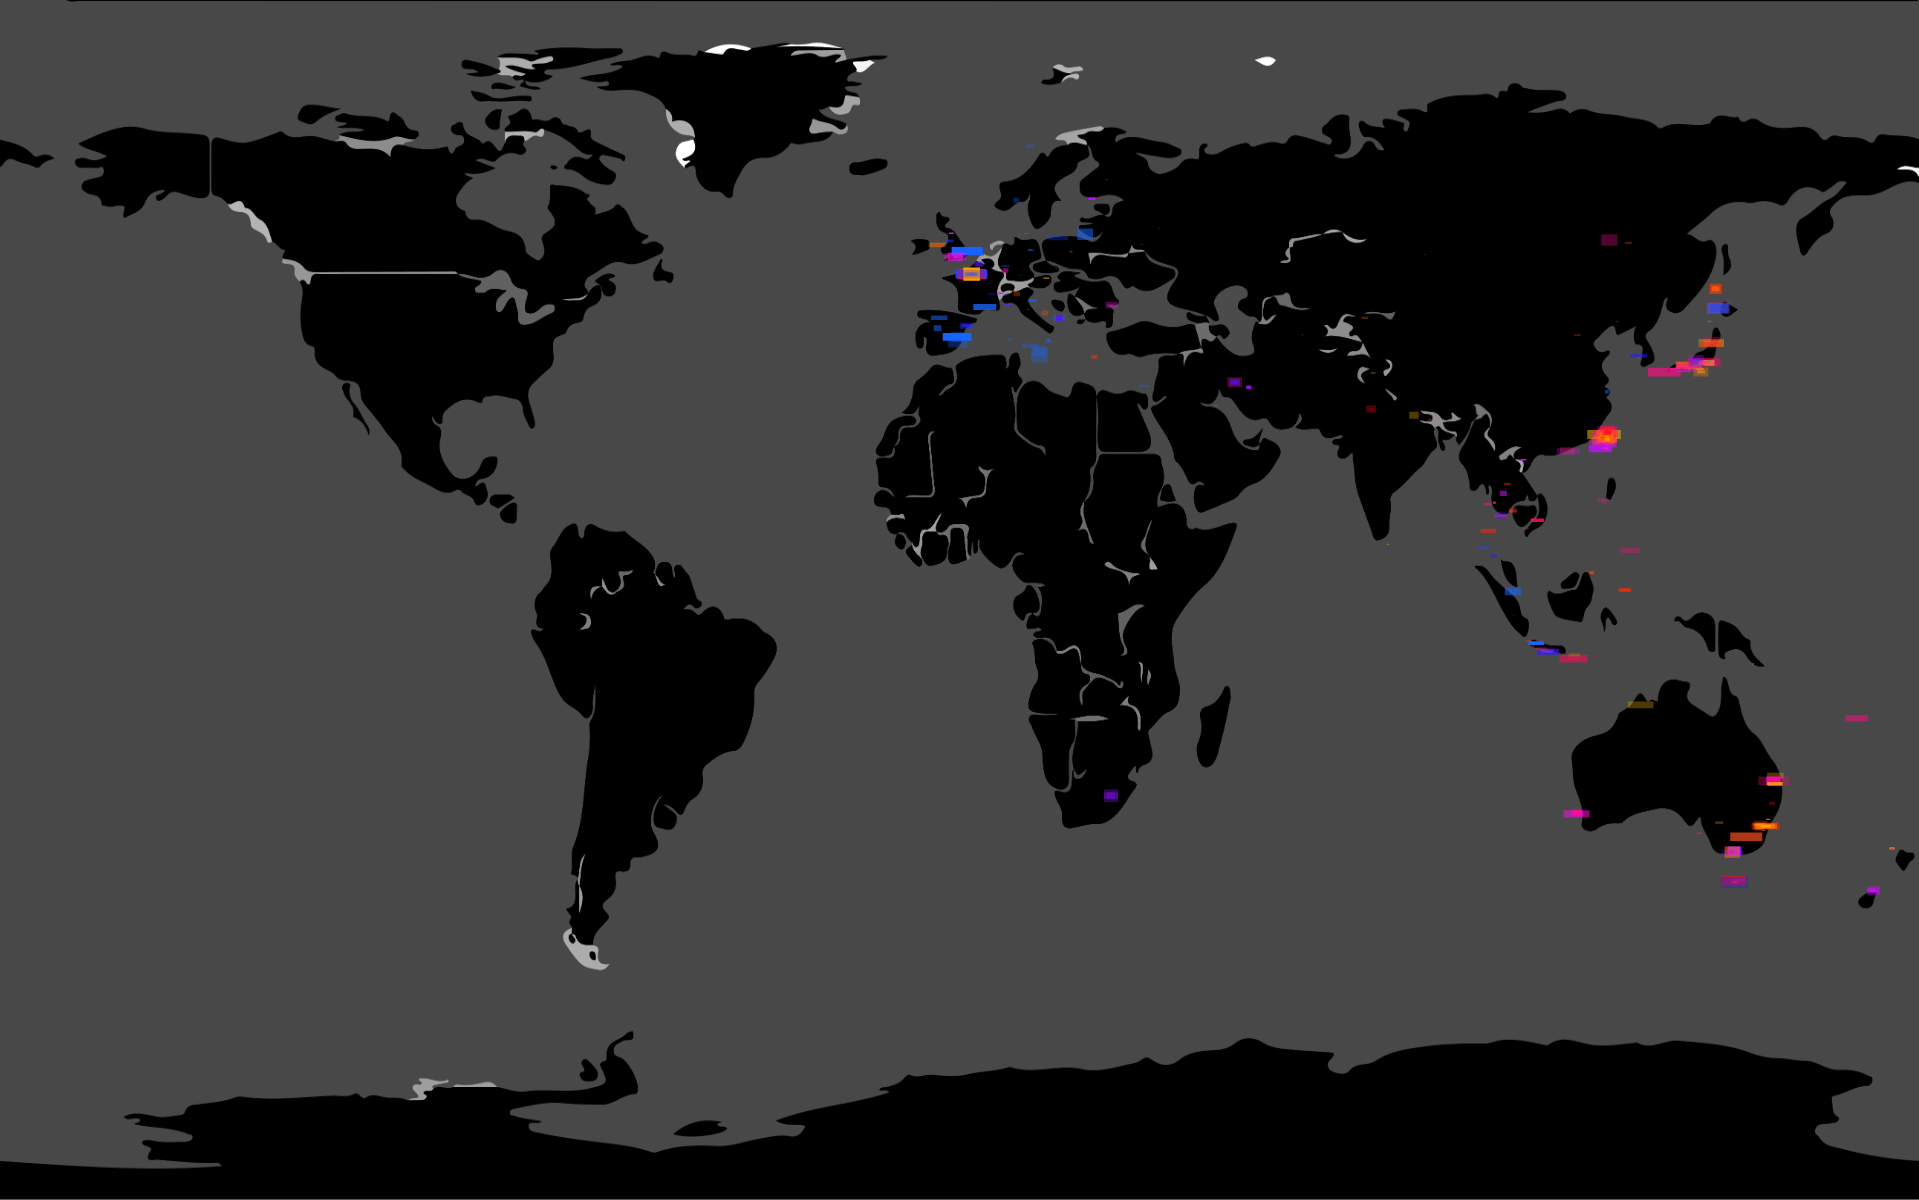
The choice of map background varies a lot as the work continues. Most maps, such as the first one, share a common cons: they are not linearly scaled, which makes inaccurate mapping from the longtitude and latitude to the position on the map. Moreover, the style of map evolves from the second map to fourth fourth, with the readability improving step by step, because dark background stands out the cells of images, and the boundry lines perform worser than solid area on indicating the countours of each contry.
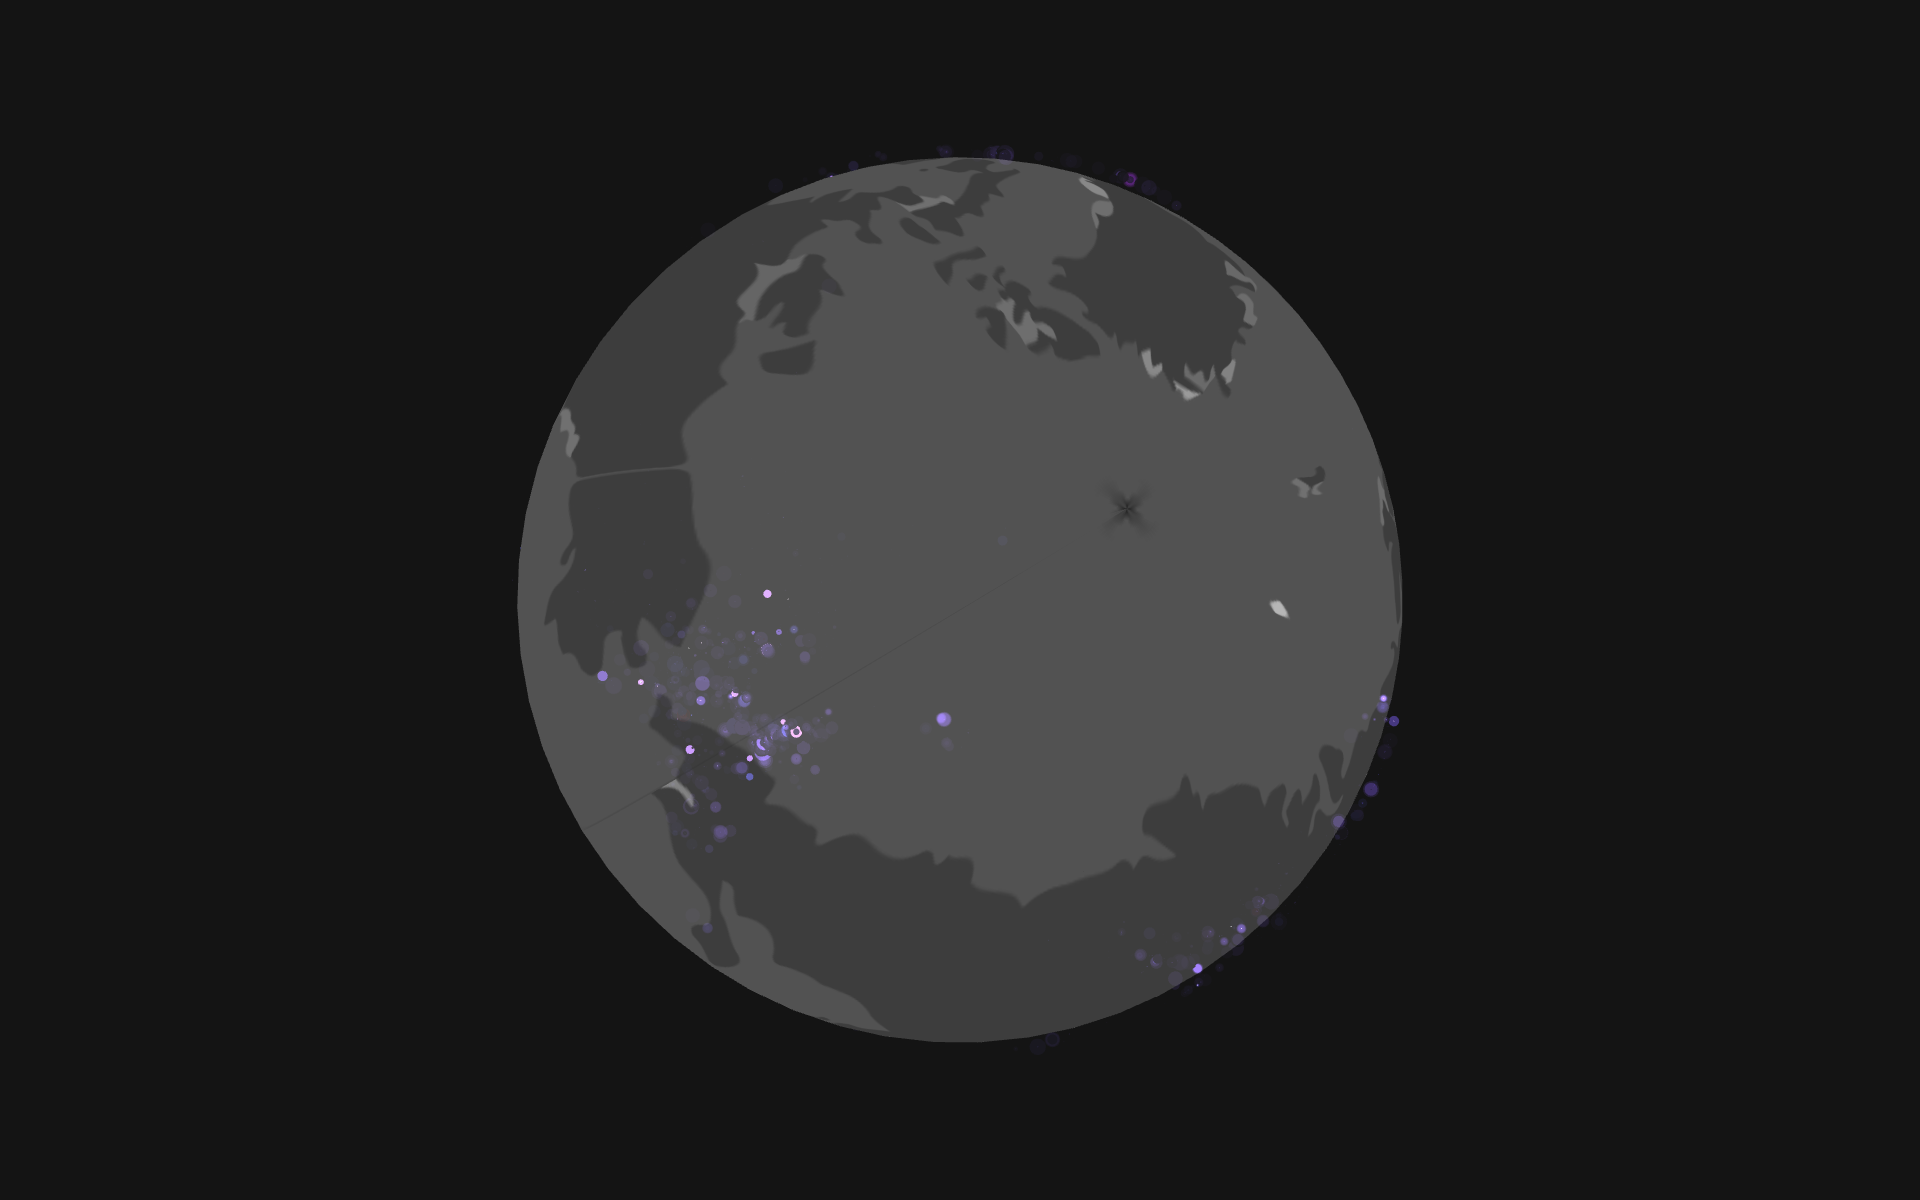
Also have made the 3d version attempt, which is less interactive and illustrative.
Add a time bar to indicate the time around the world. Blue means night time and yellow mean day time. The two vertical lines indicate the sunrise and sunset, and move as program runs.
Illustration Video
Exposure&Light from Weihao on Vimeo.
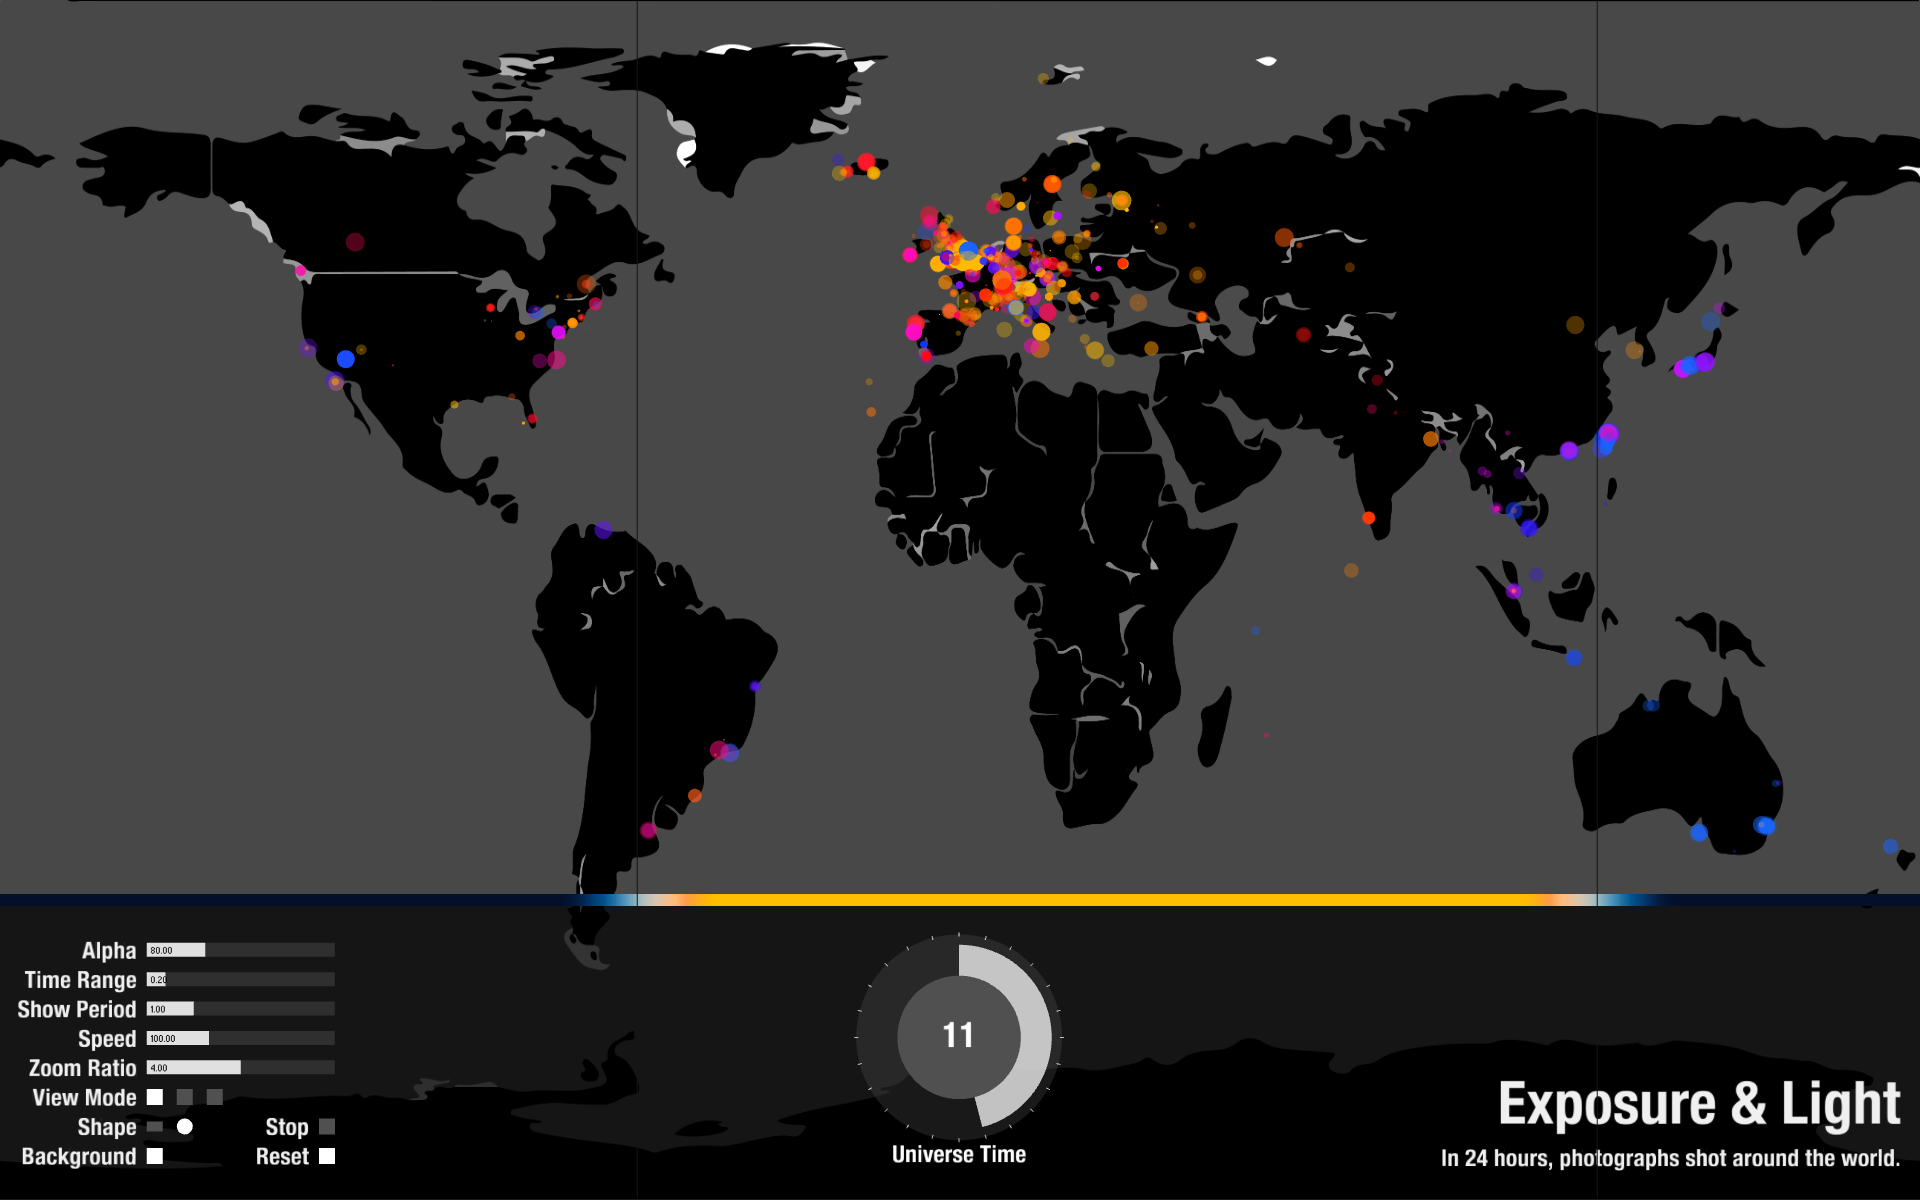
The overview of result.
The shpae of each cell can be alerted to ellipse.
Size of cell is adjustable.
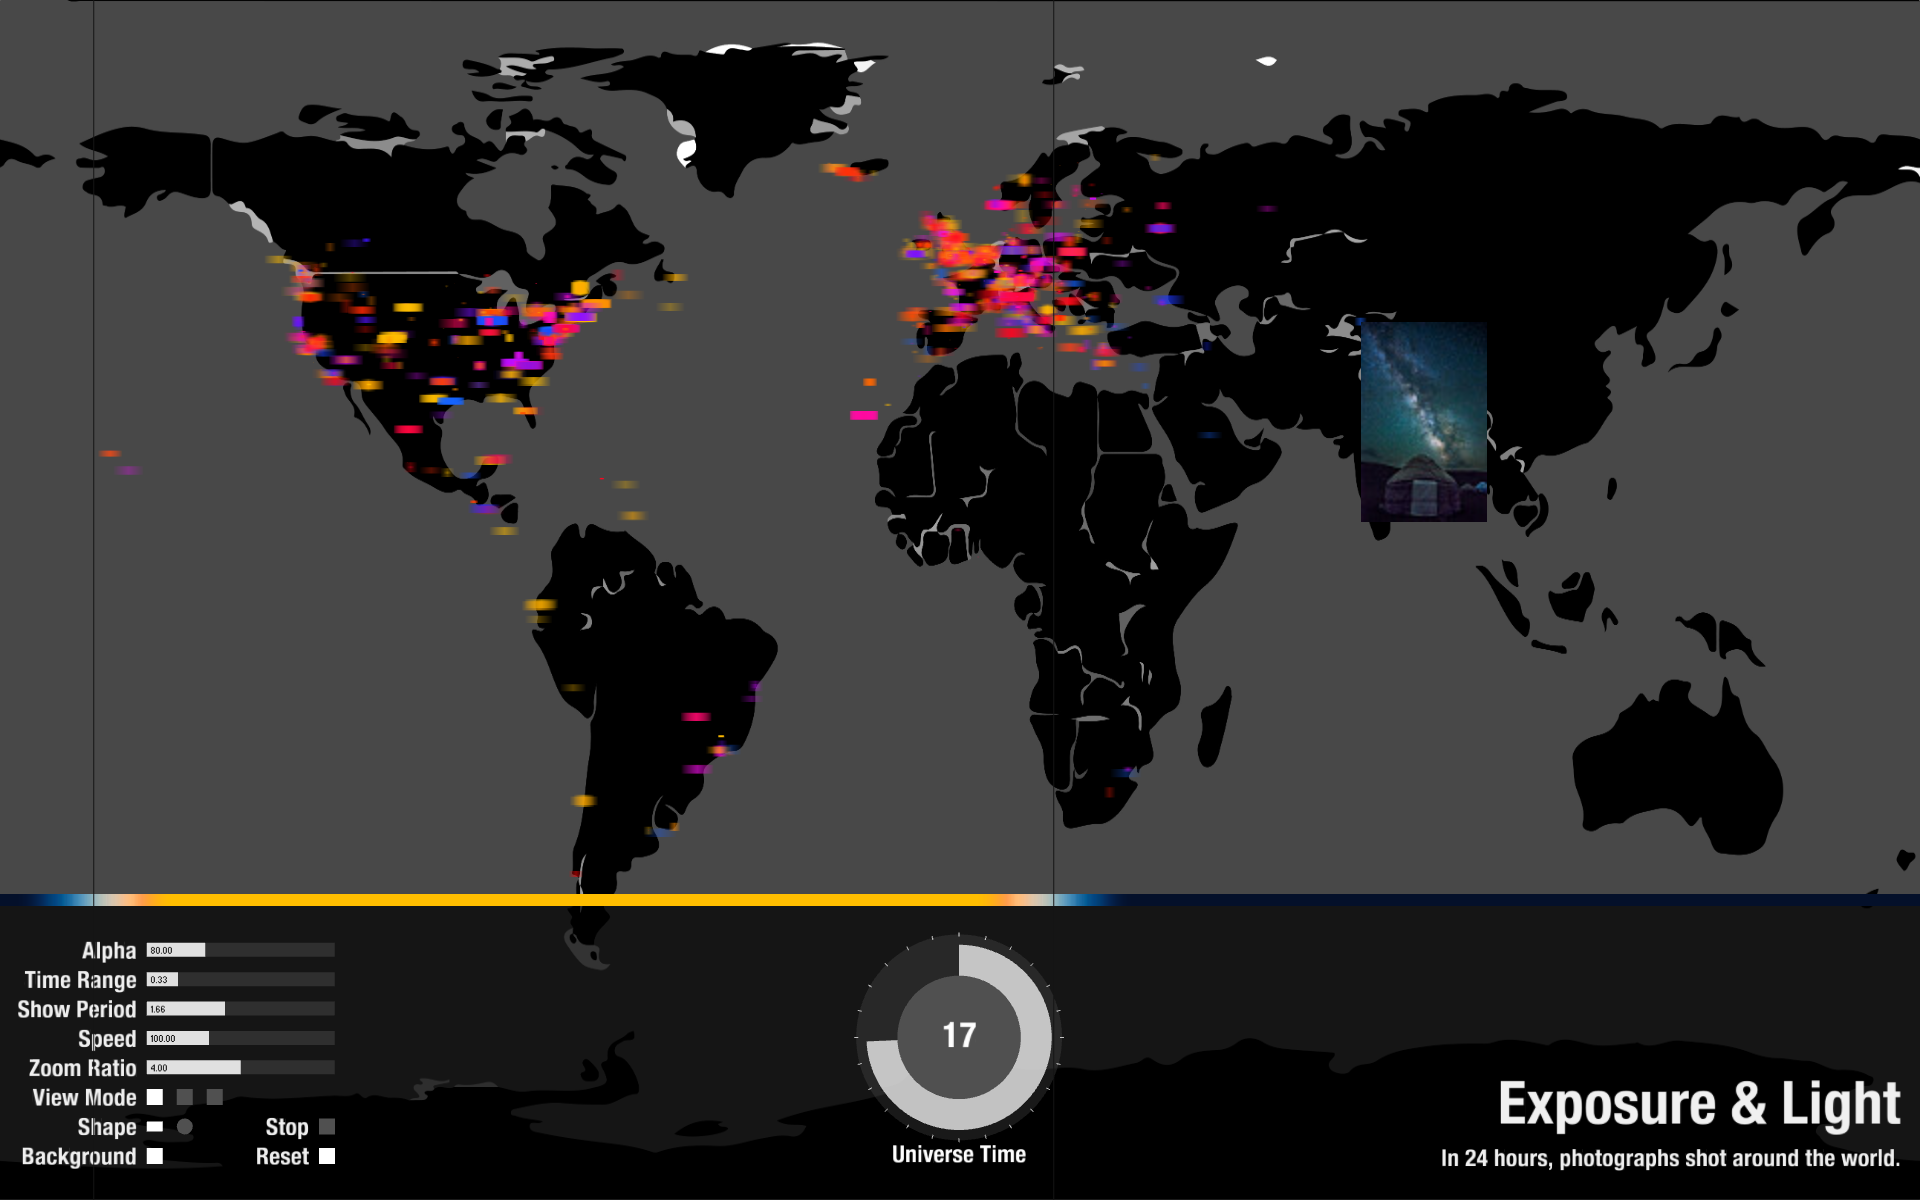
Point at each cell can load the actual image to show.

Color can be changed to map the color representing the time in a day.
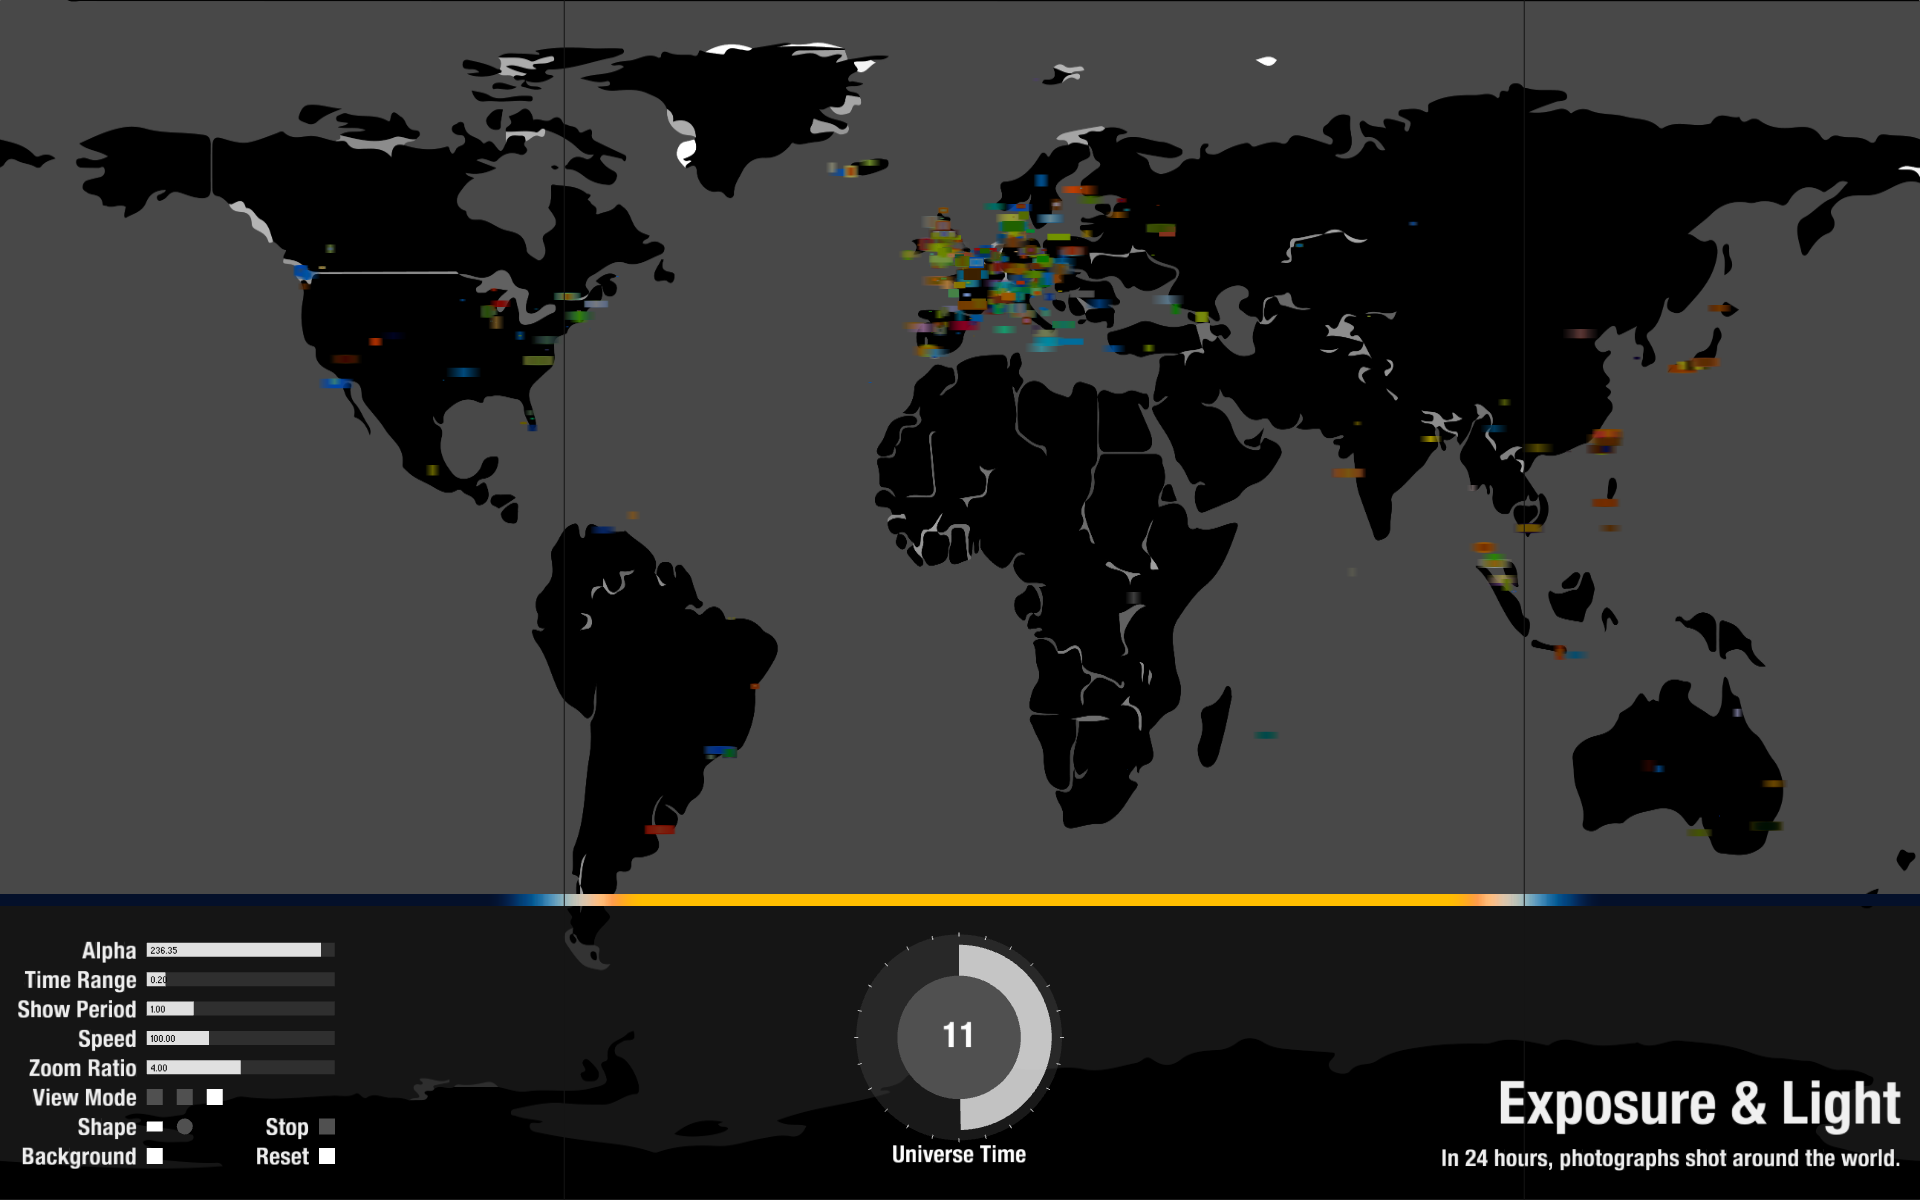
Color can be the actual average color of the original image.
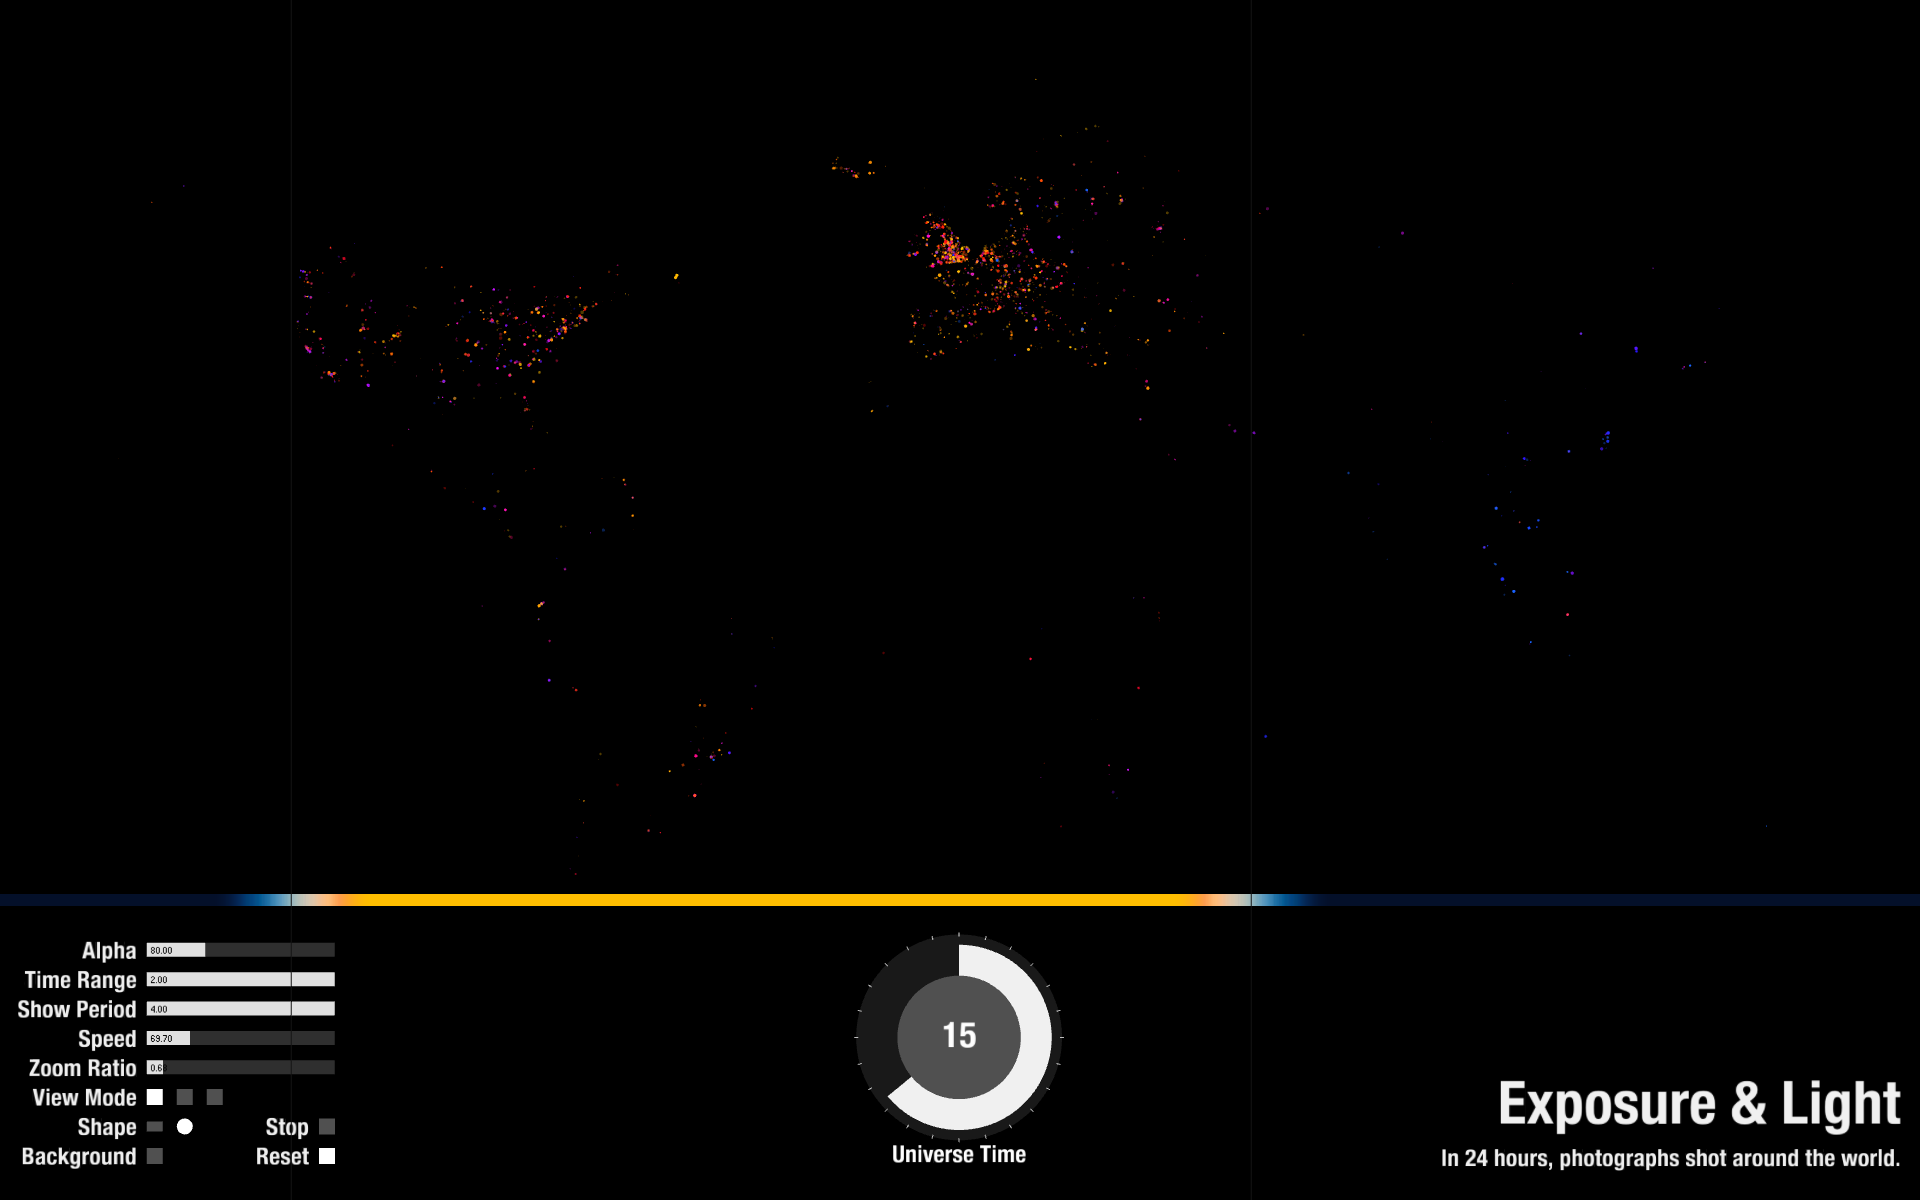
Some intersting perspective with background off.
Some intersting perspective with background off.
Source Code + Data(Full version)
Source Code + Data(Simplified version without function of checking out the actual thumnails.)