Within the Ecology, Evolution, and Marine Biology department at UC Santa Barbara, Douglas McCauley’s lab researches wildebeest in the Serengeti. At a most basic level, they investigate the nature of the aggregate movement of the herd and try to understand where the wildebeest go and how much variation there is in their choice of route from year to year.
To do so, they have fixed GPS-equipped collars on a number of the wildebeest in the wild and get a fix on their location twice a day. This collection of GPS began in 2013 and is ongoing.
The goal of this data visualization is two-fold:
1. Provide an interactive, flexible method for viewing the path of the wildebeest
2. Highlight the intricate formal quality of the various geometries formed by the large-scale movement of the wildebeest
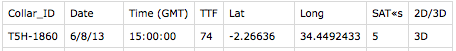
The GPS data set is comprised of the following information:
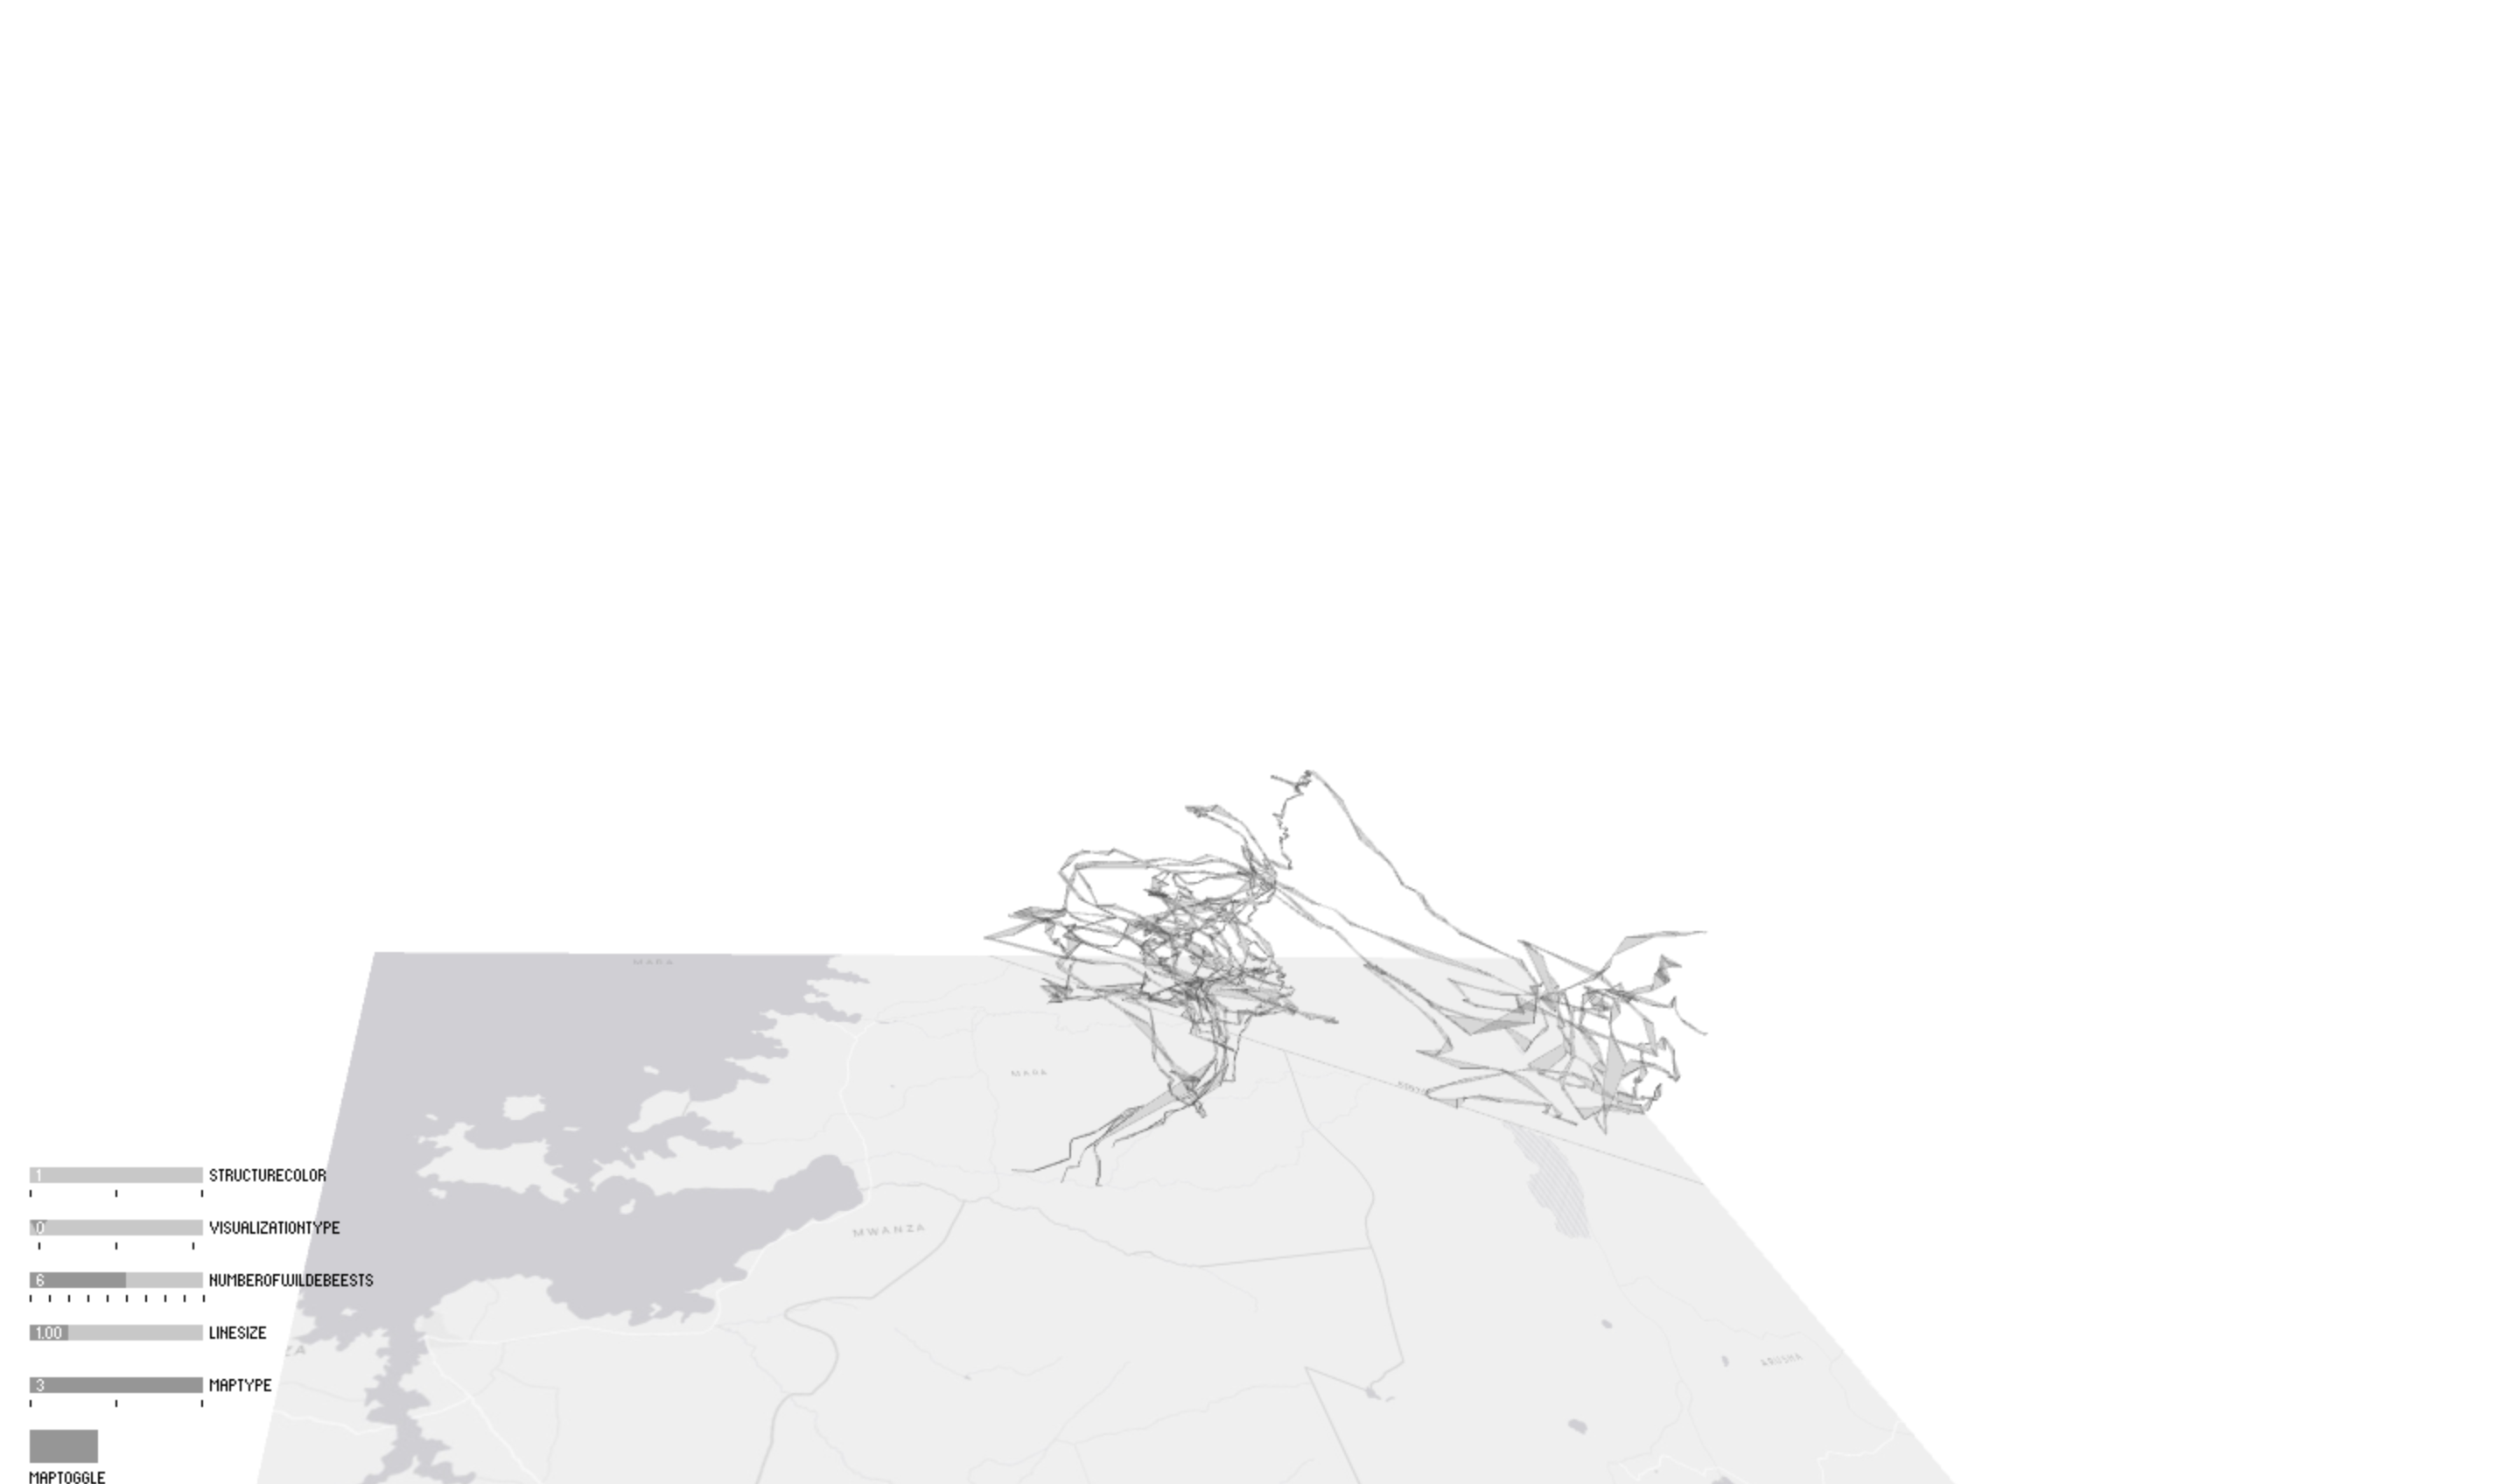
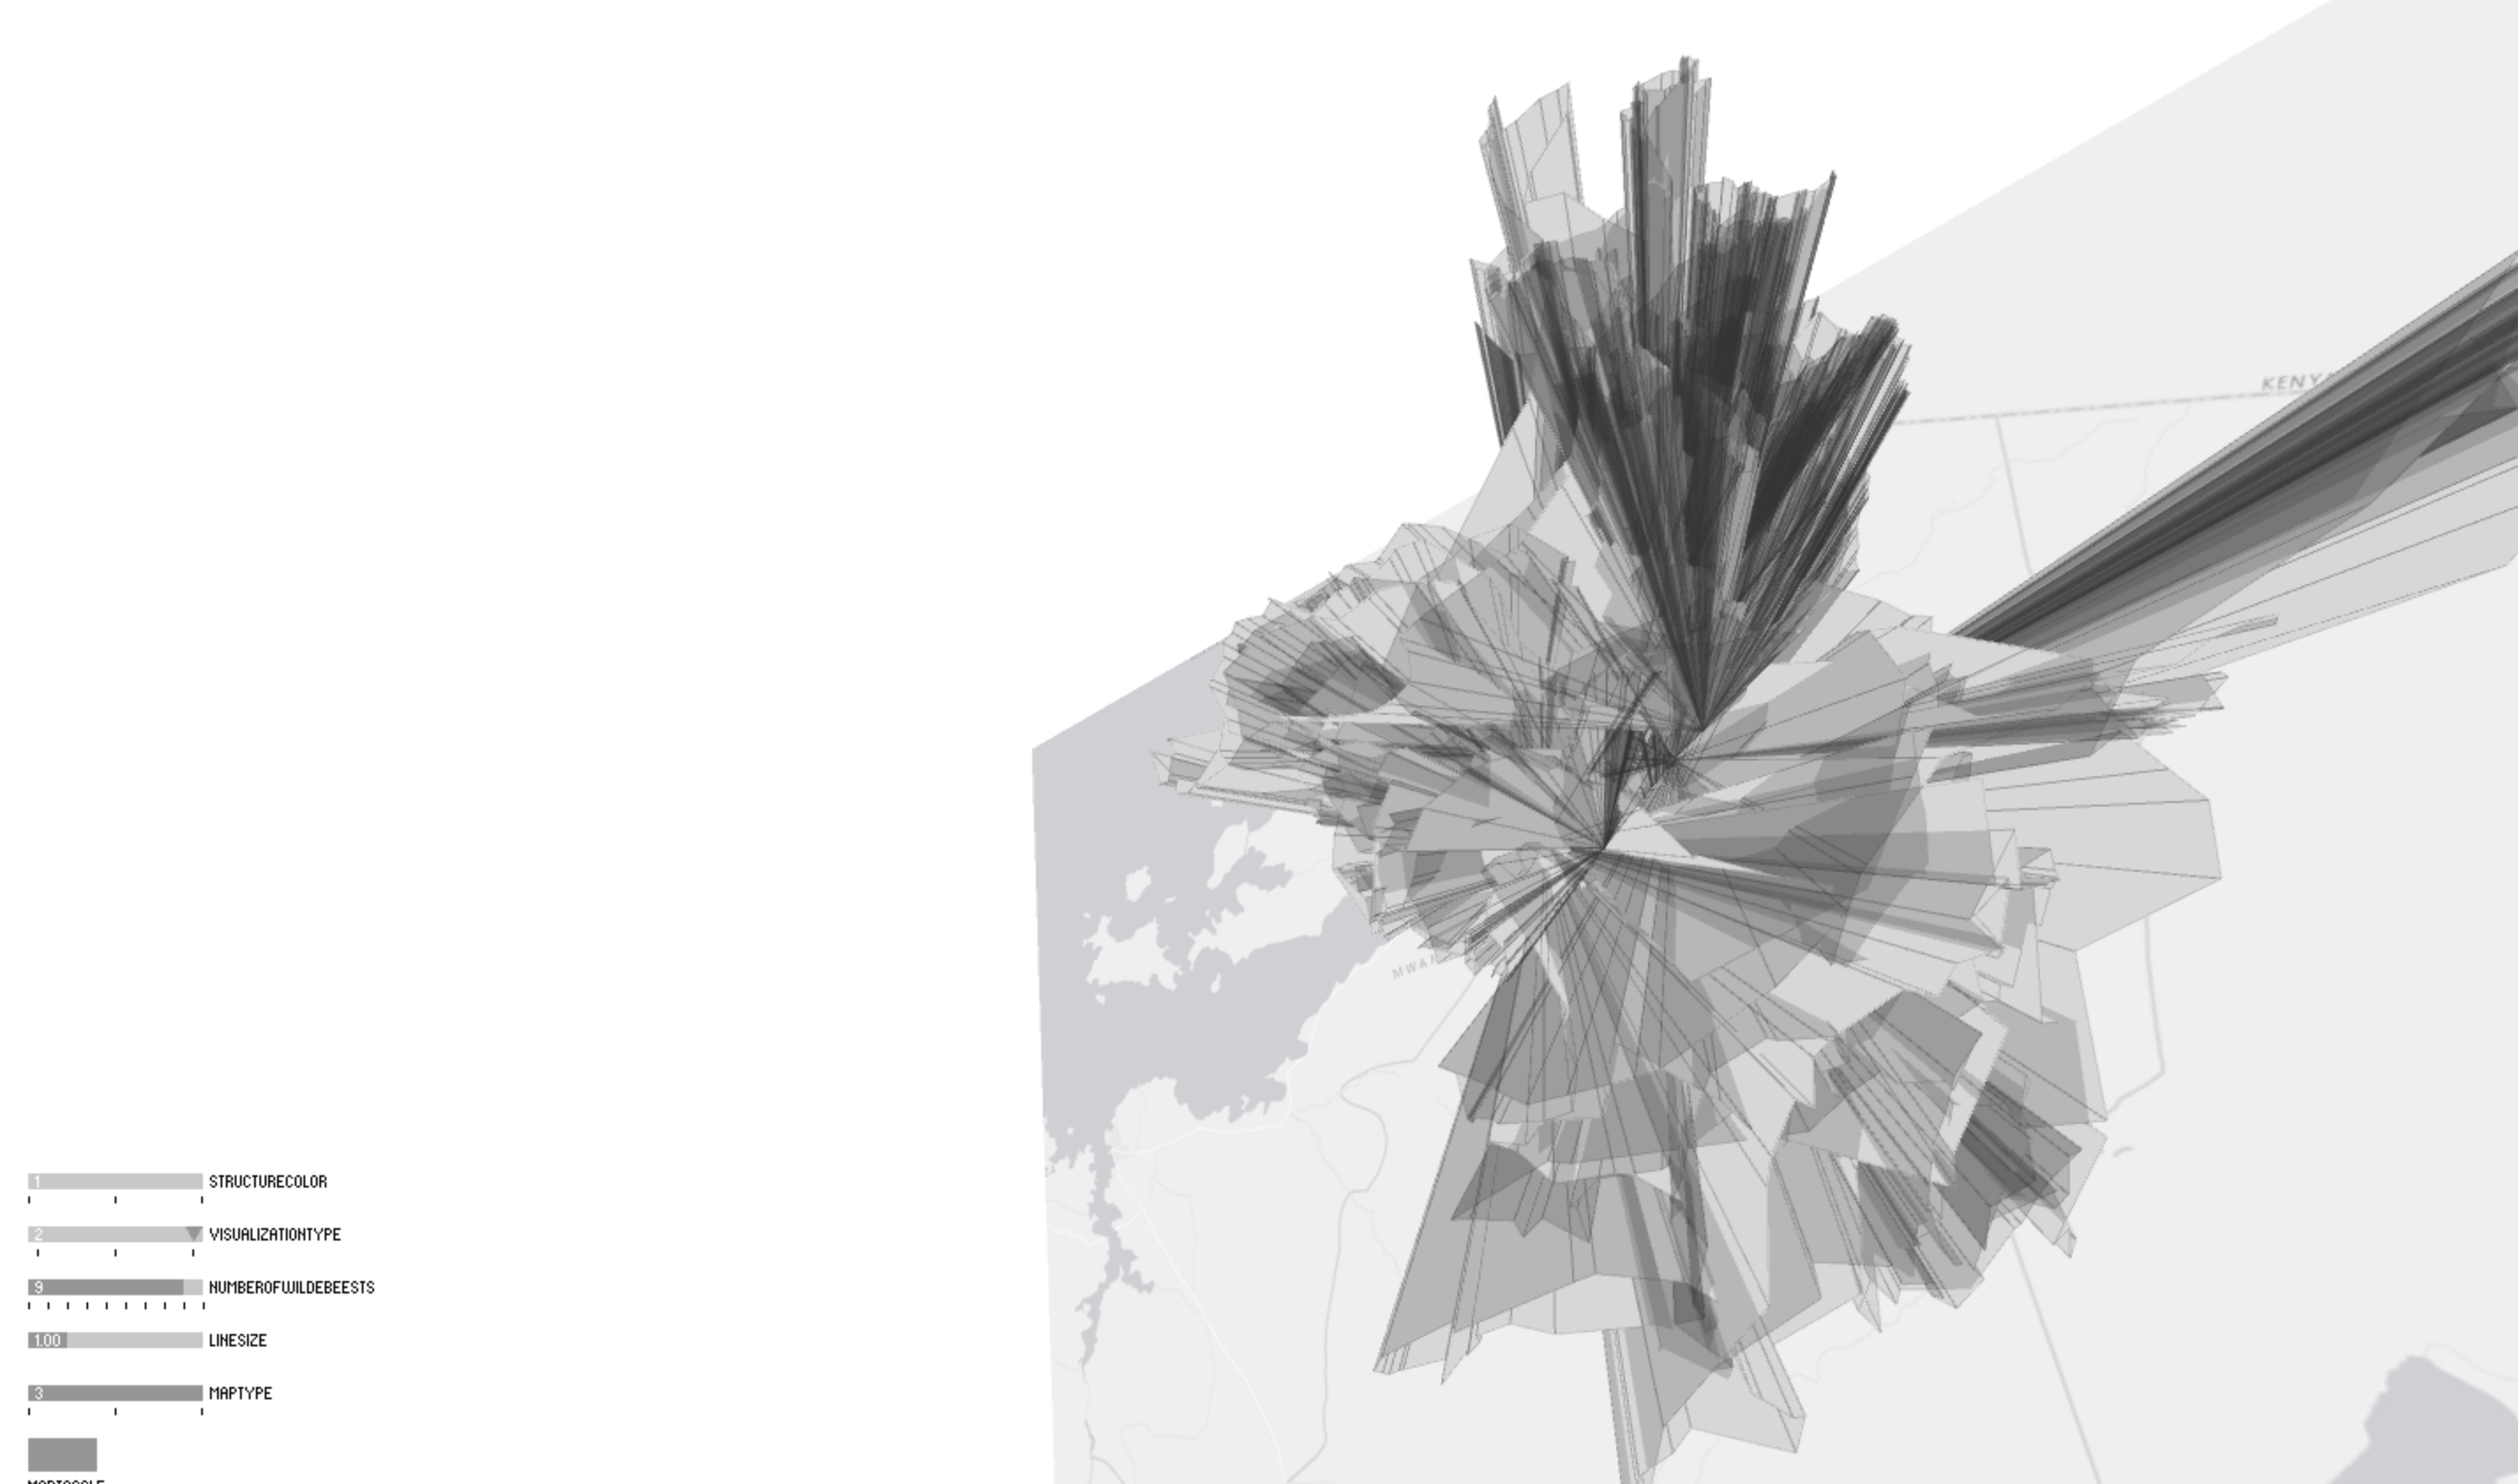
Next, the 3rd Dimension was implemented to show the passage of time. The GPS fix of a wildebeest occurs twice each day. As time moves forward from the initial GPS position in 2013, the GPS locations are plotted moving further away from the base of the map.
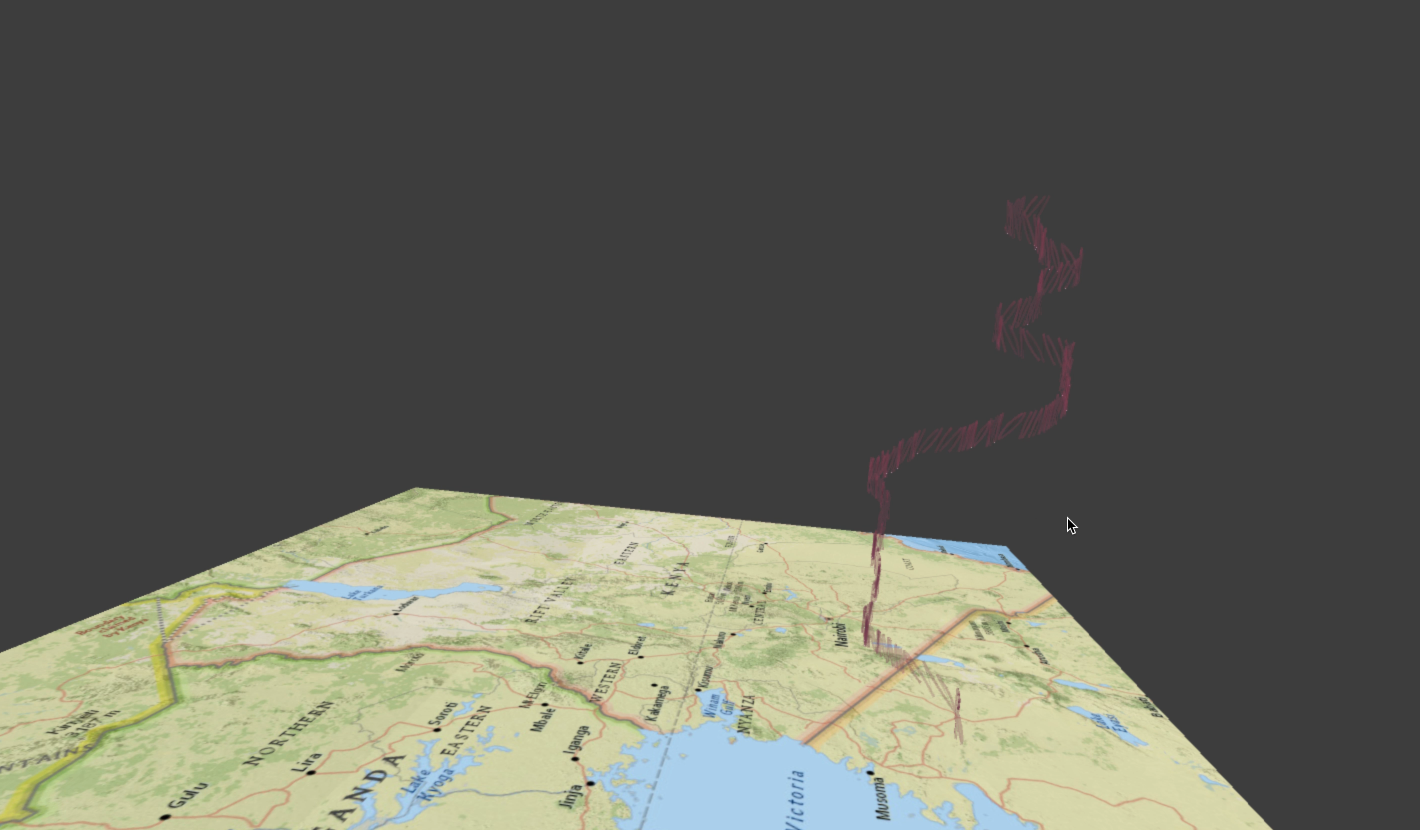
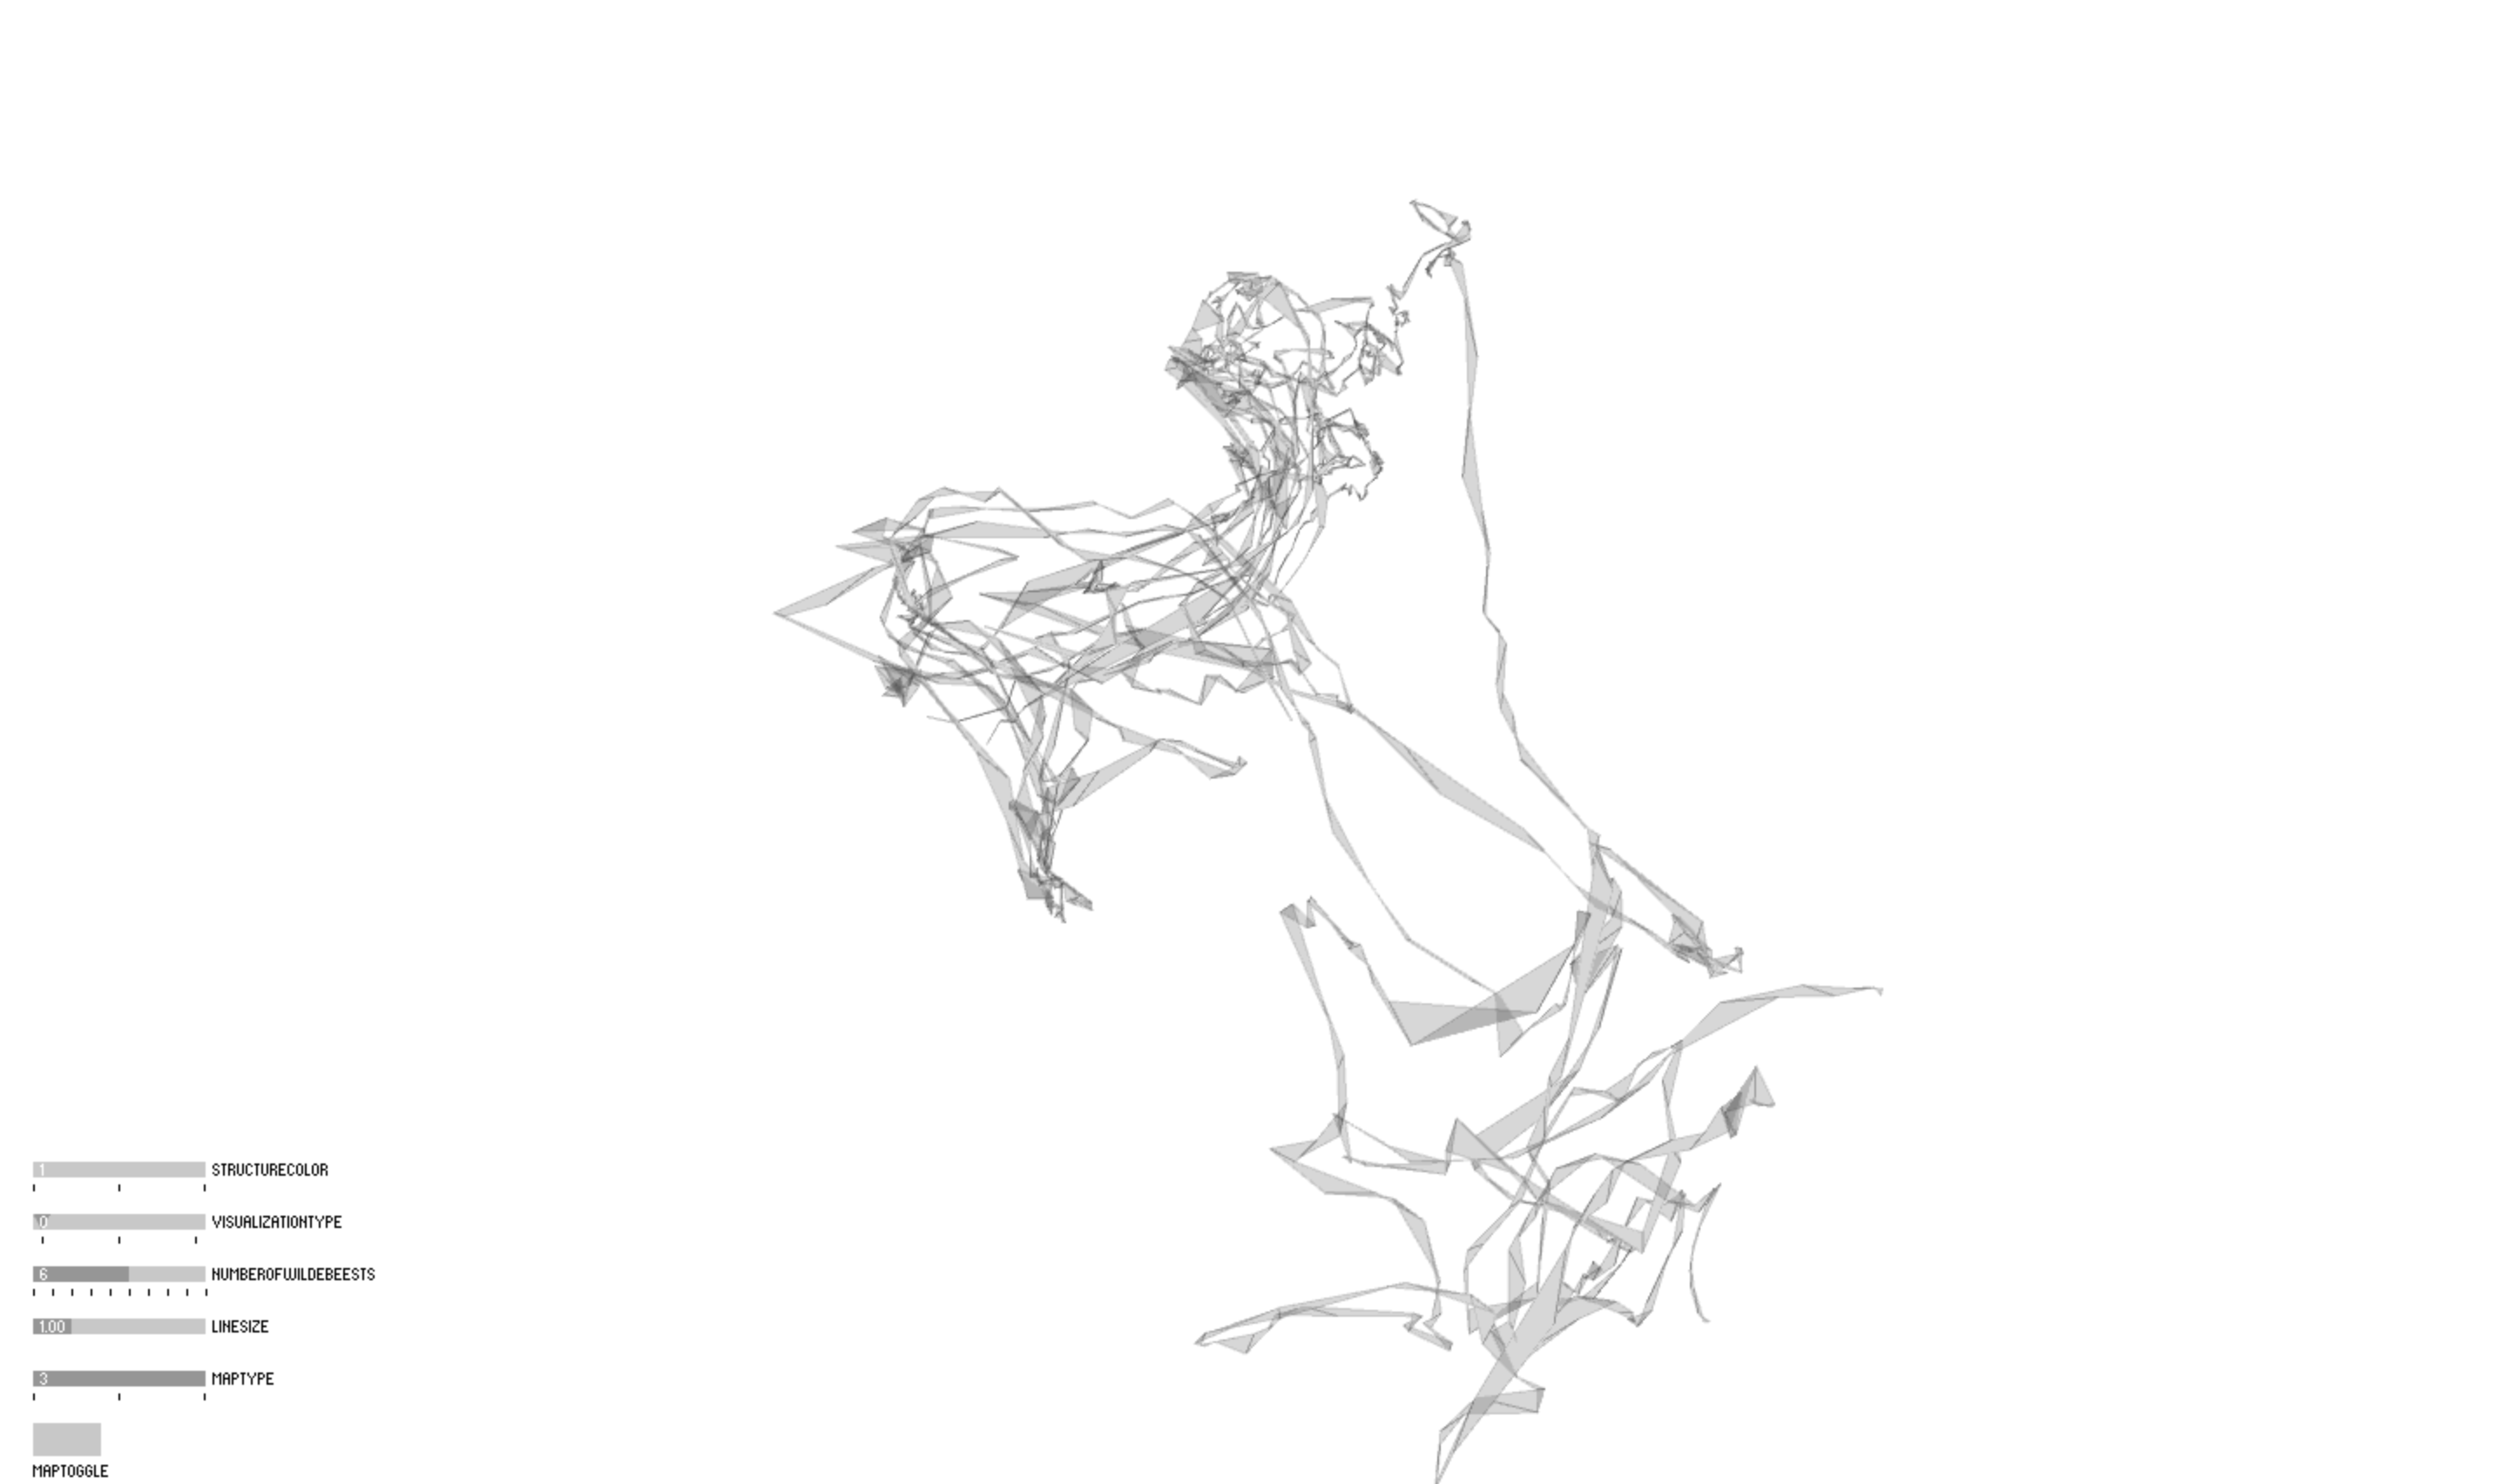
The final visualization creates an opportunity for the user to explore the mapped GPS data in a number of ways.
Geometry Types:
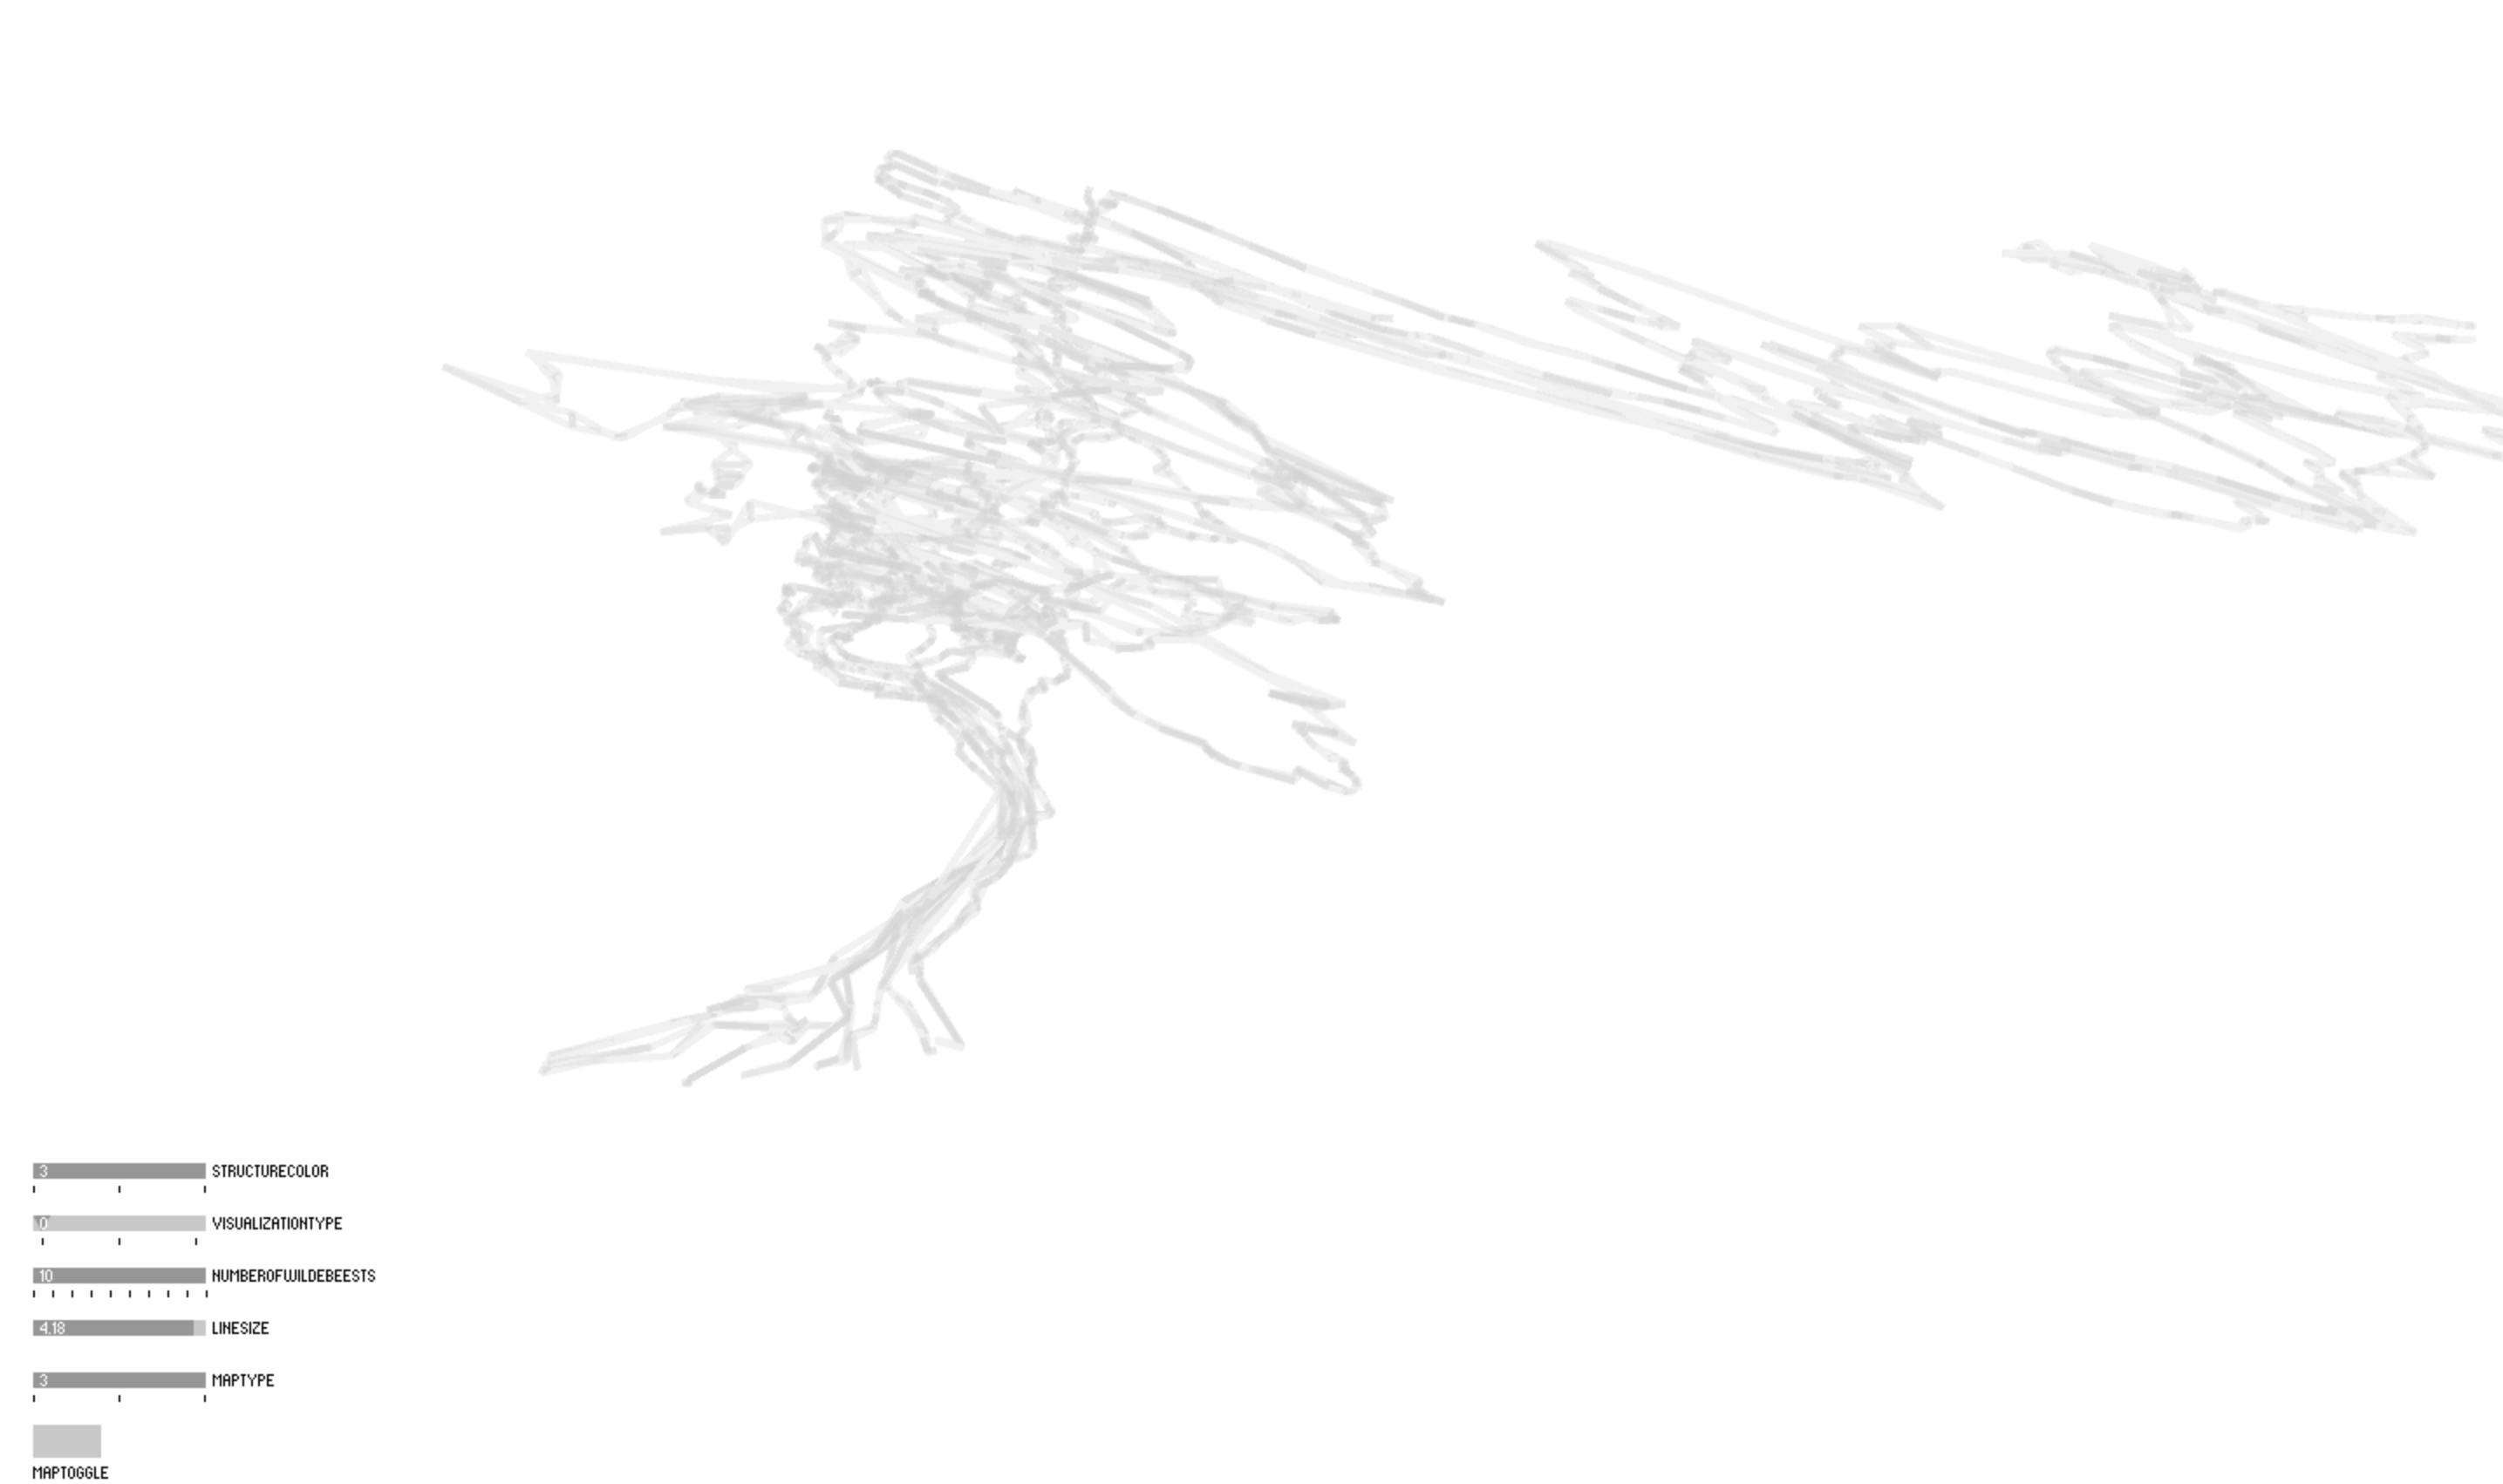
1. Traced lines - this mode allows the most direct representation of the GPS data in the 3D space.
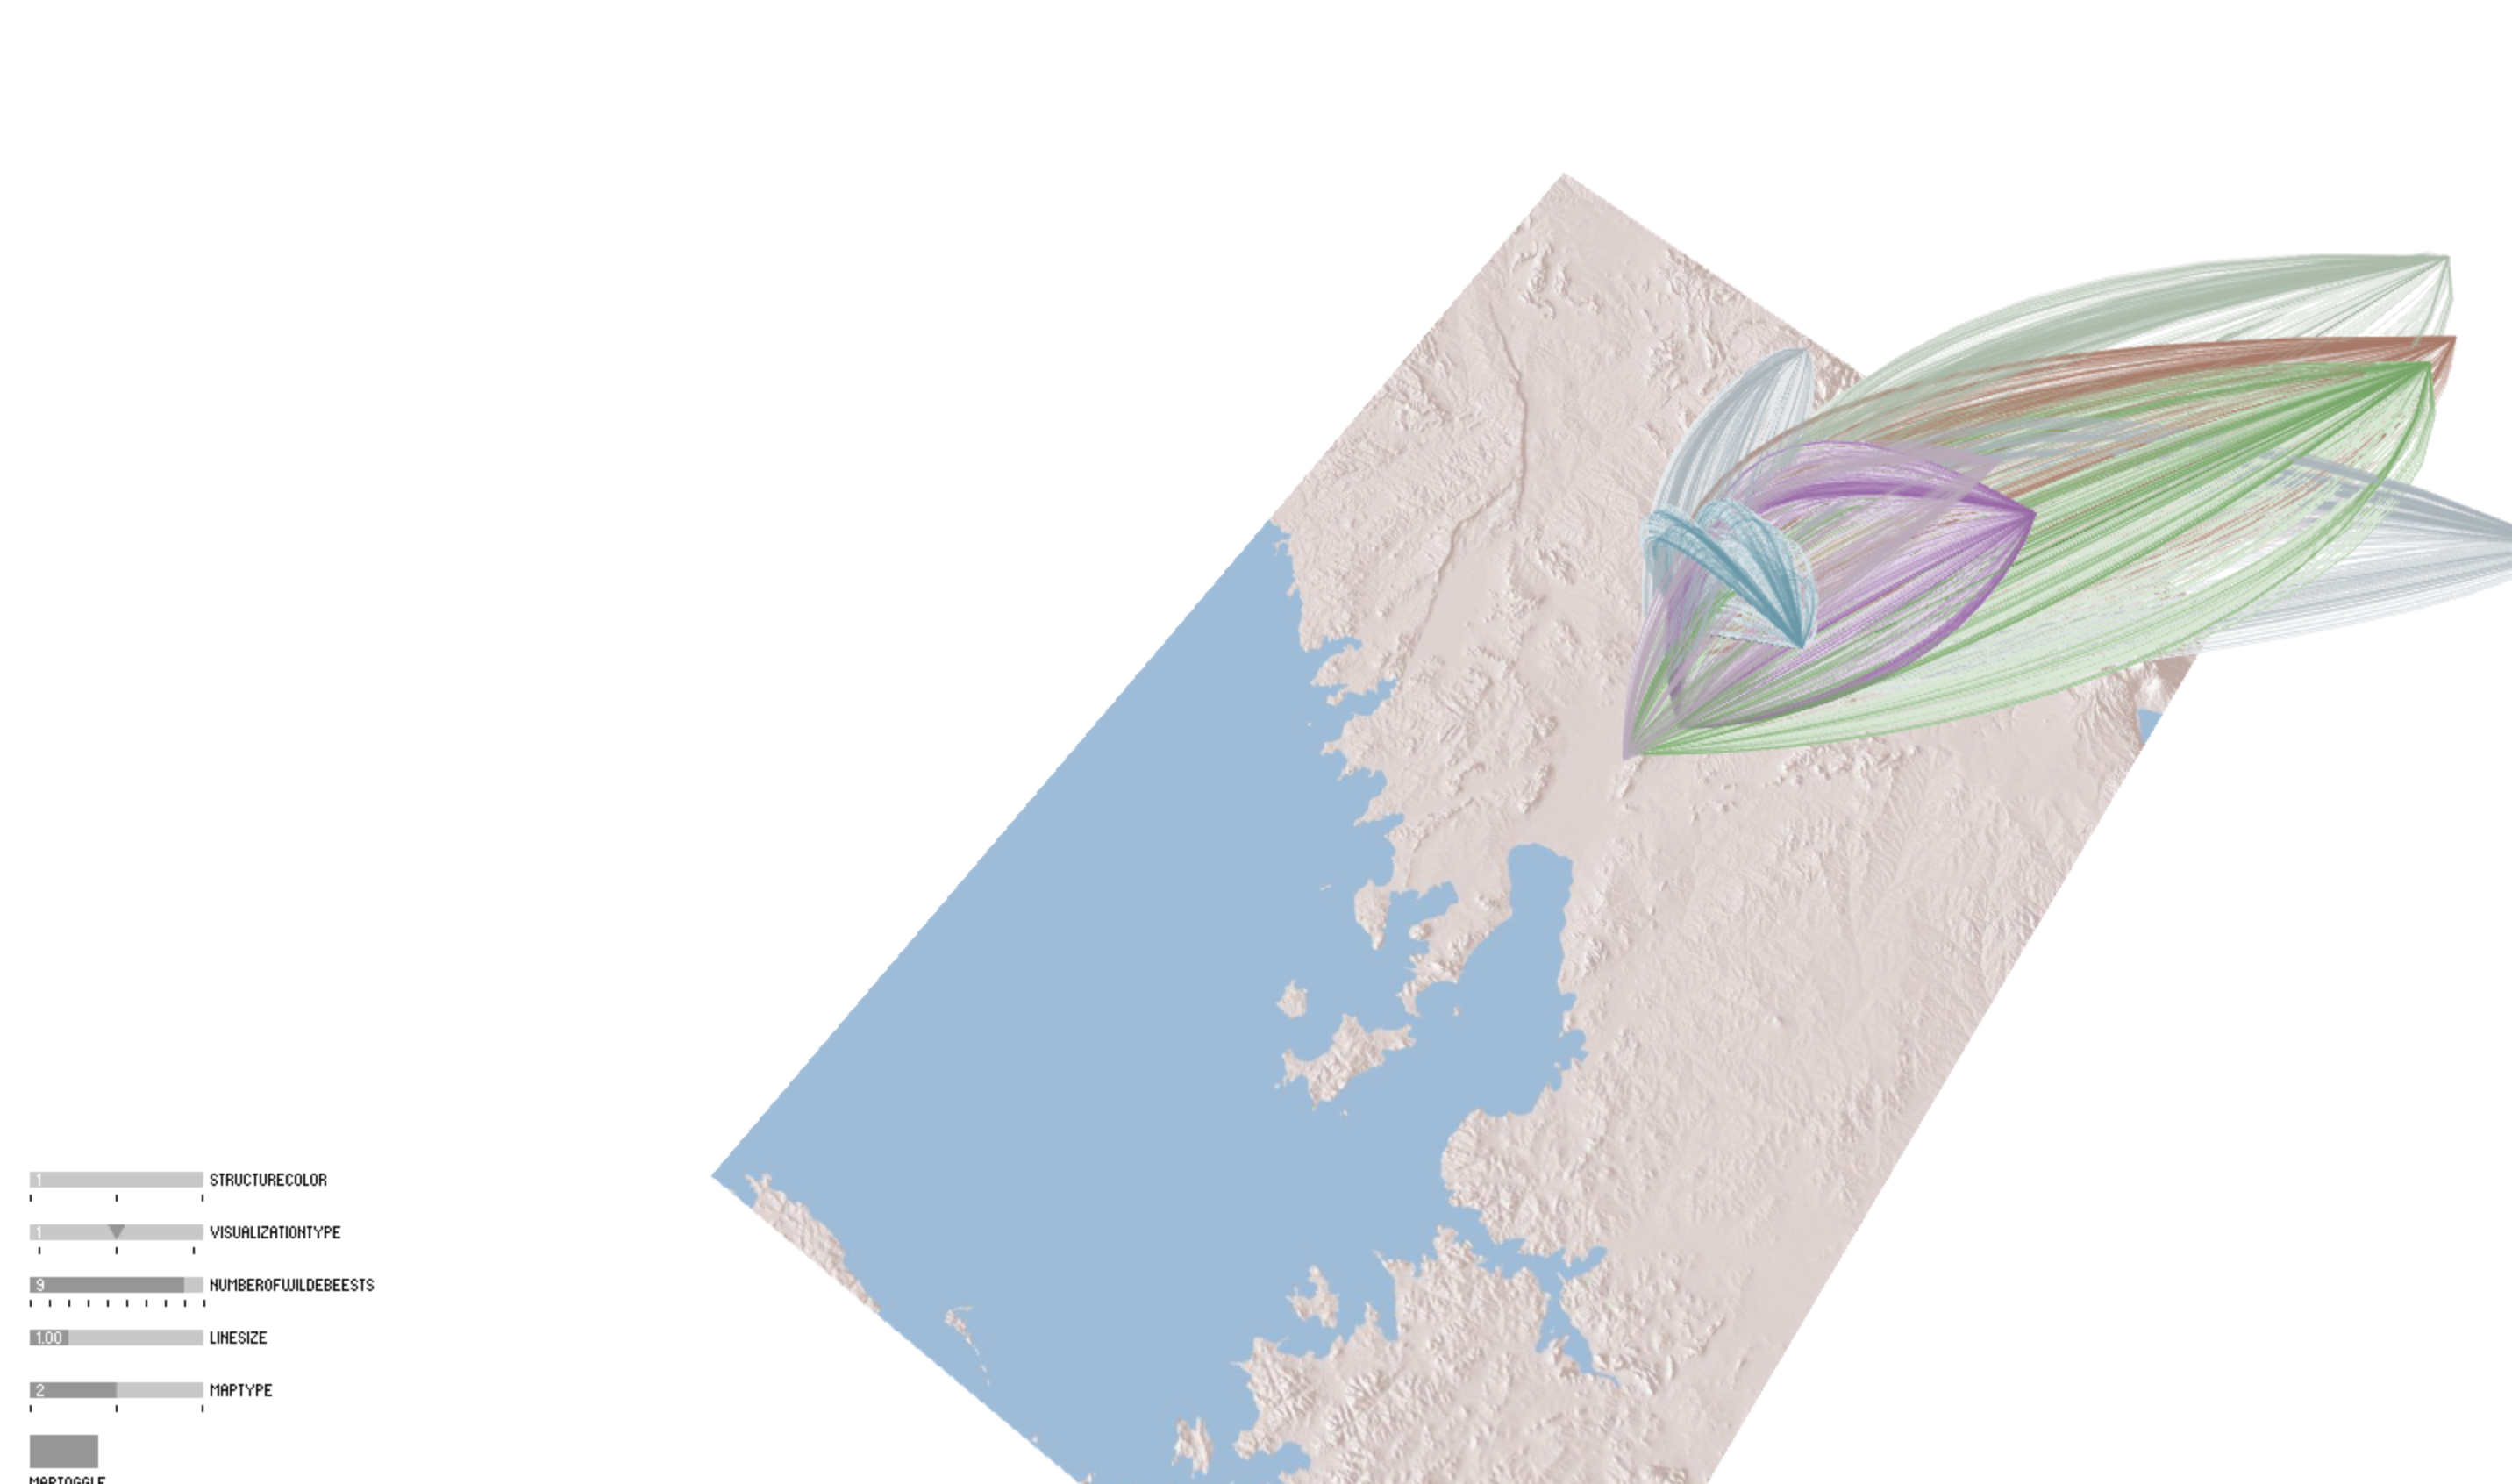
2. Area Pods - for each GPS location, a line is drawn from the initial GPS location, through the current GPS location and finally to the last GPS location in the data set. This allows the user to see the general area covered by each wildebeest.
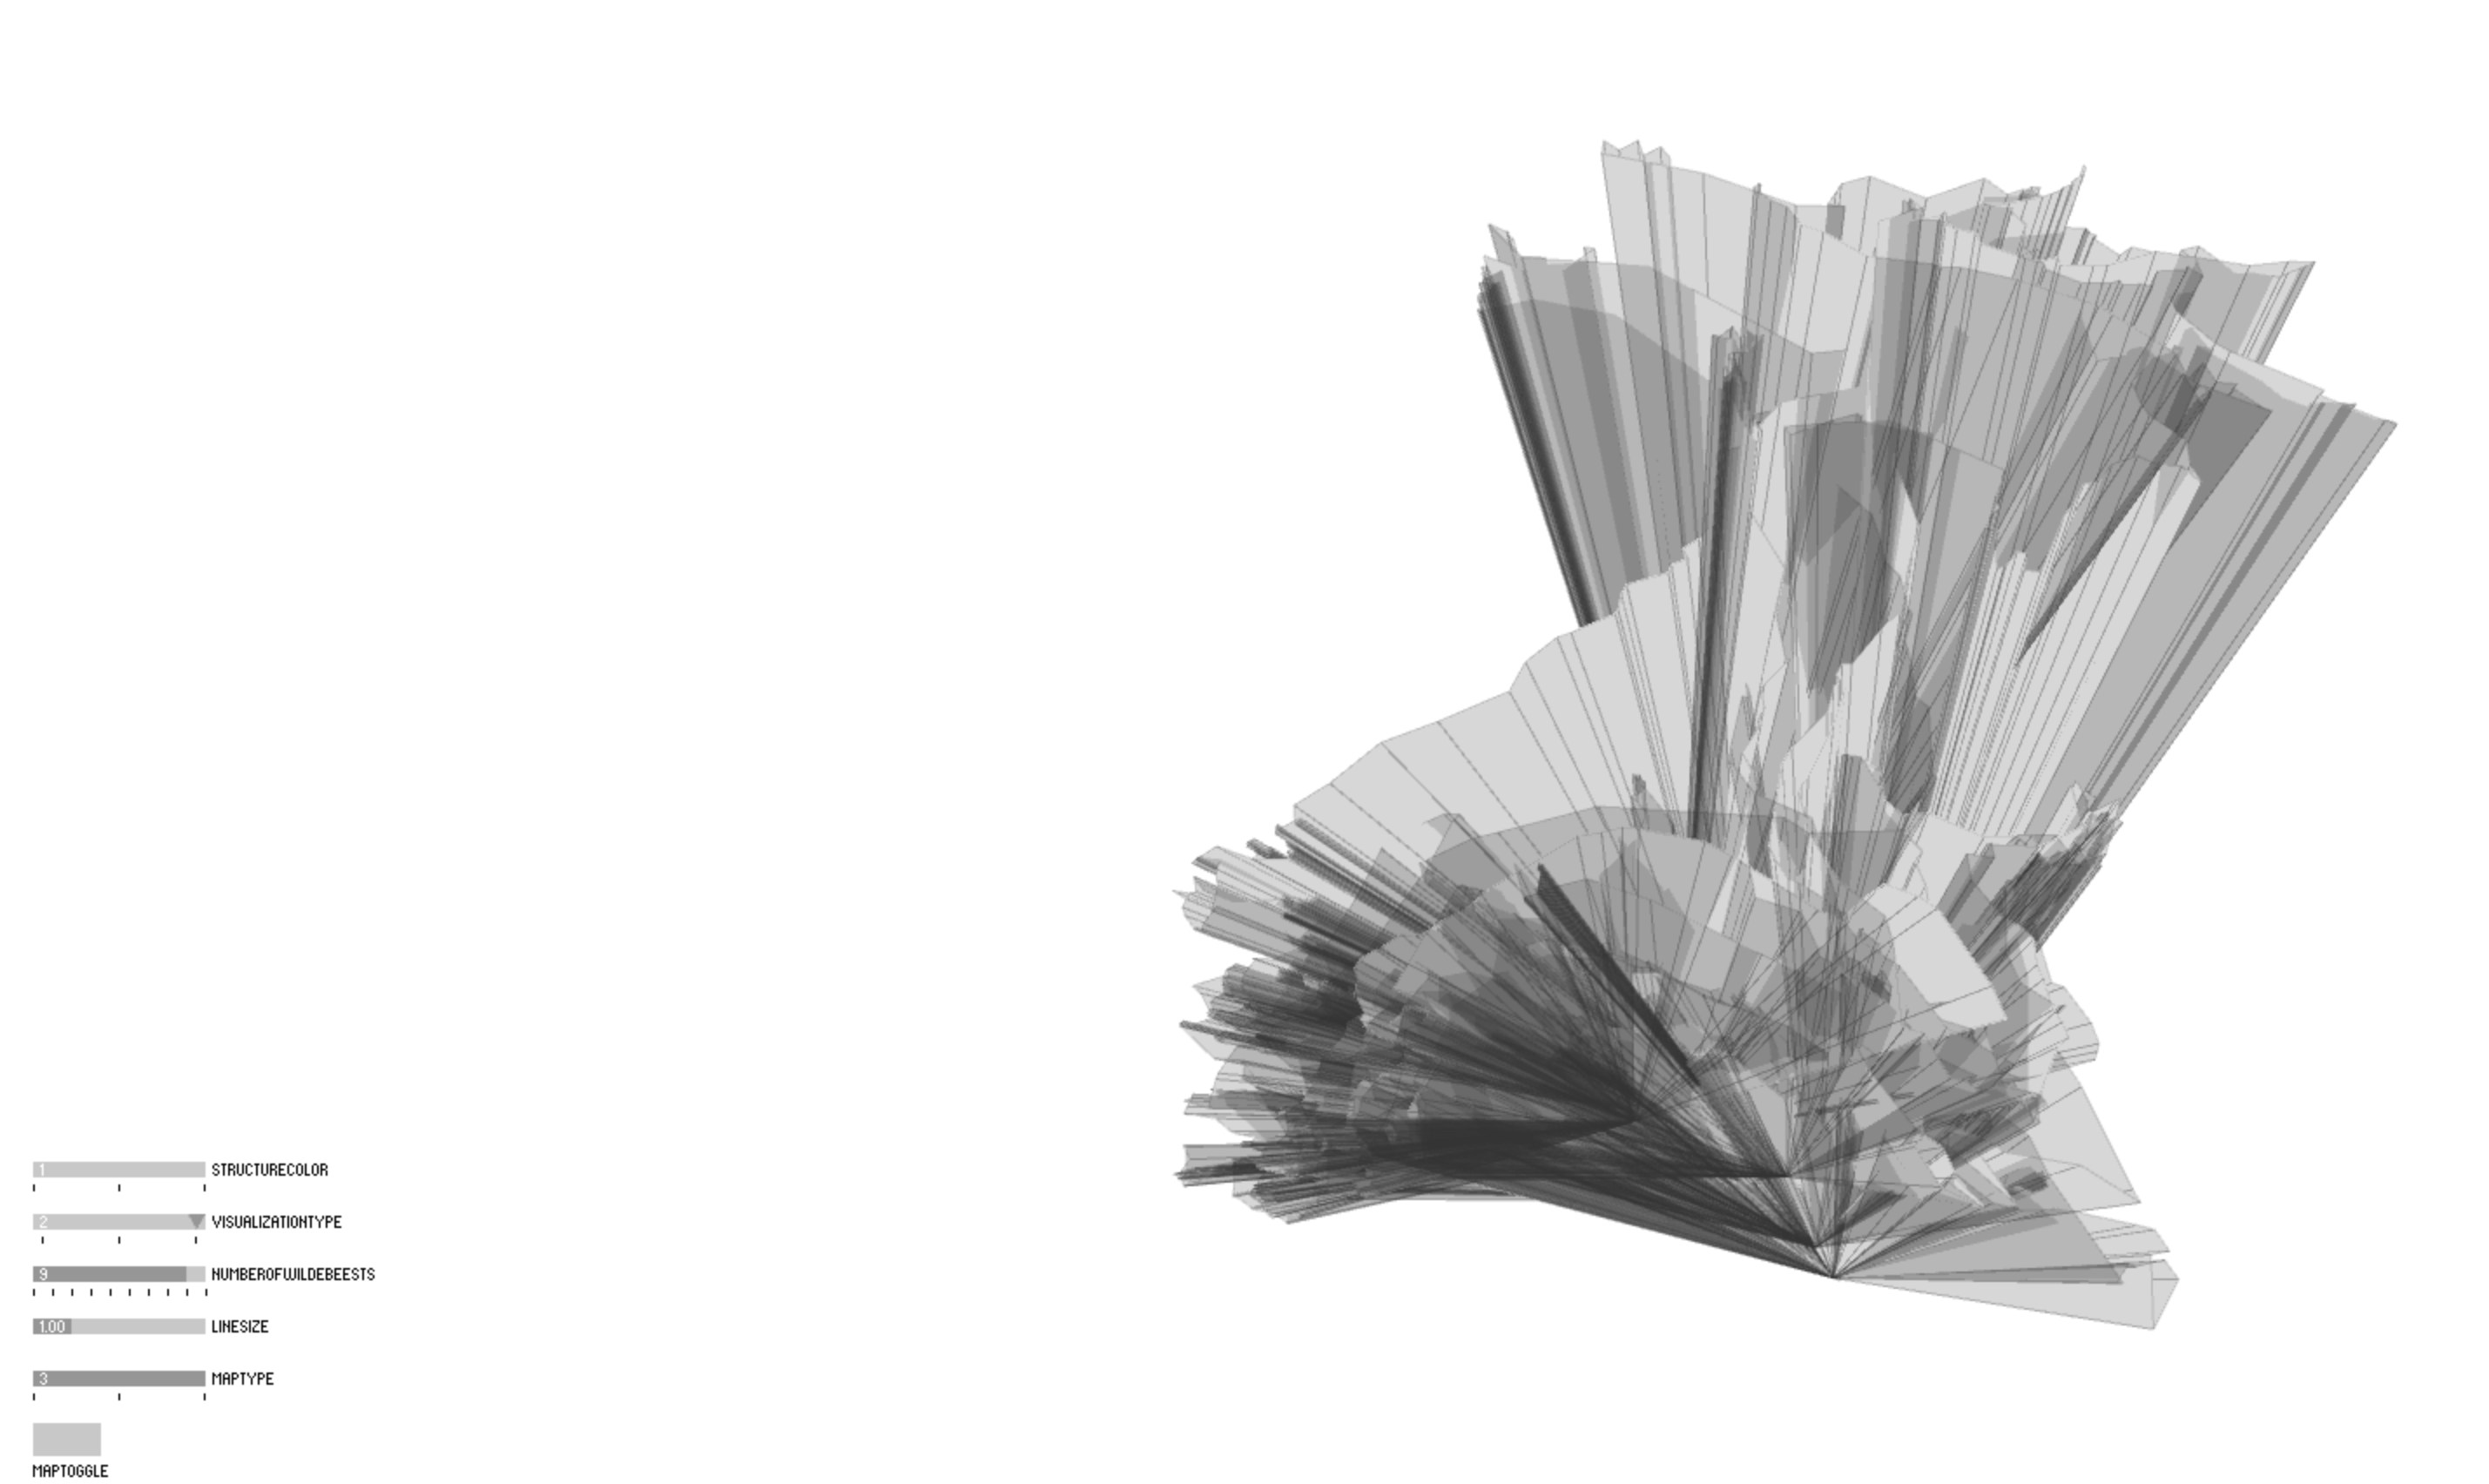
3. Fanning Structure - this method uses the GPS locations as vertices in constructing a shape that encompasses the total movement of all the wildebeests.
Structure Color: Provides the user with 3 ways to distinguish view the paths of the wildebeest. In the color version, each wildebeest is associated with a unique color.
Number of Wildebeest: The user is able to control how many wildebeest are shown at any given time.
Line Size: Increases/decreases the weight of the lines that are drawn.
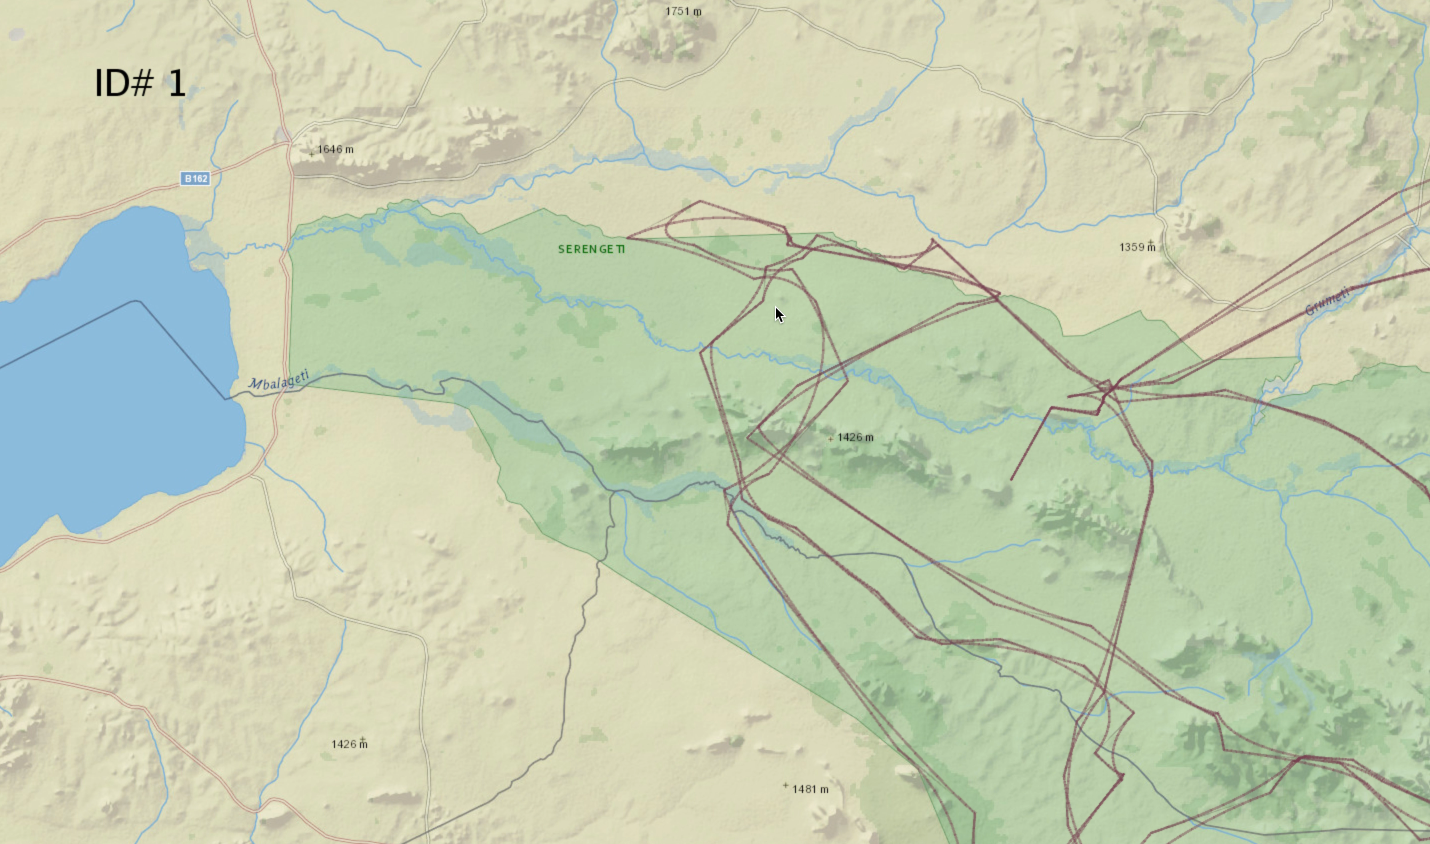
Map Type: After toggling on the Map visualizer, three different map types are available (minimal, terrain, and physical)