Global Warming & Marine Capture Production
MAT 259, 2016
Chang HE (Hilda)
Concept
I was curious about the relationship between global warming and marine capture puduction. So I want to visualize data of this topic. And I was also inspired and want to explore into a new area, called data vis with computational geometry shape.
So my objective is to create my own algorithm to make a shape to visualize those annual data I grab from internet about global warming and marine capture puduction
So my objective is to create my own algorithm to make a shape to visualize those annual data I grab from internet about global warming and marine capture puduction
Query
I grab my data basically from 3 websites:
Global Temperature
Sea Level
Global Marine Capture Production
Global Temperature
Sea Level
Global Marine Capture Production
Preliminary sketches
So this is the basic shape I want to use to visualize data. Each snowflake-ish shape represent a data set.
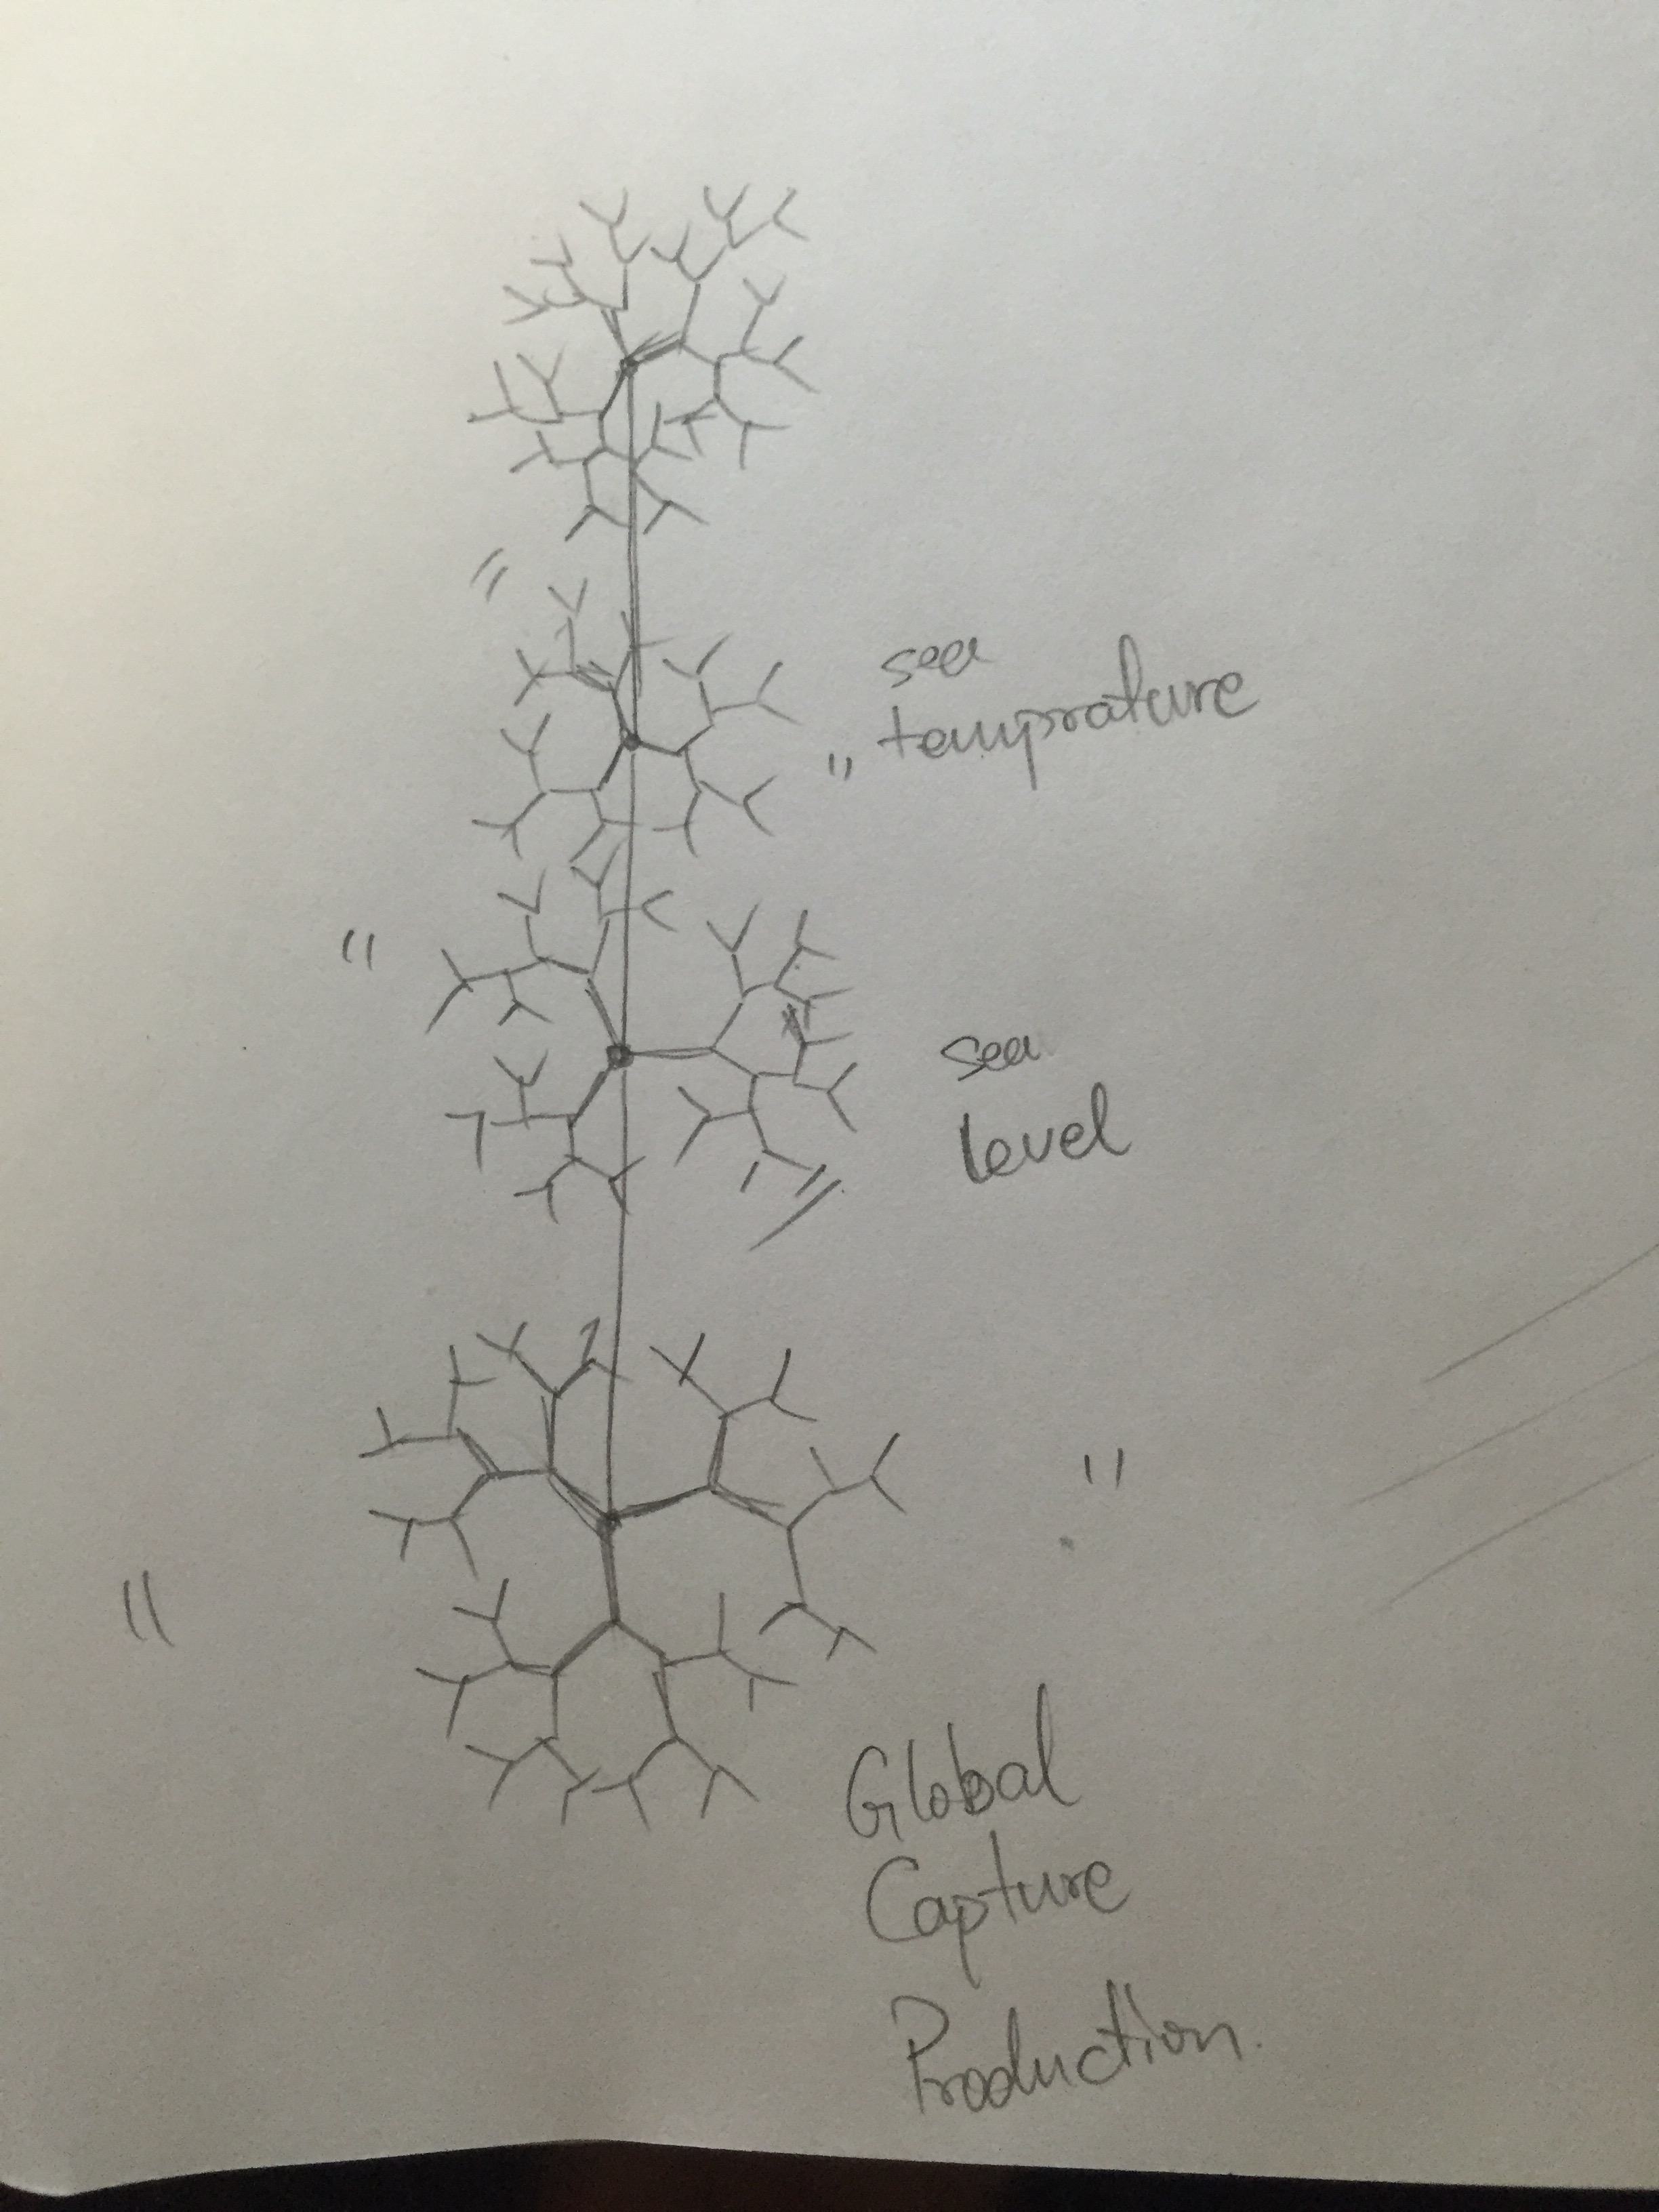
And the location incfomation of data (including both sea level and marine capture puduction) determines where each shape to be placed in the space of my project.
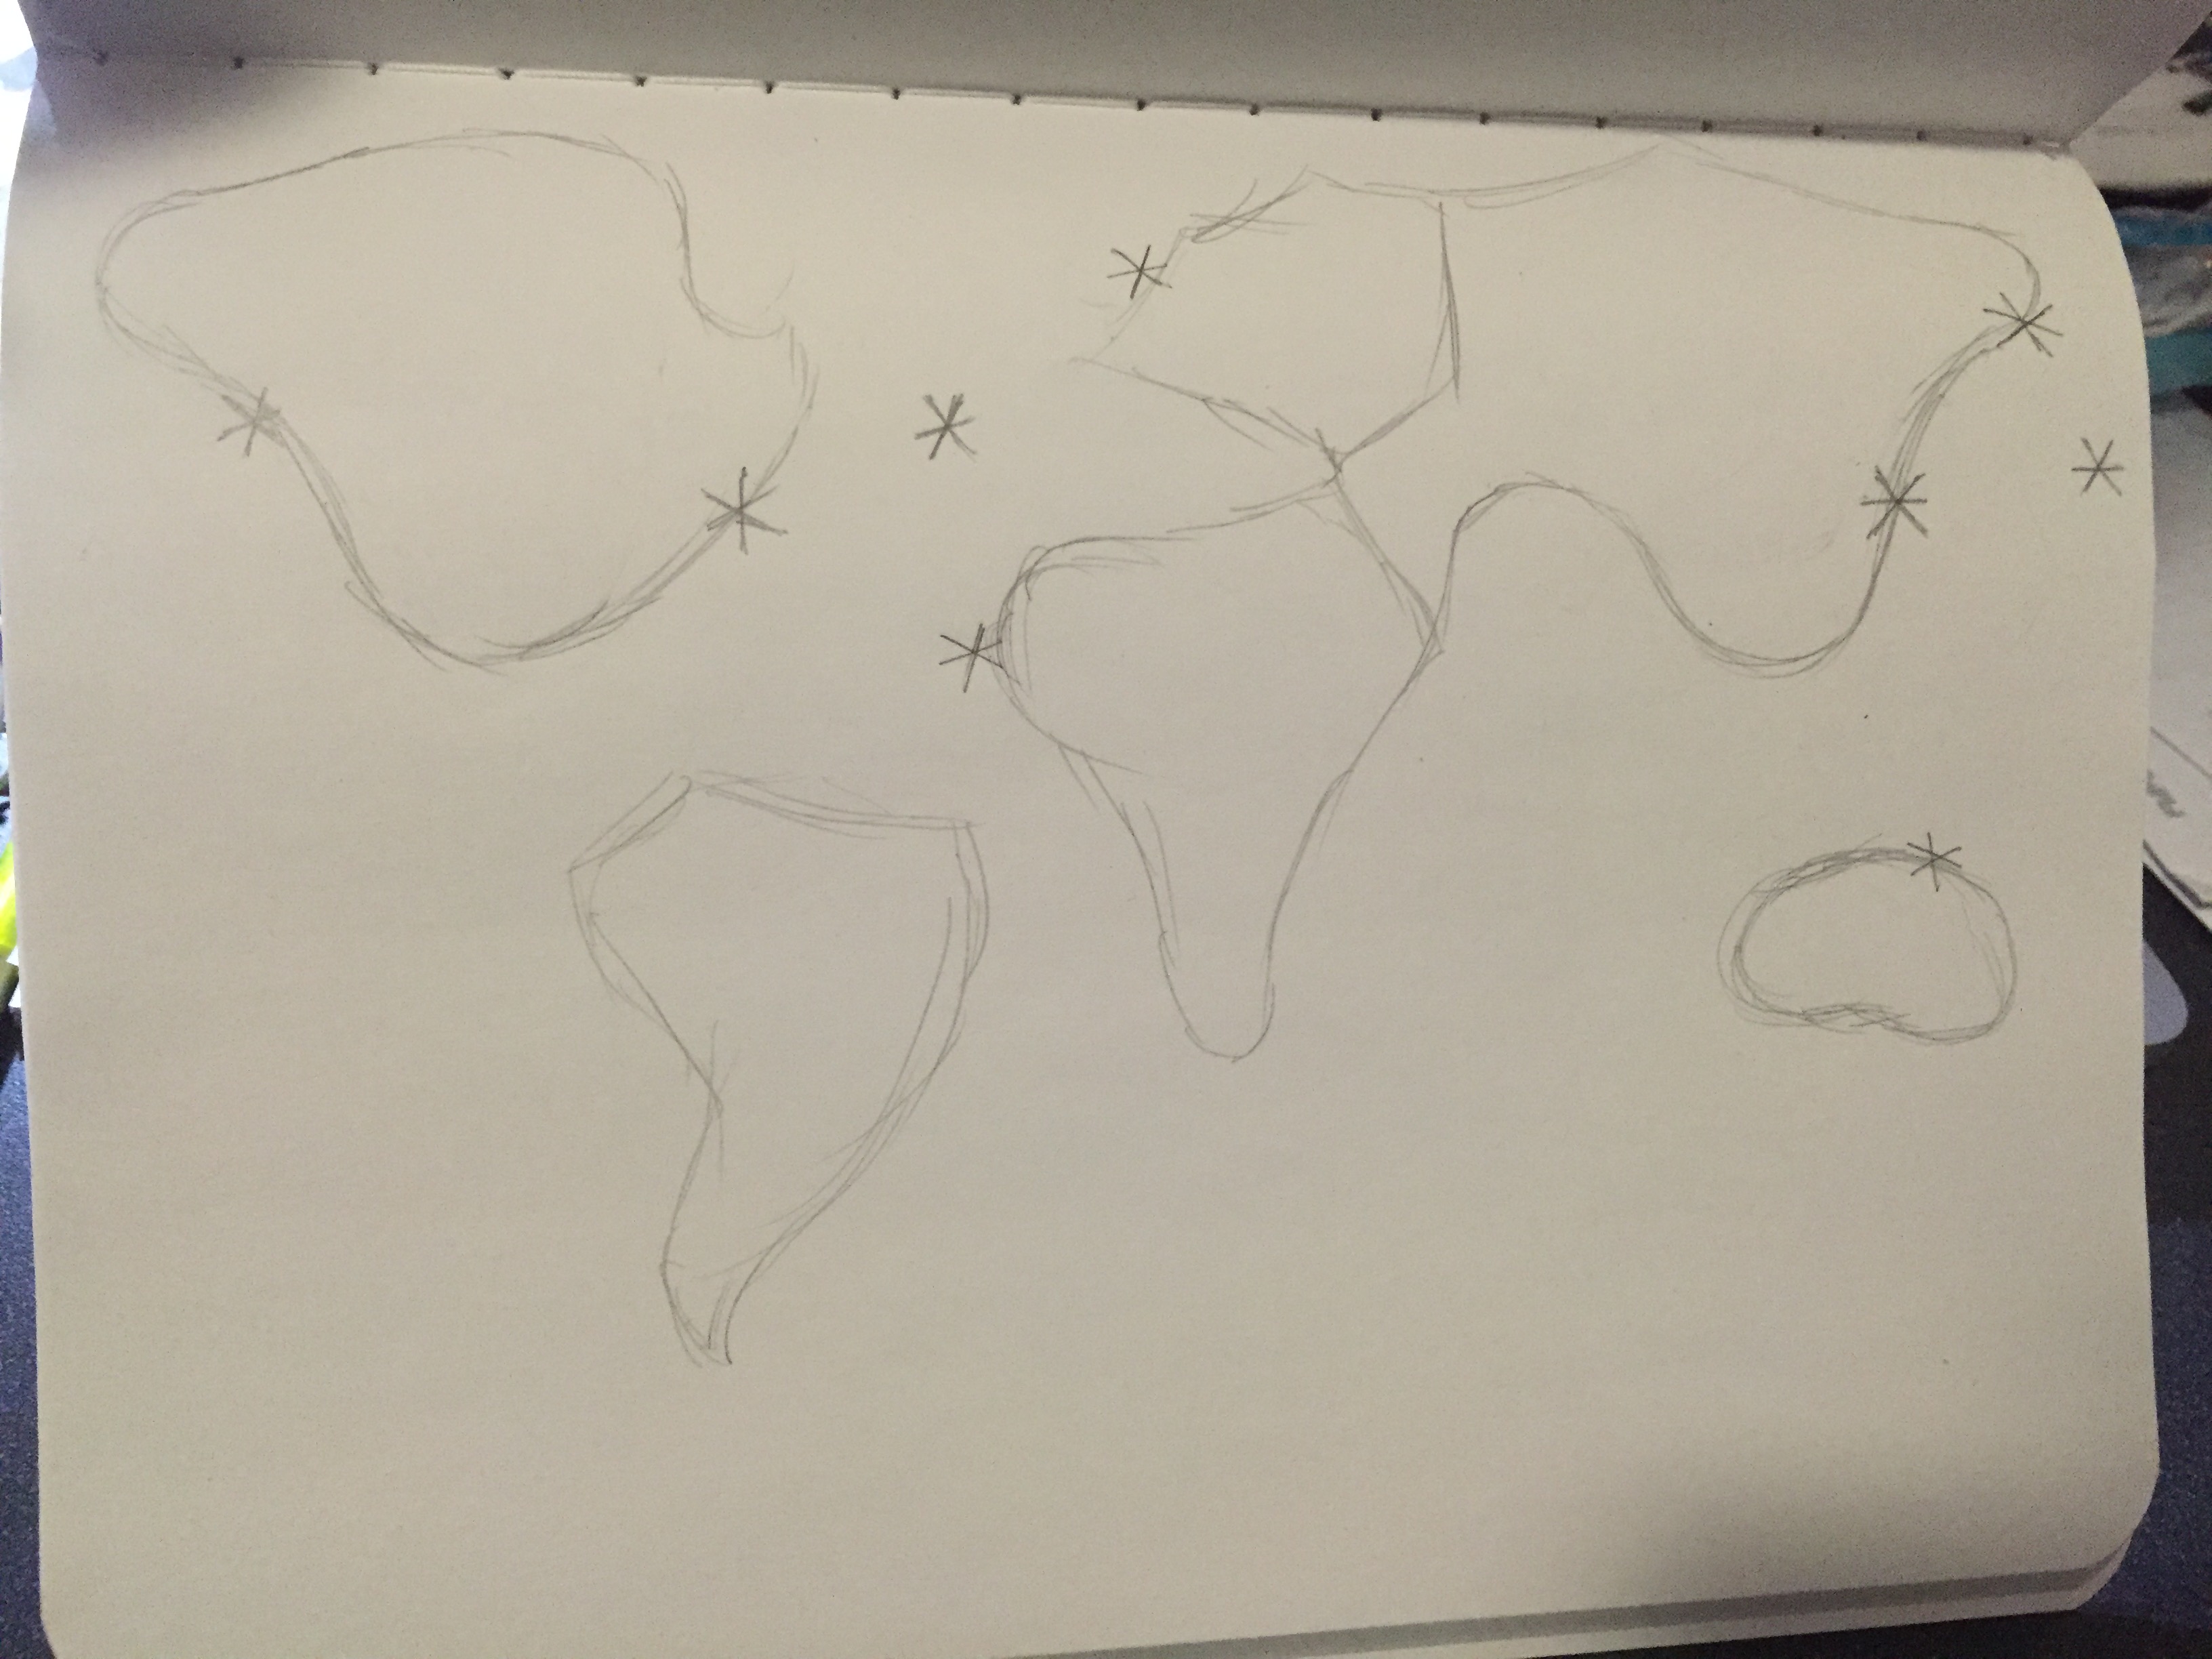
And the location incfomation of data (including both sea level and marine capture puduction) determines where each shape to be placed in the space of my project.
Process
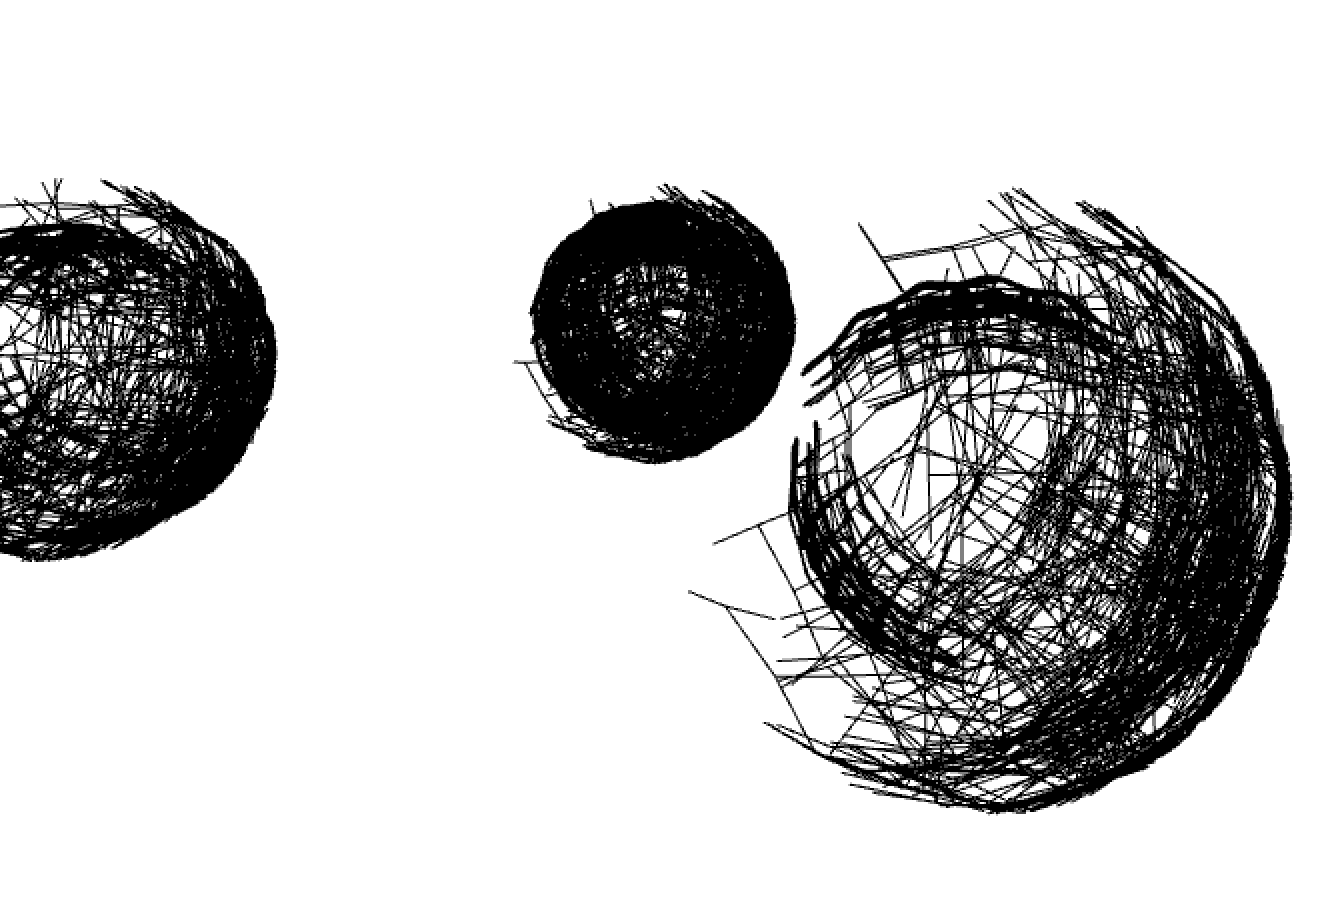
This is the shape I create using my algorithm.
So the length of each branch represent the data value. And those layers reveals the growth of your data. So basically, in this topic I chose, how many year's data I have determines how many layers the shape has. For instant, If I have 10 years' data about annual sea level within a specific ocean area, my algorithm will create a 10 layers' snowflake-ish shape, and the length of each branch is determined by the sea level value of that year.
The center fomula to create nodes in the next level is as folow:
node = v_add(v_mul(v_dir(vertical), len), start);
//This makes the shape grow in all the derections.
node = v_add(v_add(v_sub(start, node), v_mul(v_dir(v_sub(start,center)), extend * v_len(PS))), start);
//This extends the shape to a bigger sphere.

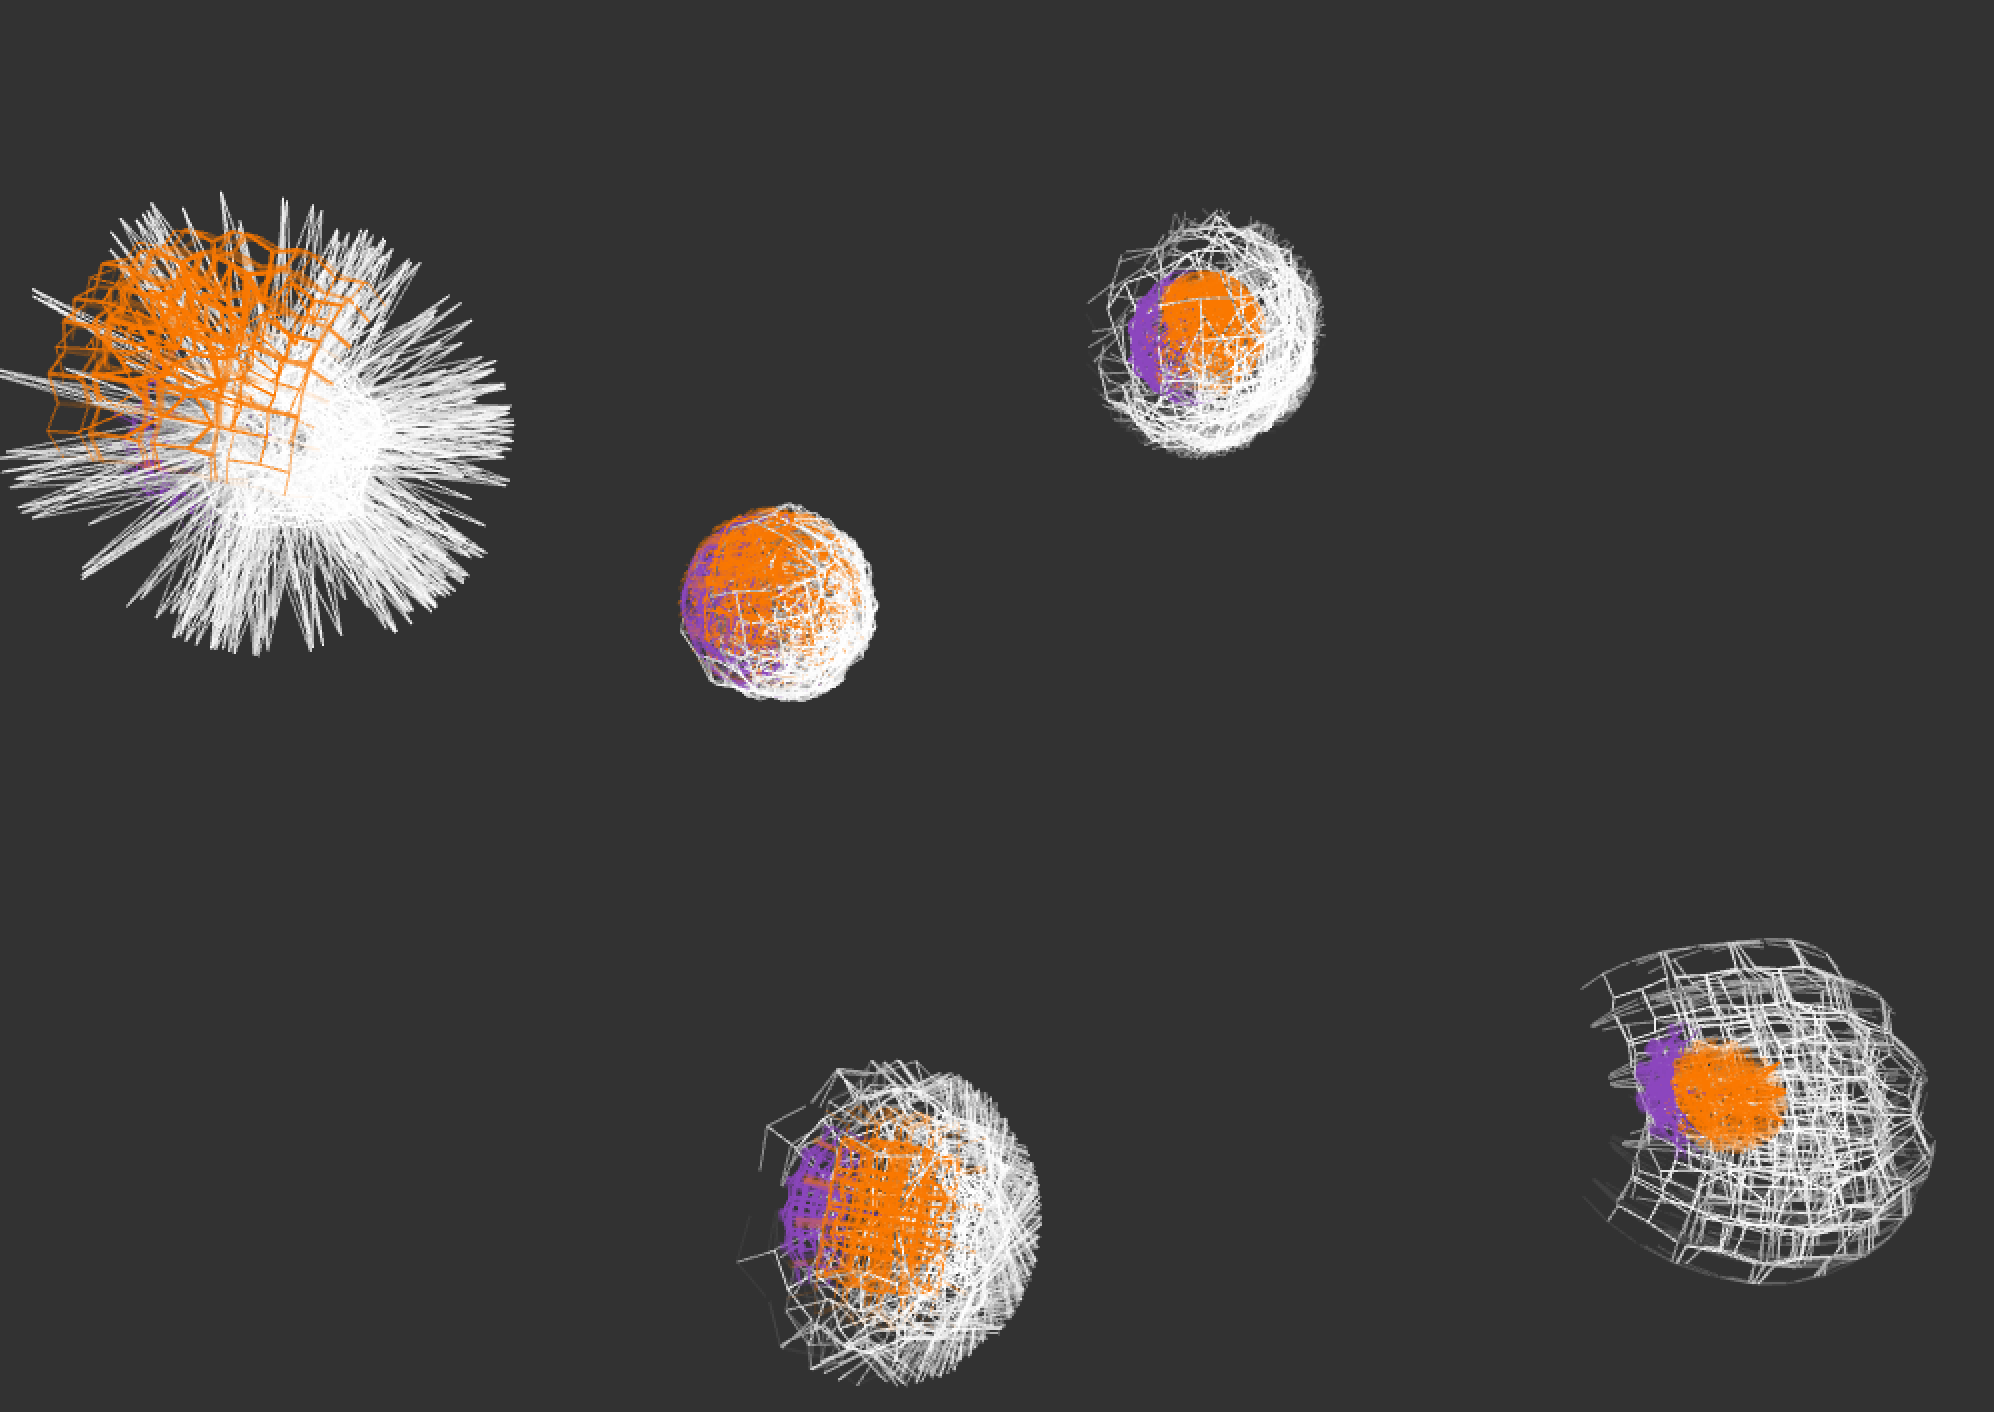
So I adjust some parameters in the formula to make it into a spher-ish shape.
After I dumped my Global Marine Capture Prodution data into the shape, it looks like this. The shapes represent the data from different areas from left to right correspondingly as below: West America coast, East America coast, West Africa coast, West Europine coast and East Asia coast.
So the length of each branch represent the data value. And those layers reveals the growth of your data. So basically, in this topic I chose, how many year's data I have determines how many layers the shape has. For instant, If I have 10 years' data about annual sea level within a specific ocean area, my algorithm will create a 10 layers' snowflake-ish shape, and the length of each branch is determined by the sea level value of that year.
The center fomula to create nodes in the next level is as folow:
node = v_add(v_mul(v_dir(vertical), len), start);
//This makes the shape grow in all the derections.
node = v_add(v_add(v_sub(start, node), v_mul(v_dir(v_sub(start,center)), extend * v_len(PS))), start);
//This extends the shape to a bigger sphere.
So I adjust some parameters in the formula to make it into a spher-ish shape.
After I dumped my Global Marine Capture Prodution data into the shape, it looks like this. The shapes represent the data from different areas from left to right correspondingly as below: West America coast, East America coast, West Africa coast, West Europine coast and East Asia coast.
Final result
This is the final main page looks like.
You could see each of the shape looks different slightly based on its input raw data. The bigger the shape is, the larger the input data is. The wider the shape is, the faster the data growing each year.
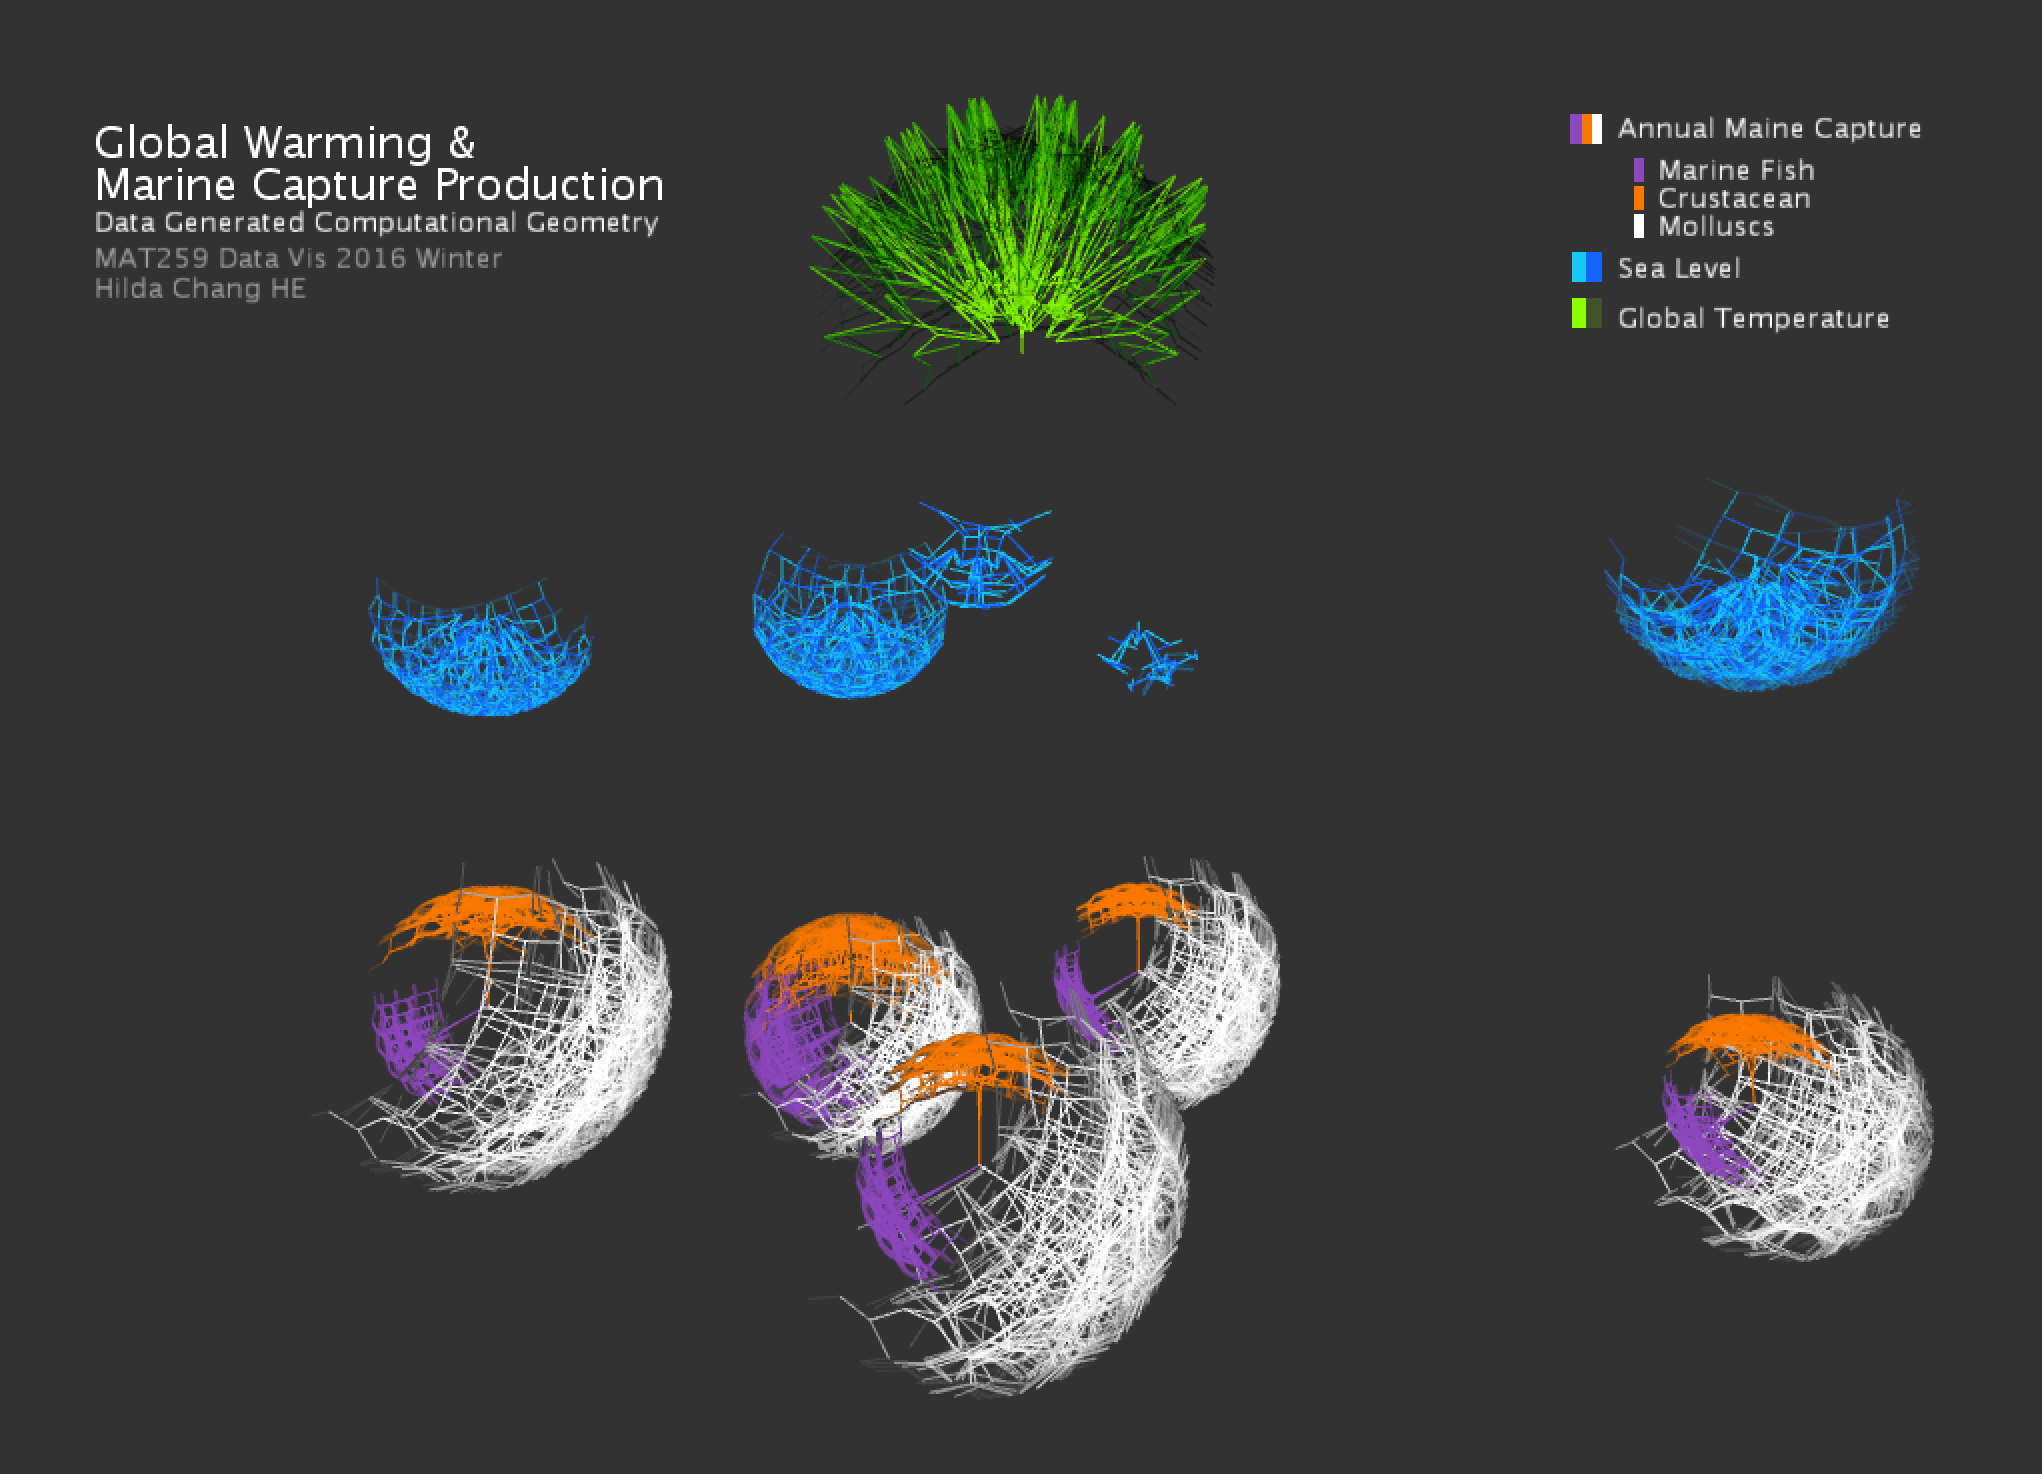
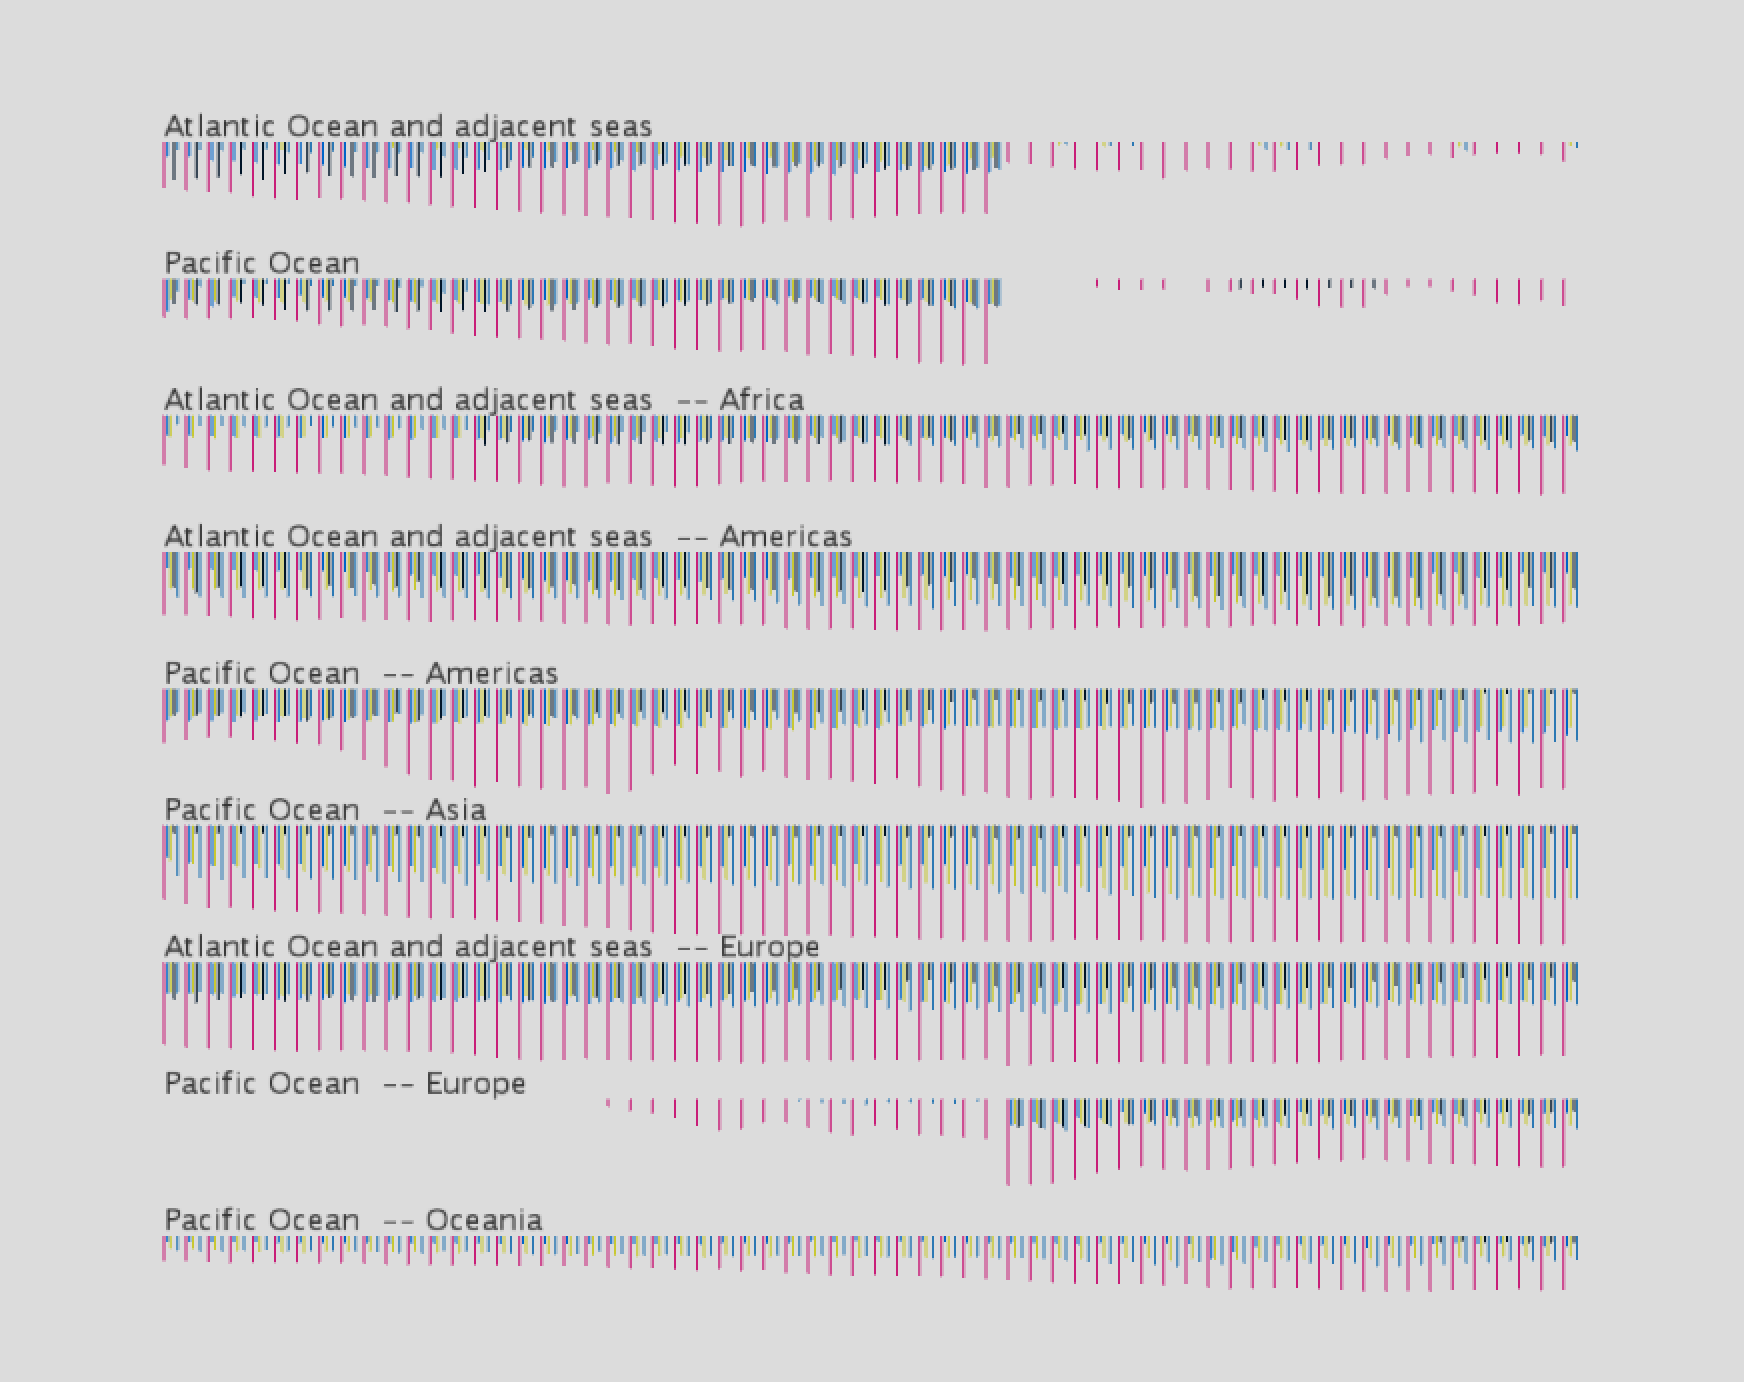
And I also made a complementary page for people to see the raw data by clicking at "c" on keyboard.
You could see each of the shape looks different slightly based on its input raw data. The bigger the shape is, the larger the input data is. The wider the shape is, the faster the data growing each year.
And I also made a complementary page for people to see the raw data by clicking at "c" on keyboard.
Code