Code of Red , A Pallete of War and Art
MAT 259, 2016
Ambika Yadav
Concept
Code of red is an attempt to interactively visualise the dependency of creation of artwork on wars across the world. In a more generic sense, I wanted to look into how oppression effects artists and pushes them to throw out more of their thoughts and ideas.
In a way ,through this is visualisation I wanted to put across how art is a powerful tool, a tool to put across new perspectives, new ideas, make the coming and current generations more aware of how their actions are modifying the world.
Precisely, I have looked into the period of 1900 - 2000 and visualised the period of wars and completed artwork over these years in 21 countries.
Query
I was looking into two main datasets to for this project . Both the datasets were collected using the a Data Crawler developed using the Beautiful Soup library on Python, which accesed Wikimedia (for Artwork) and Wikipedia (for War Period) and extracted the required data :
SELECT Artist_Name,Artwork_Name,Year
FROM Final_Project.America
WHERE Final_Project.America.Year >= 1900
Order By Final_Project.America.Artist_Name ASC,Final_Project.America.Year ASC ;
- Data about the wars and war periods in different countries (War Name, Start Year and End Year).
- Data about artwork (Nationality, Artist Name, Artwork Name, Year of Completion). After extraction this data had to be sorted, as it covered a wide range of artwork. I used mySQL and extracted artworks completed in the years 1900 - 2000 and then sorted the data with the artist and then years.
SELECT Artist_Name,Artwork_Name,Year
FROM Final_Project.America
WHERE Final_Project.America.Year >= 1900
Order By Final_Project.America.Artist_Name ASC,Final_Project.America.Year ASC ;
Preliminary sketches
Once, I had extracted data, I cleaned up the data for one country in order to test and establish a visualisation. I wanted to design a 2D visualisation using circle and dots to visualise this data.
The visualisation can be better understood looking at the sketch here.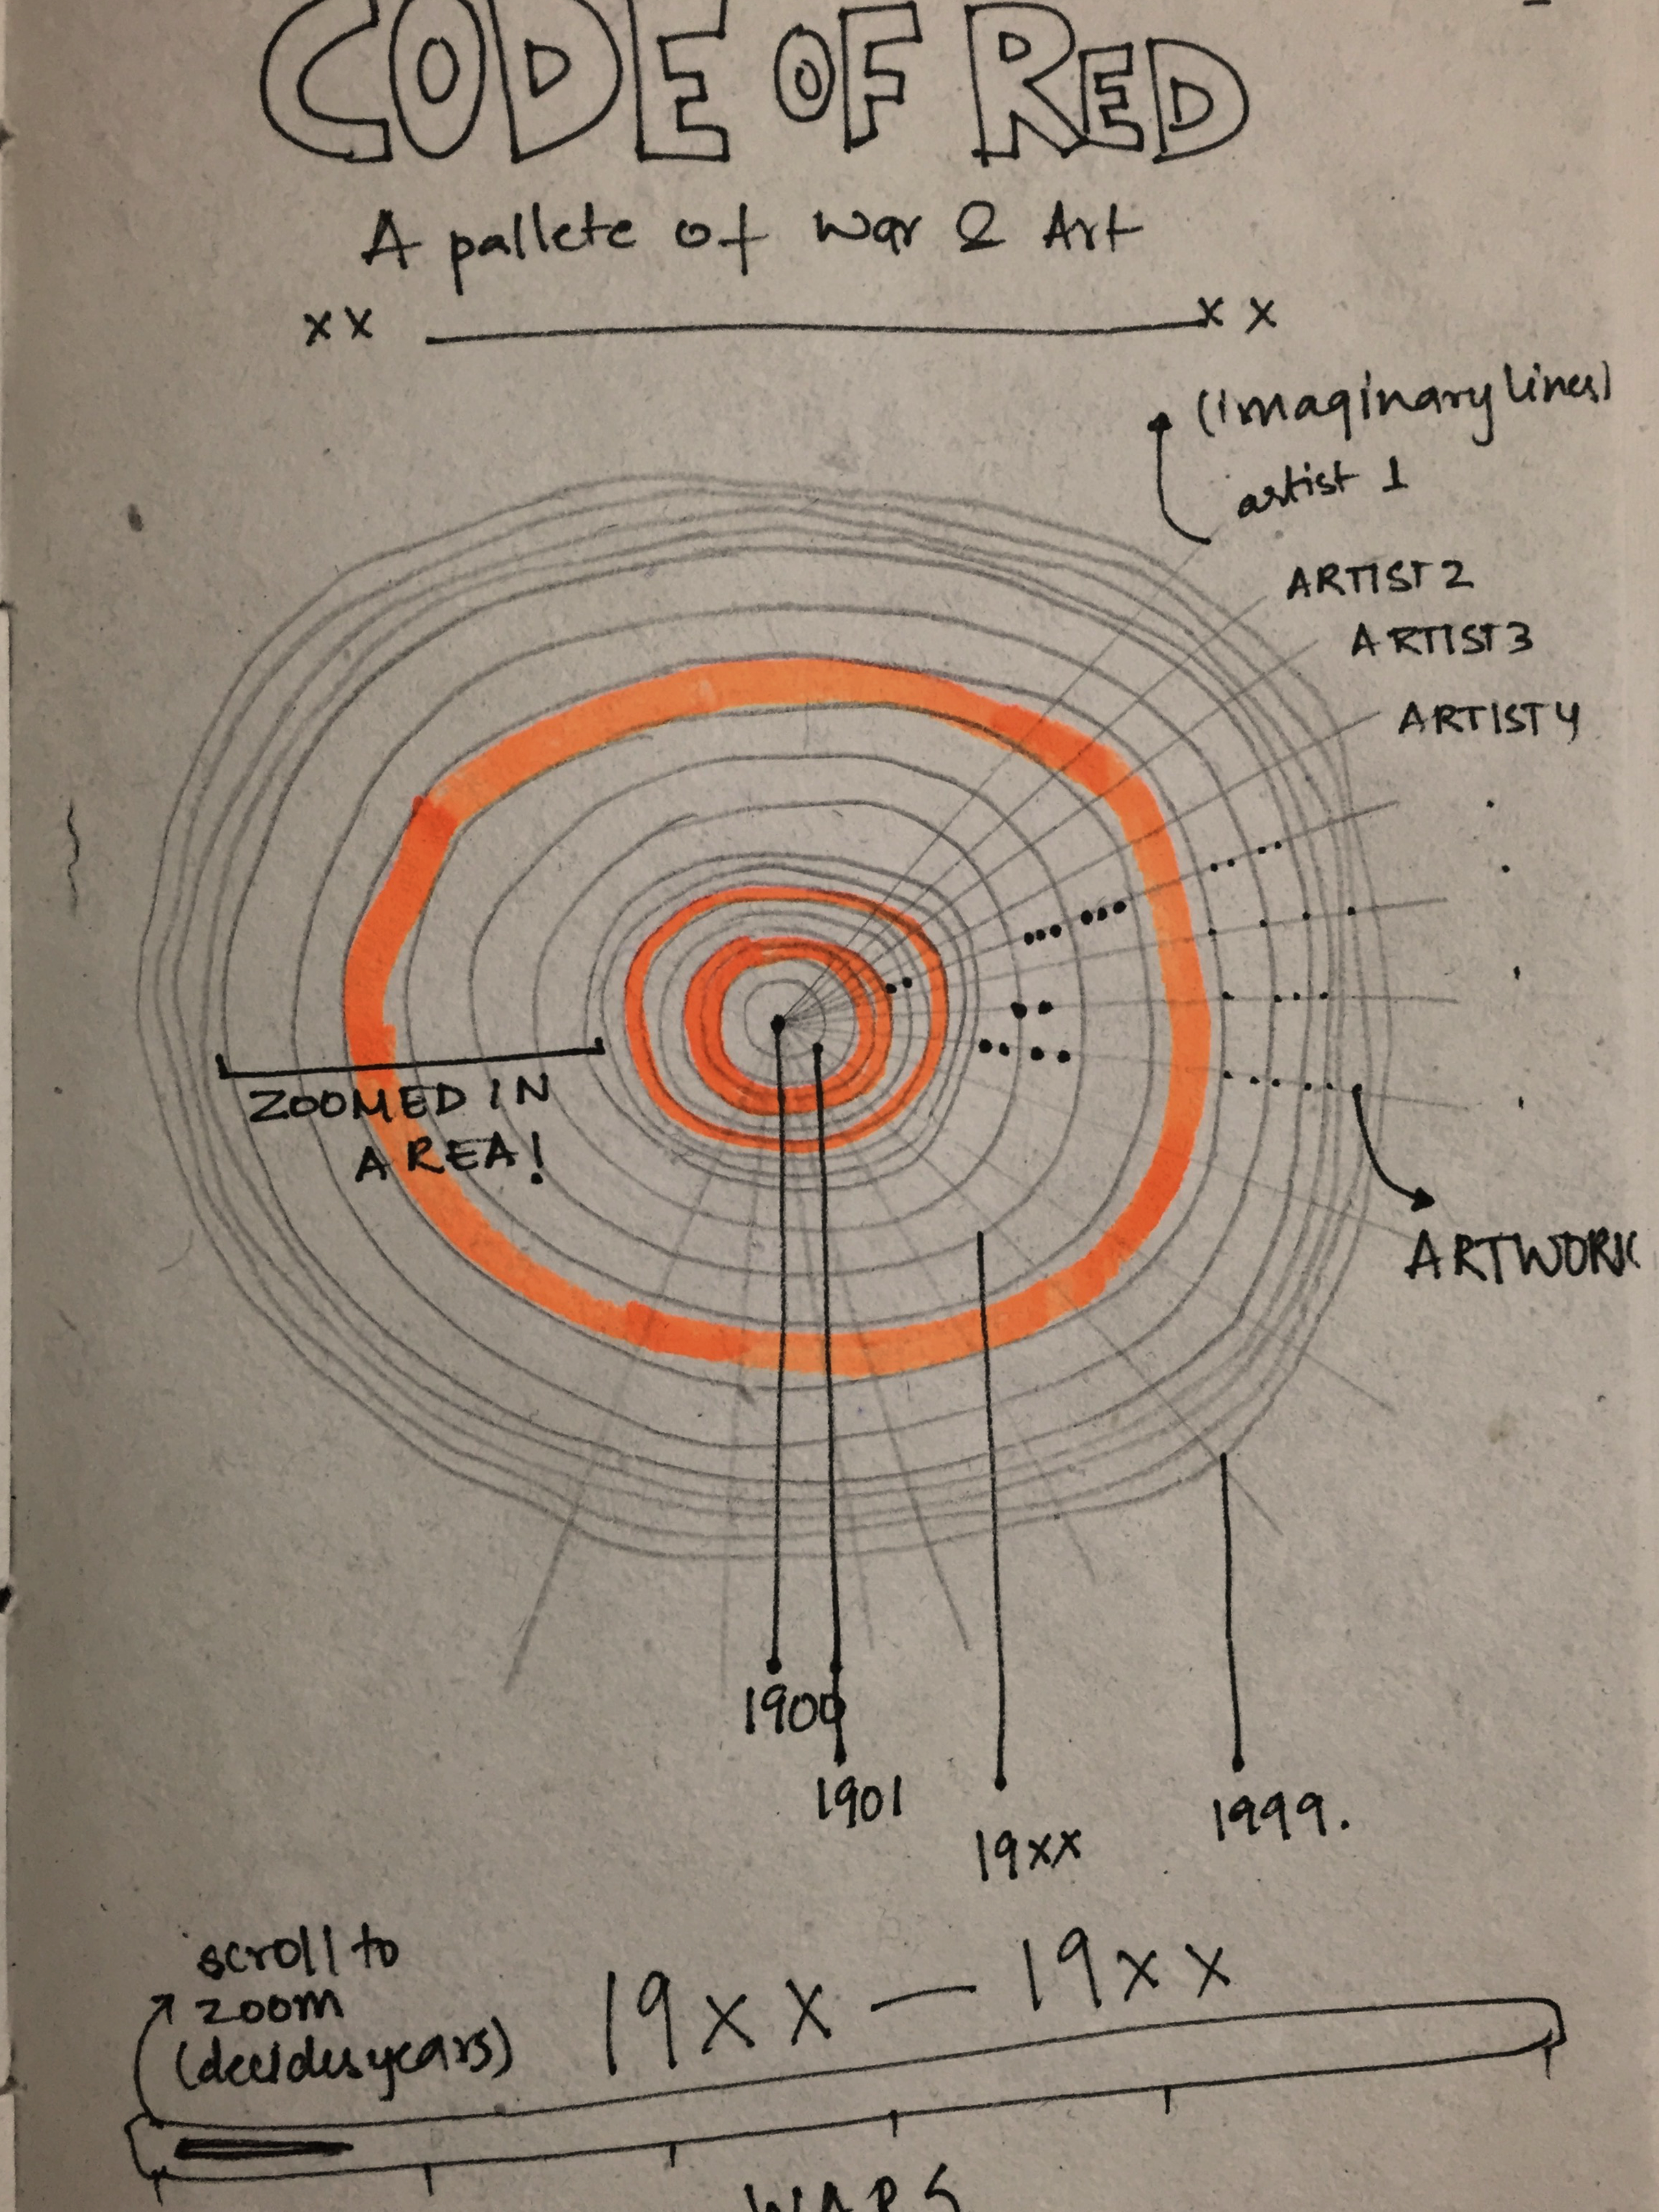
The visualisation can be better understood looking at the sketch here.
Process
I started the process with laying the foundation of interaction of the visualisation. One of the key aspects of the visualisaion, was the ability to view the zoomed in version of desired decade. I initially did a mapping of the x position of mouse to the years which were zoomed in.
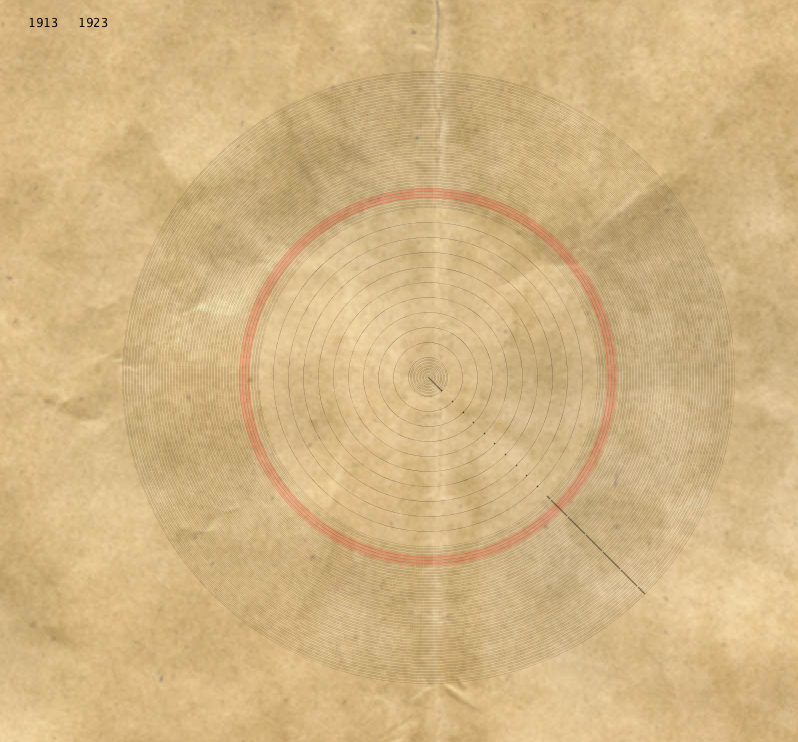
Once this was established I put in the data regarding the wars in the visualisation for one country.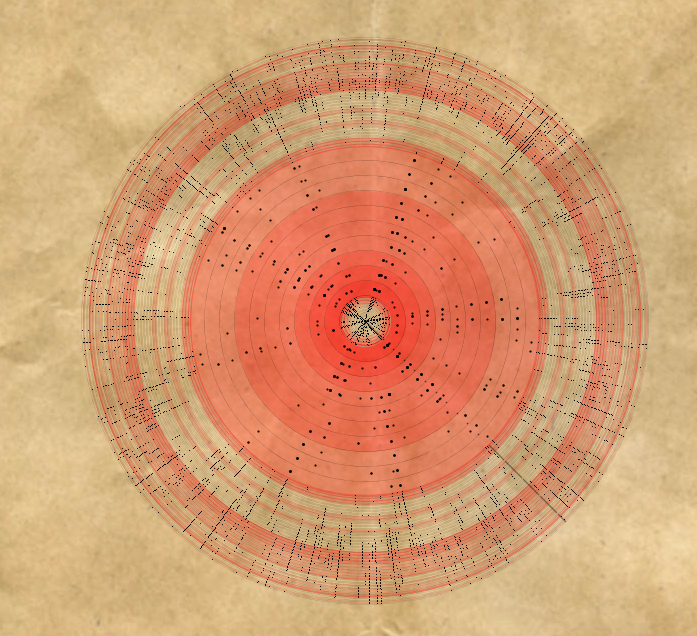
The next step was to add the artist and artwork data. After testing for country, I added the data for all countries and all the final elements for the visualisations.
Once this was established I put in the data regarding the wars in the visualisation for one country.
The next step was to add the artist and artwork data. After testing for country, I added the data for all countries and all the final elements for the visualisations.
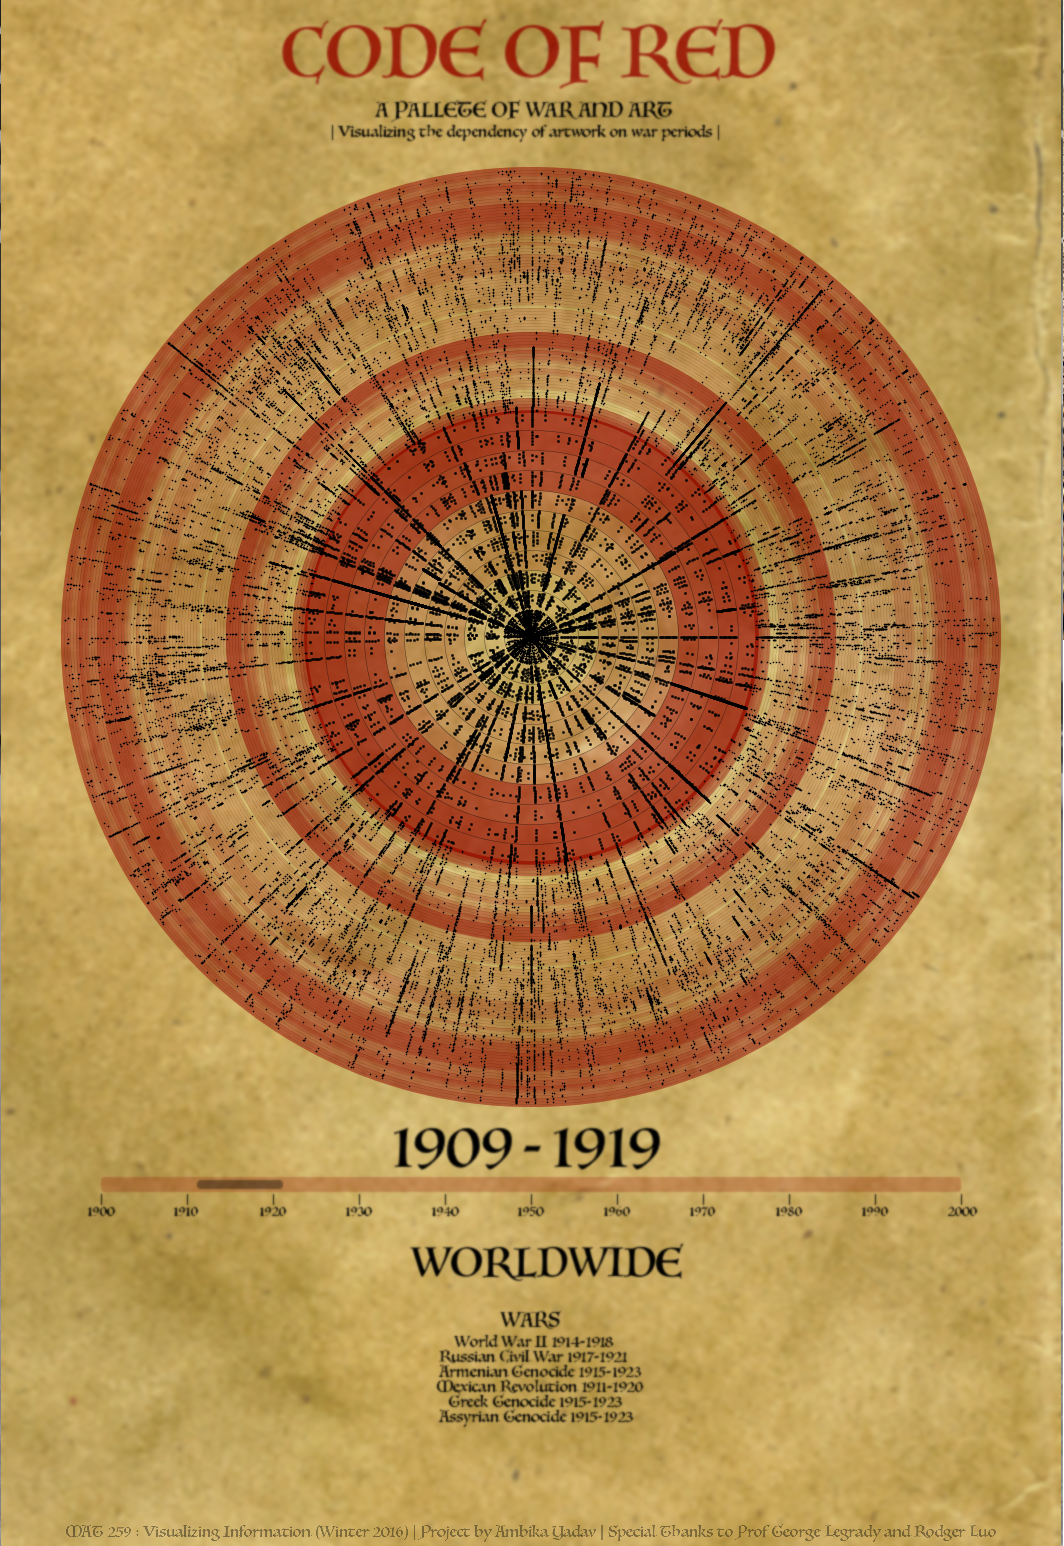
Final result
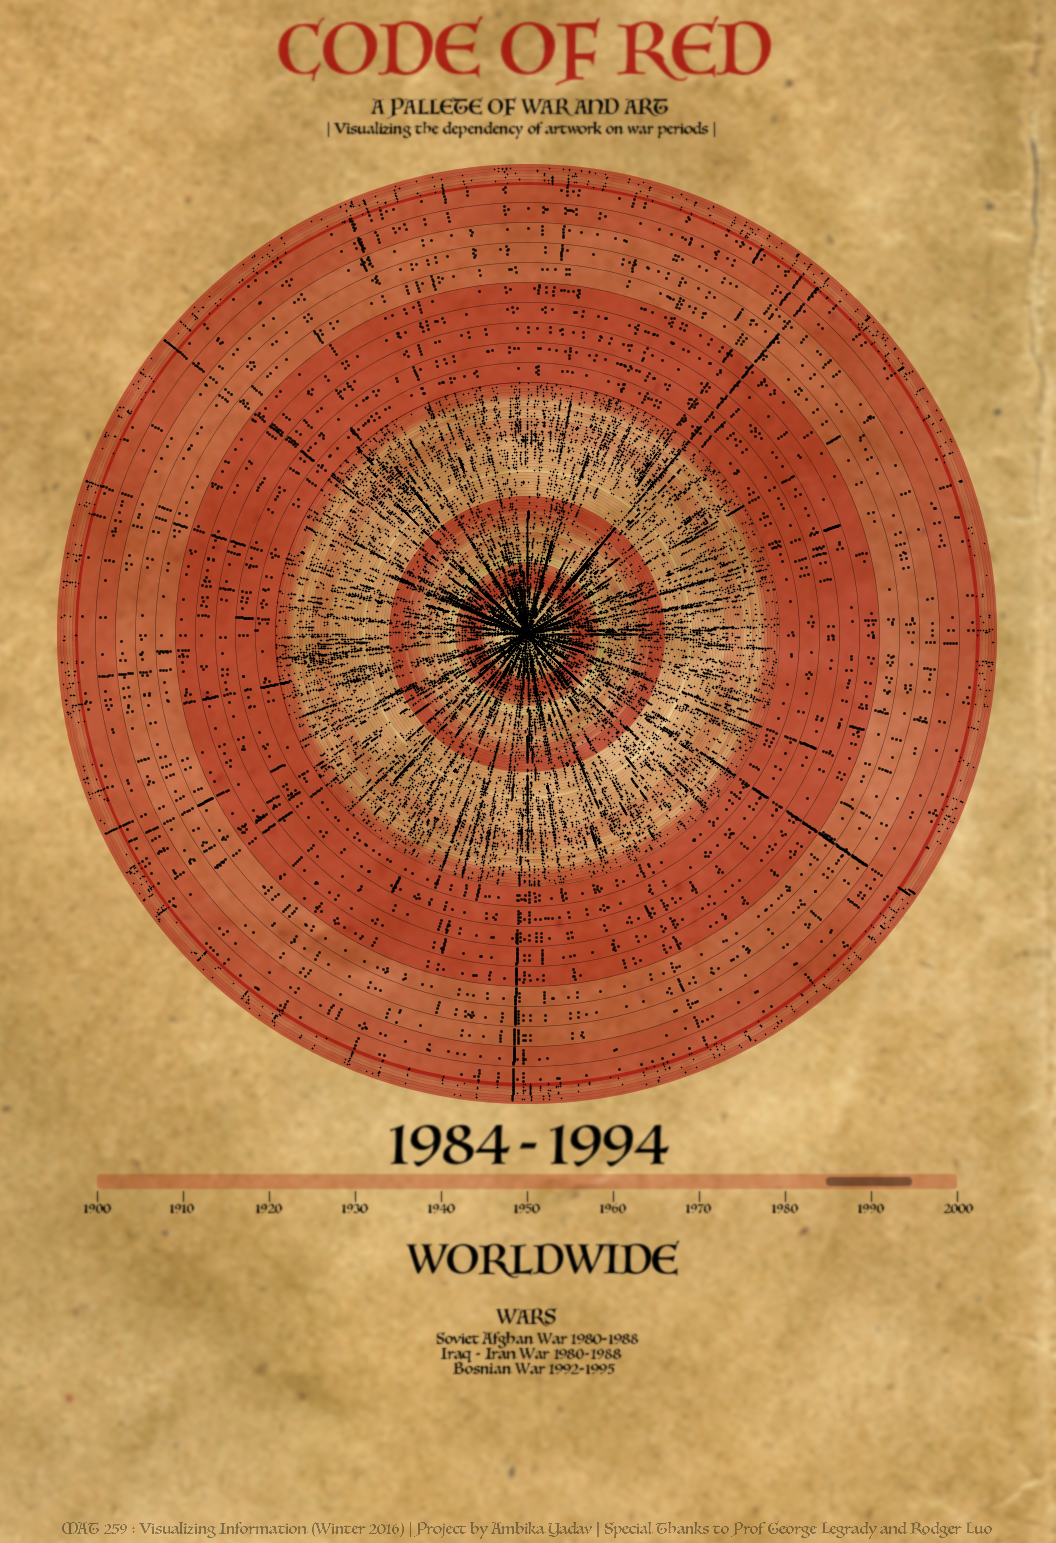
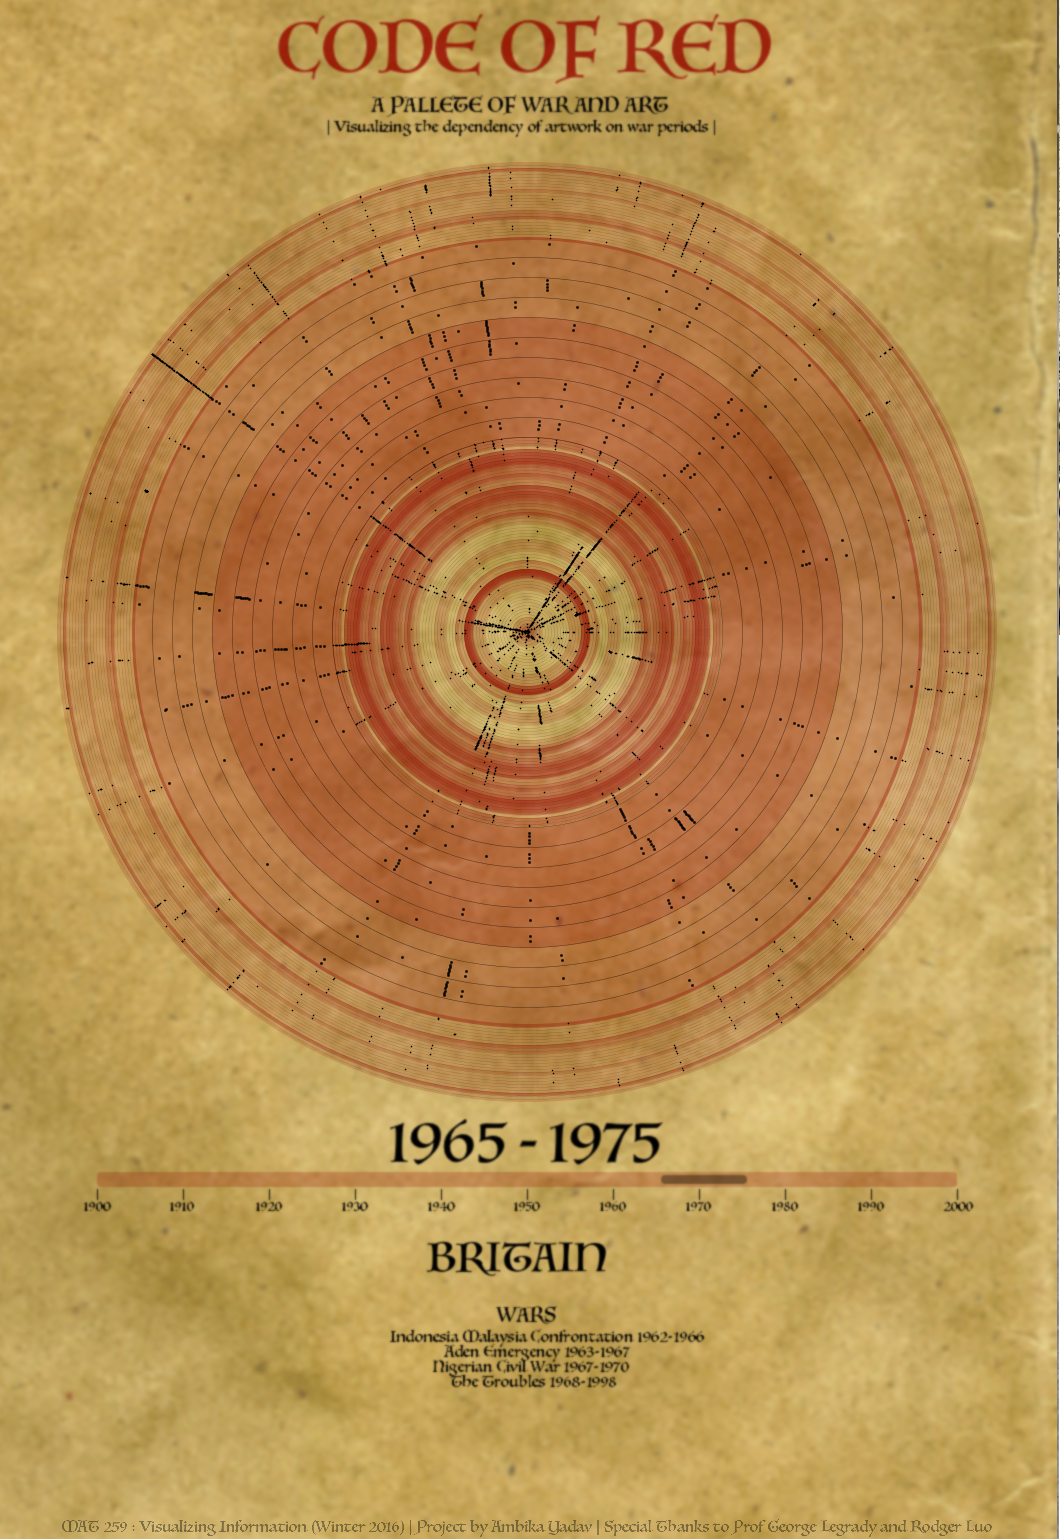
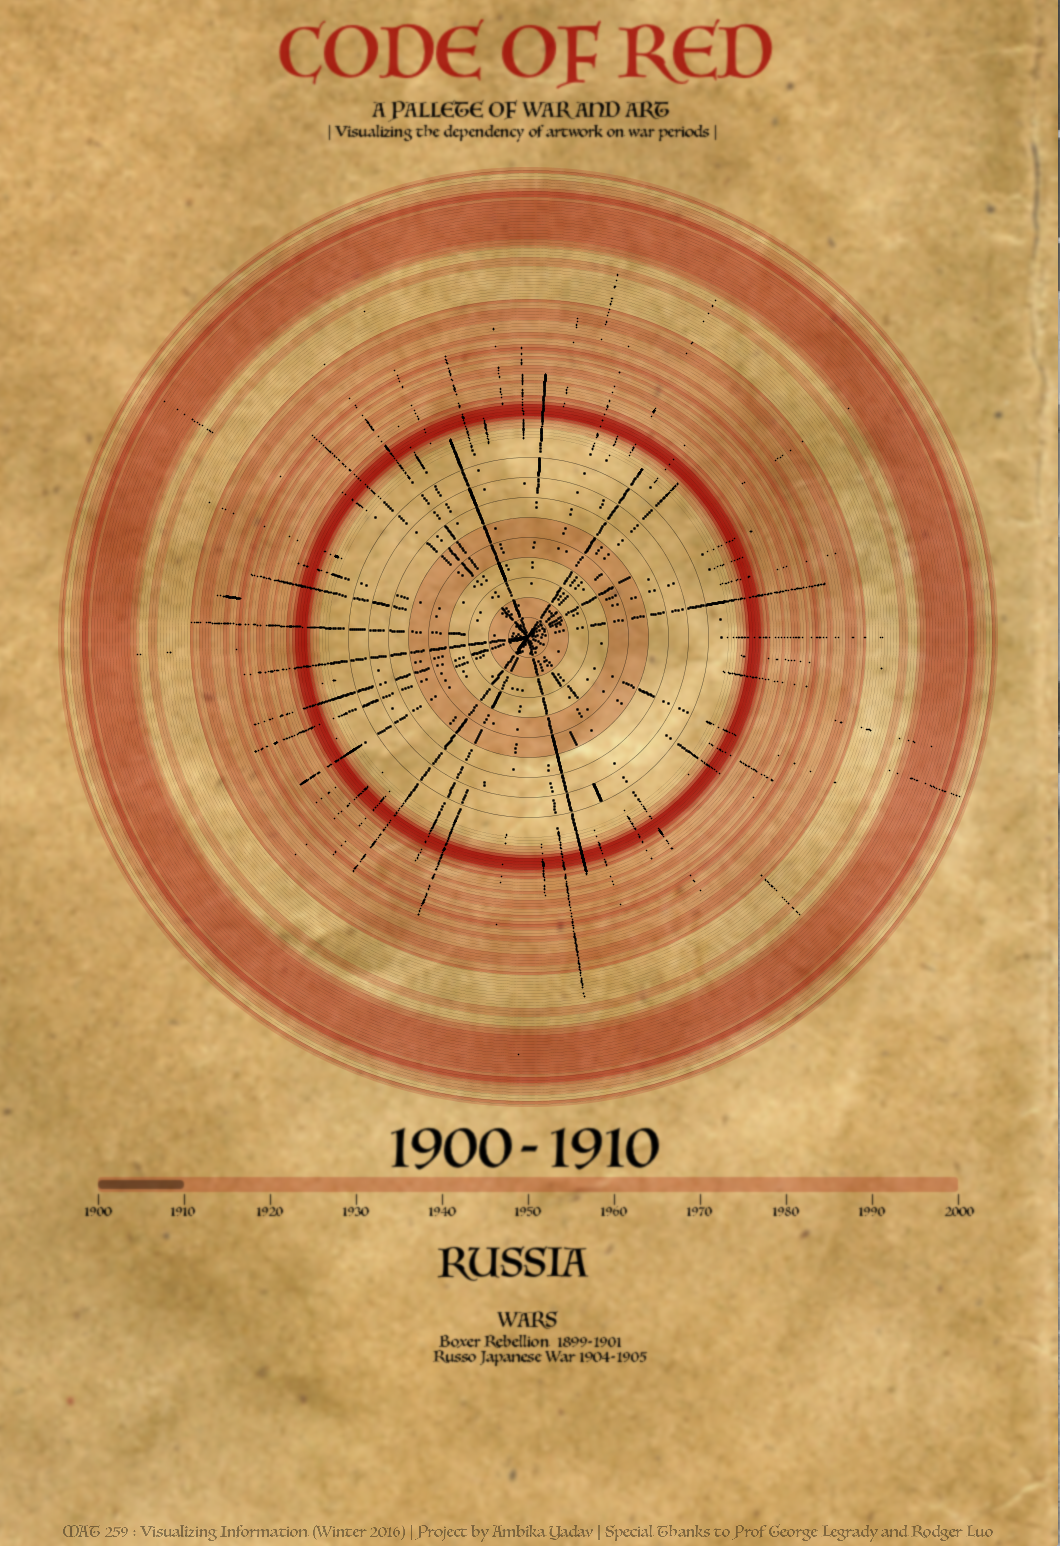
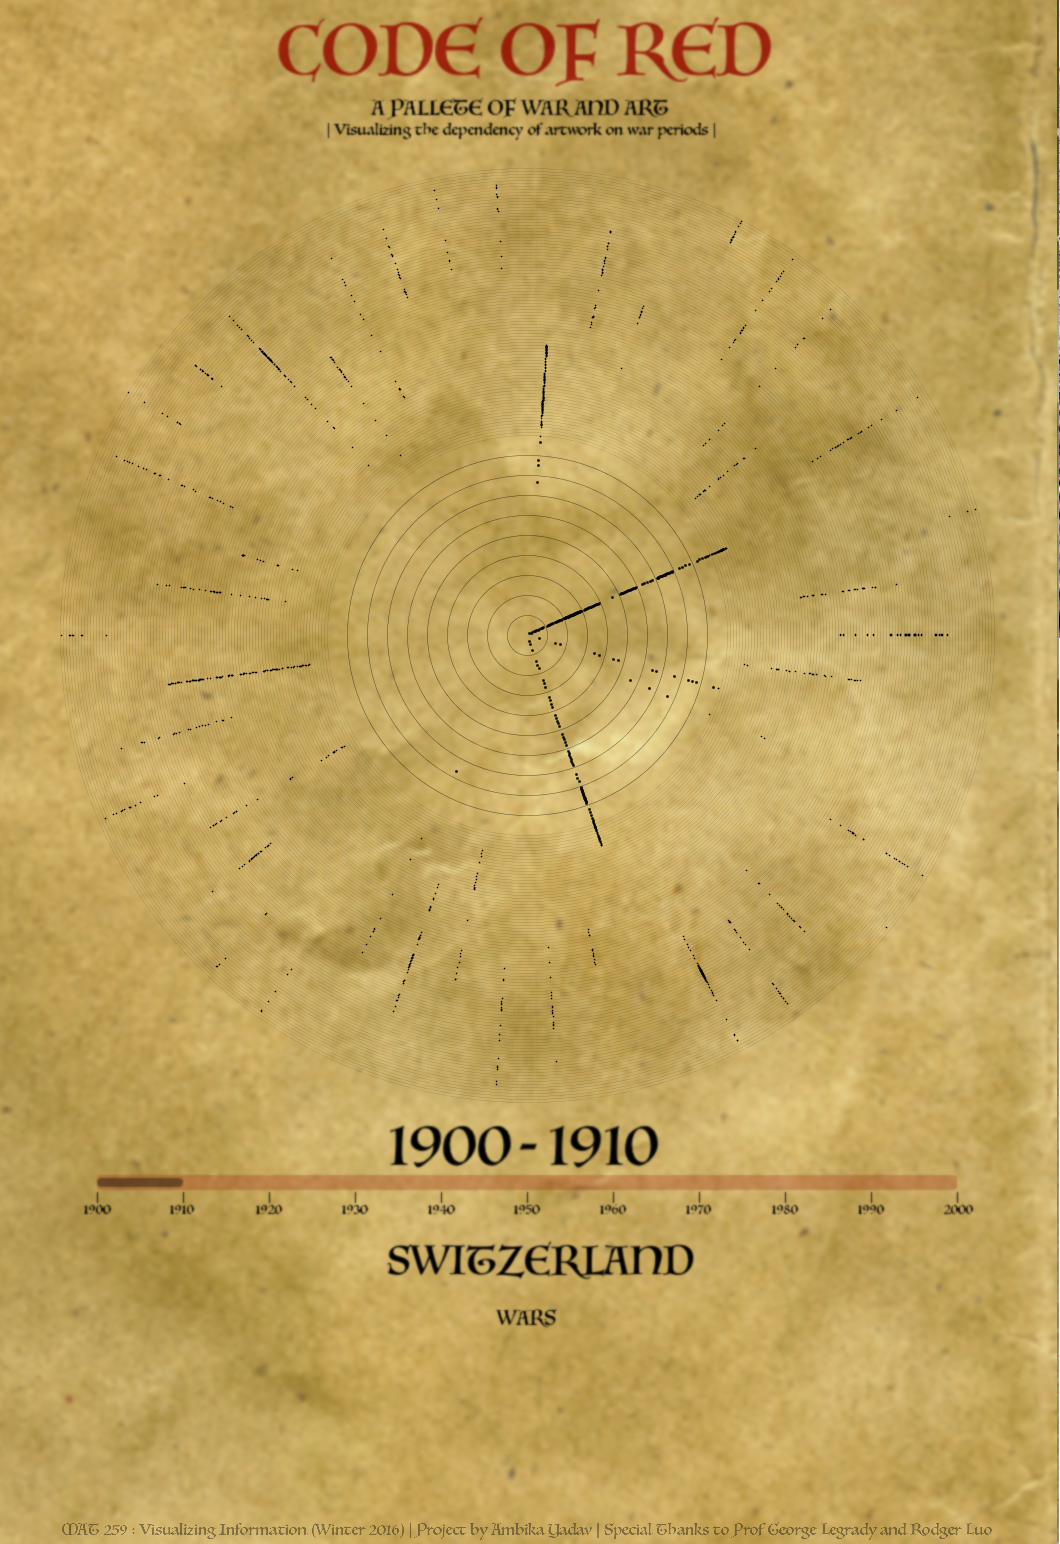
ELEMENTS OF THE VISUALISATION :
- Every year is represented by a circle. The smallest circle represents 1900 and the largest circle represents 2000. A period of 10 years can be looked into more detail in the zoomed in area. The decade which the user wants to look into, can be controlled by the scroll.
- The red coloration between circles indicates years of wars. It can be also observed that the density of redness is variable. This is because, during certain years, there is more than one war being fought.
- Every artist is represented by a imaginary line, and dots on this line tell us about the artwork completed by a particular artist in a specific year.
- The country we whose dataset we are looking into can be changed by pressing space bar.
- Finally all the wars in the years we are looking at in the zoomed in area, are listed out on the visualisation.
Code