What Is The Time?
MAT 259, 2016
Ambika Yadav
Concept
In this project I wanted to look into the density of the number of checkouts as a function on time on a daily basis. I wanted to ask the question ,whether more people are in the library in the morning hours or in the evening hours. This visualisation in someway can give an insight on how the timings of the library can be modified to make it more accesible to the people of Seattle.
Query
The SQL Query for this project was pretty straight forward ,wherein I get the number of checkouts per hour every day over the past 10 years.
SELECT
hour(Checkout) As Hour,
date(CheckOut) AS Date,
COUNT(date(CheckOut)) AS TotalCheckouts
FROM
spl3.x_transactionsExcludeNullCheckIns
GROUP BY date
ORDER BY date,hour
SELECT
hour(Checkout) As Hour,
date(CheckOut) AS Date,
COUNT(date(CheckOut)) AS TotalCheckouts
FROM
spl3.x_transactionsExcludeNullCheckIns
GROUP BY date
ORDER BY date,hour
Preliminary sketches
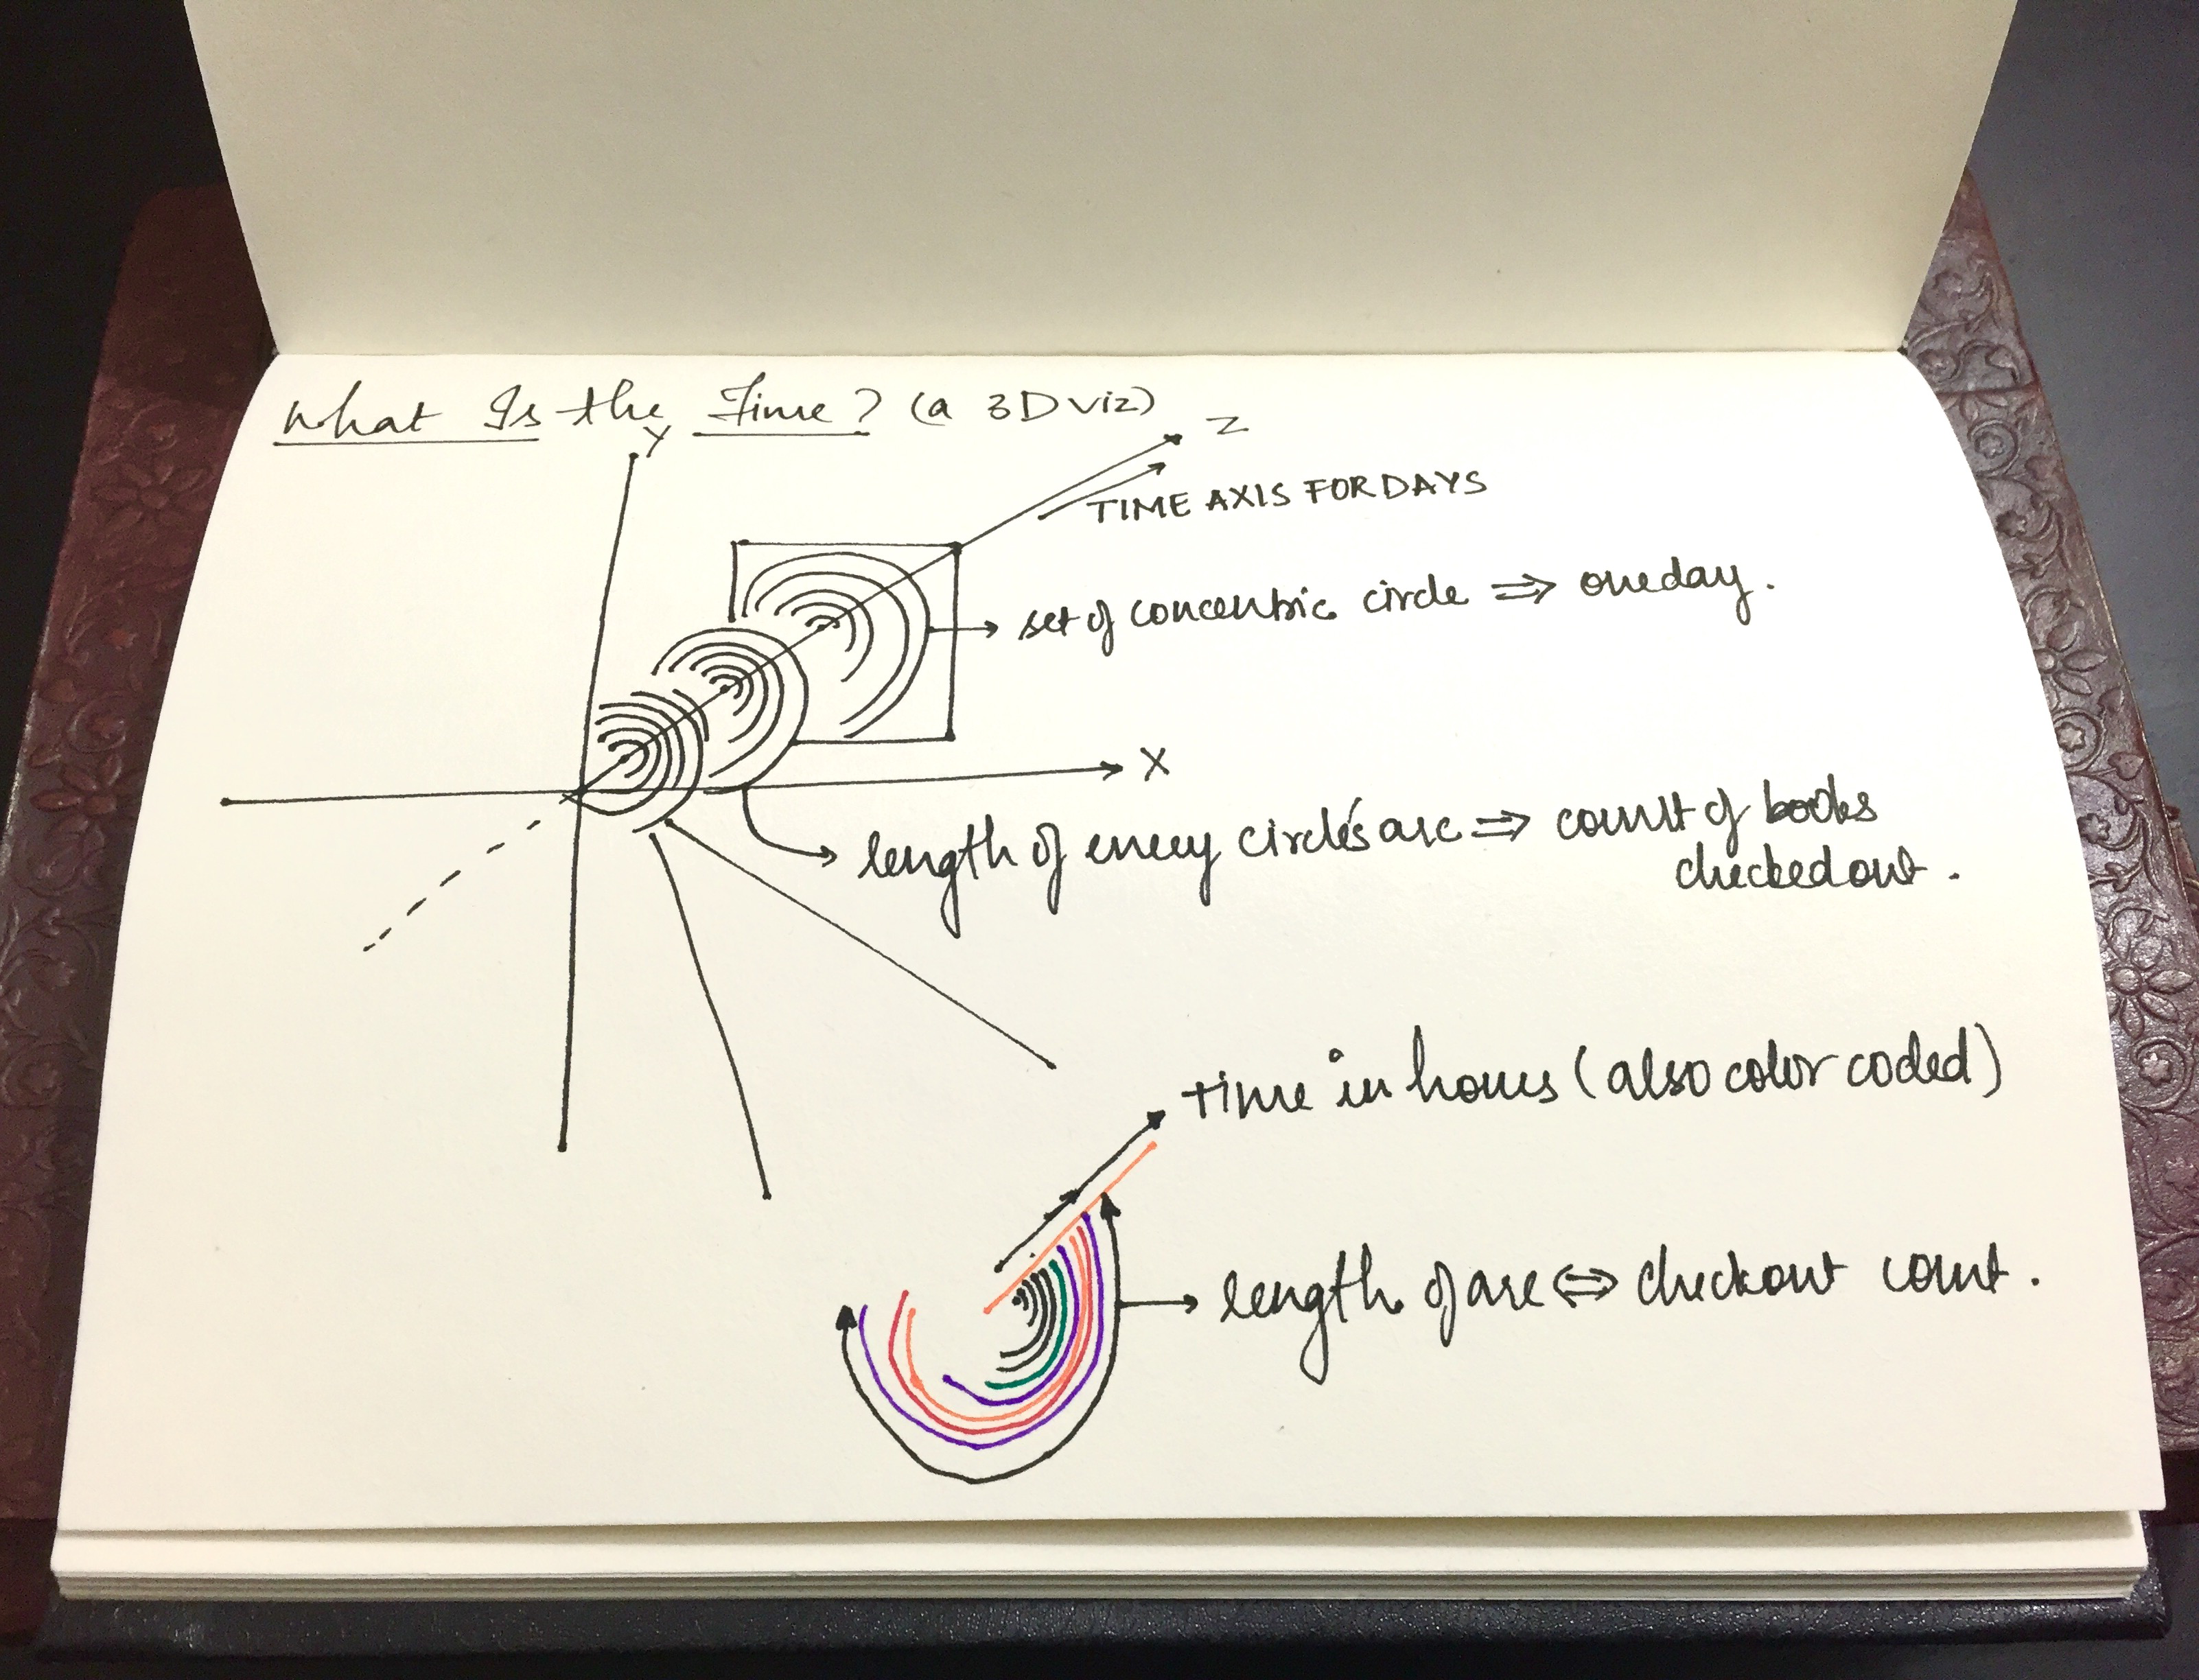
This was a 3D visualisation and utilised three axis to depict the data. I used concentric circles lined up along the z axis.
Movement along the z axis from one set of concentric circles to the next corresponded to the time in terms of days.
Every set of concentric circles correponds to one day, and as we move in the radius dimension, it corresponds to the time(hours) on a daily basis. Smallest radius correponds to midnight and the largest radius correponds to 11PM.These are color coded as well, to enhance the clarity of what time are we looking at.
Also the length of the arc correponds to the number of checkouts at that time .
Process
Choosing the right colors was a major challenge in this projects, as the different time durations could be very confusing and not be comprehended easily.
Colors of different hues against a black background looked like a good set of colors to make the data more understandable.
Colors of different hues against a black background looked like a good set of colors to make the data more understandable.
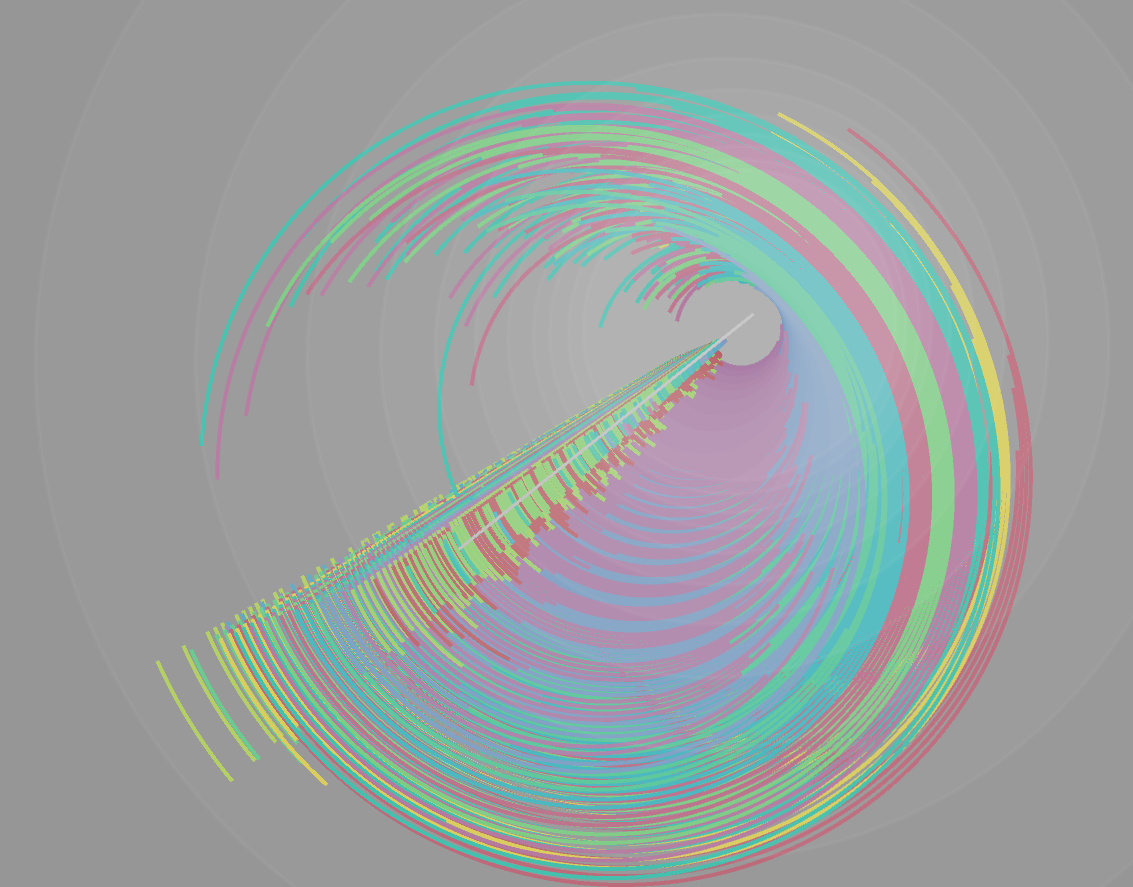
Final result
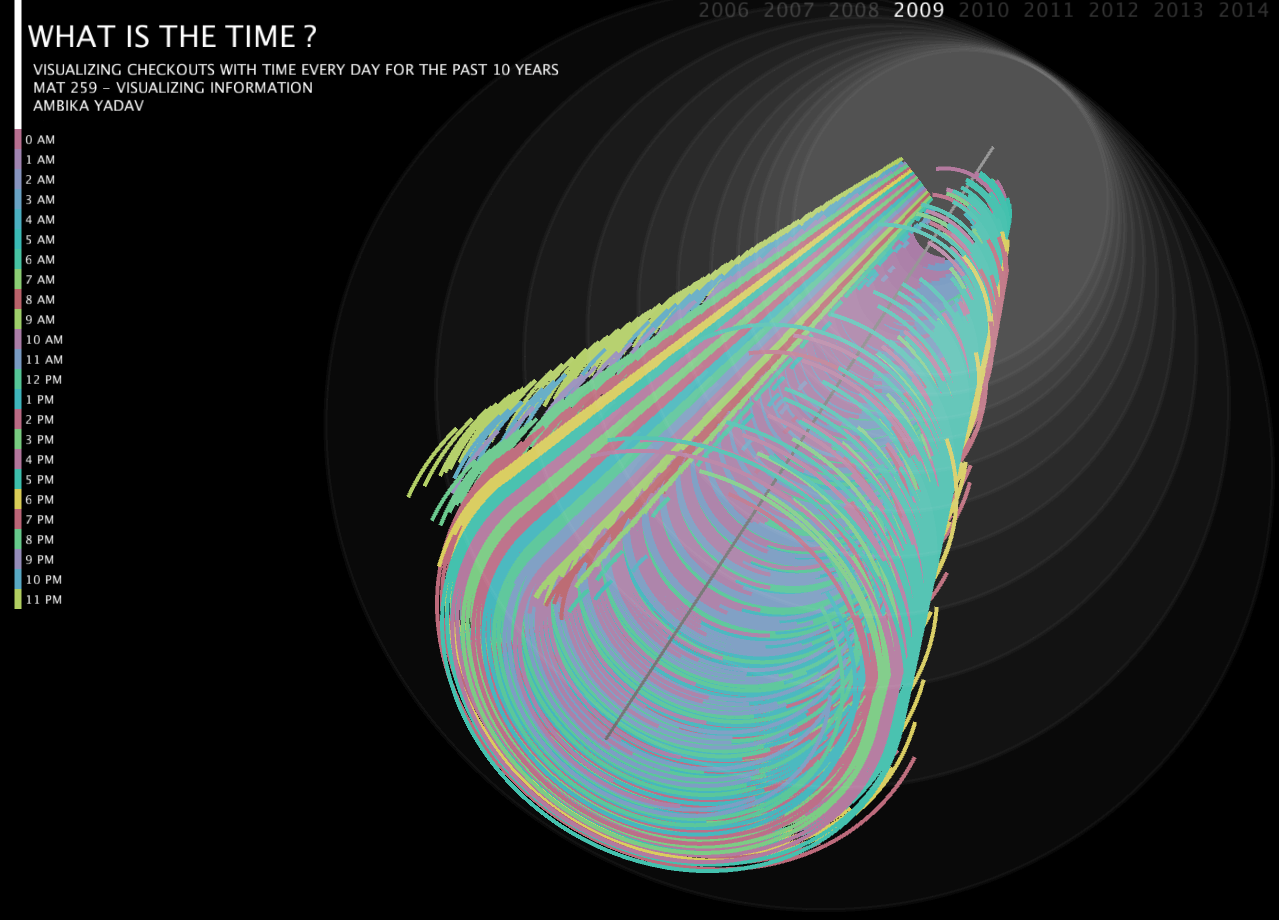
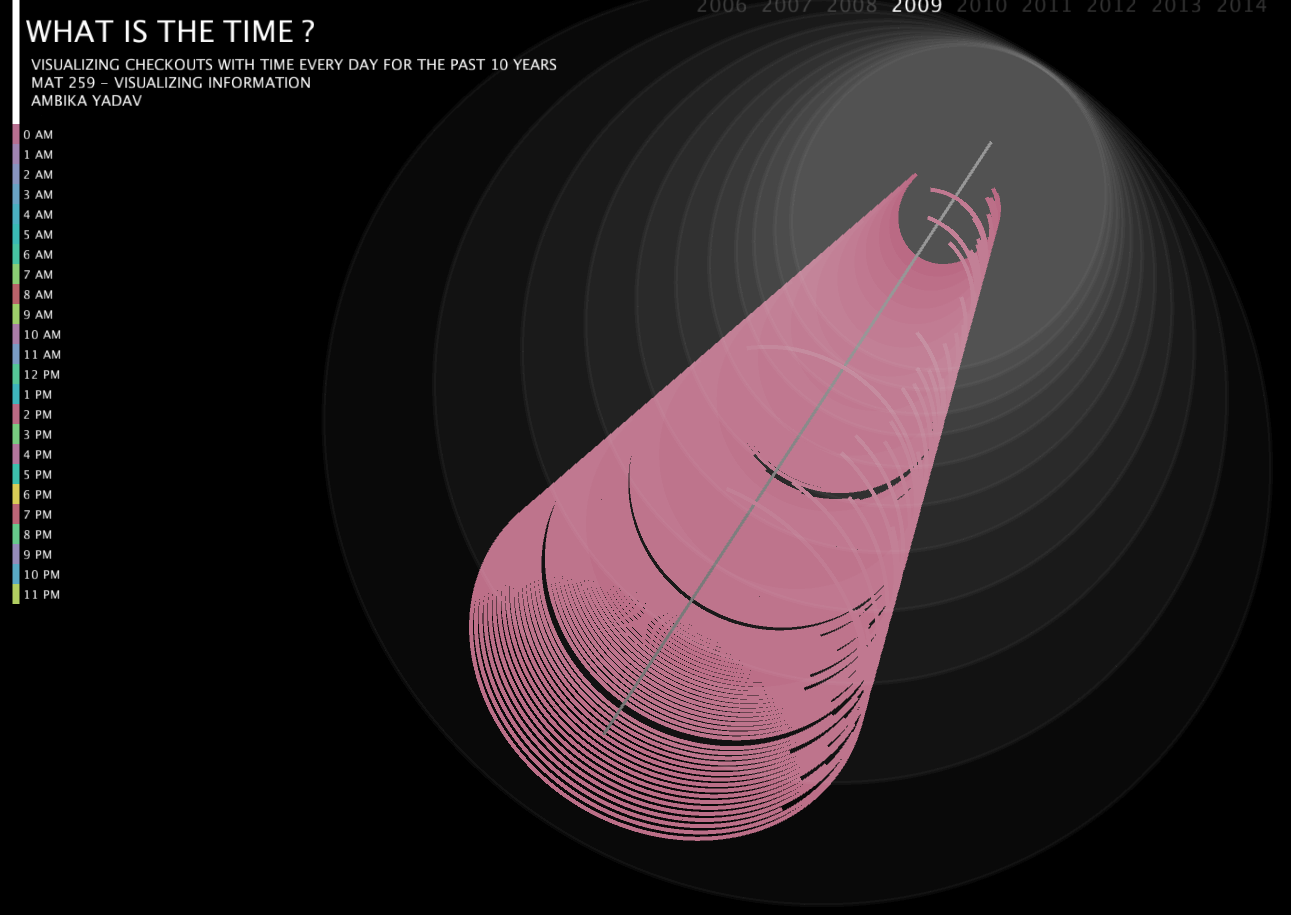
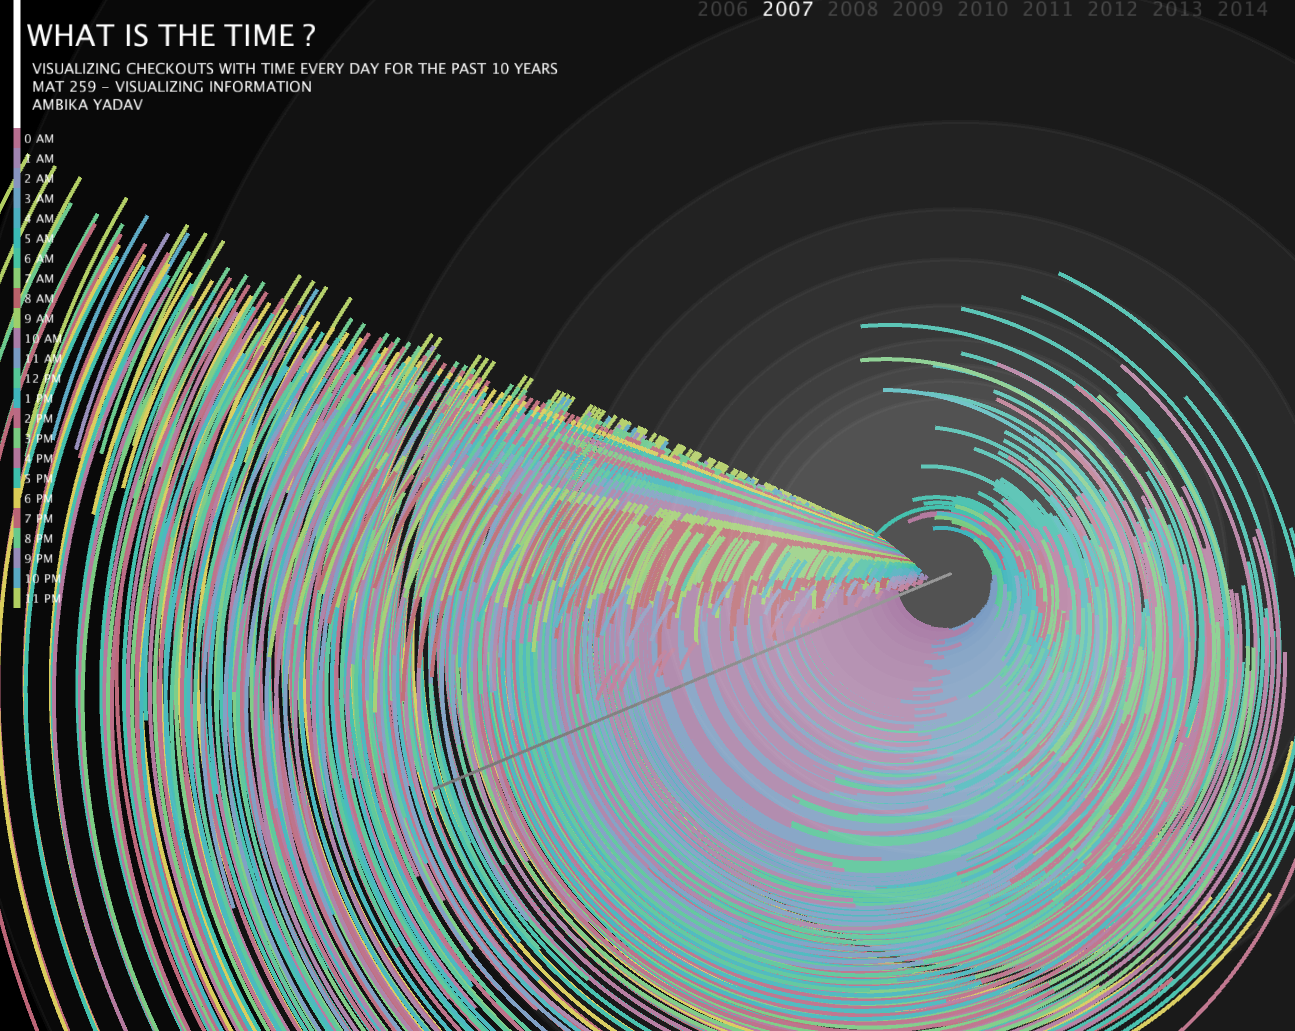
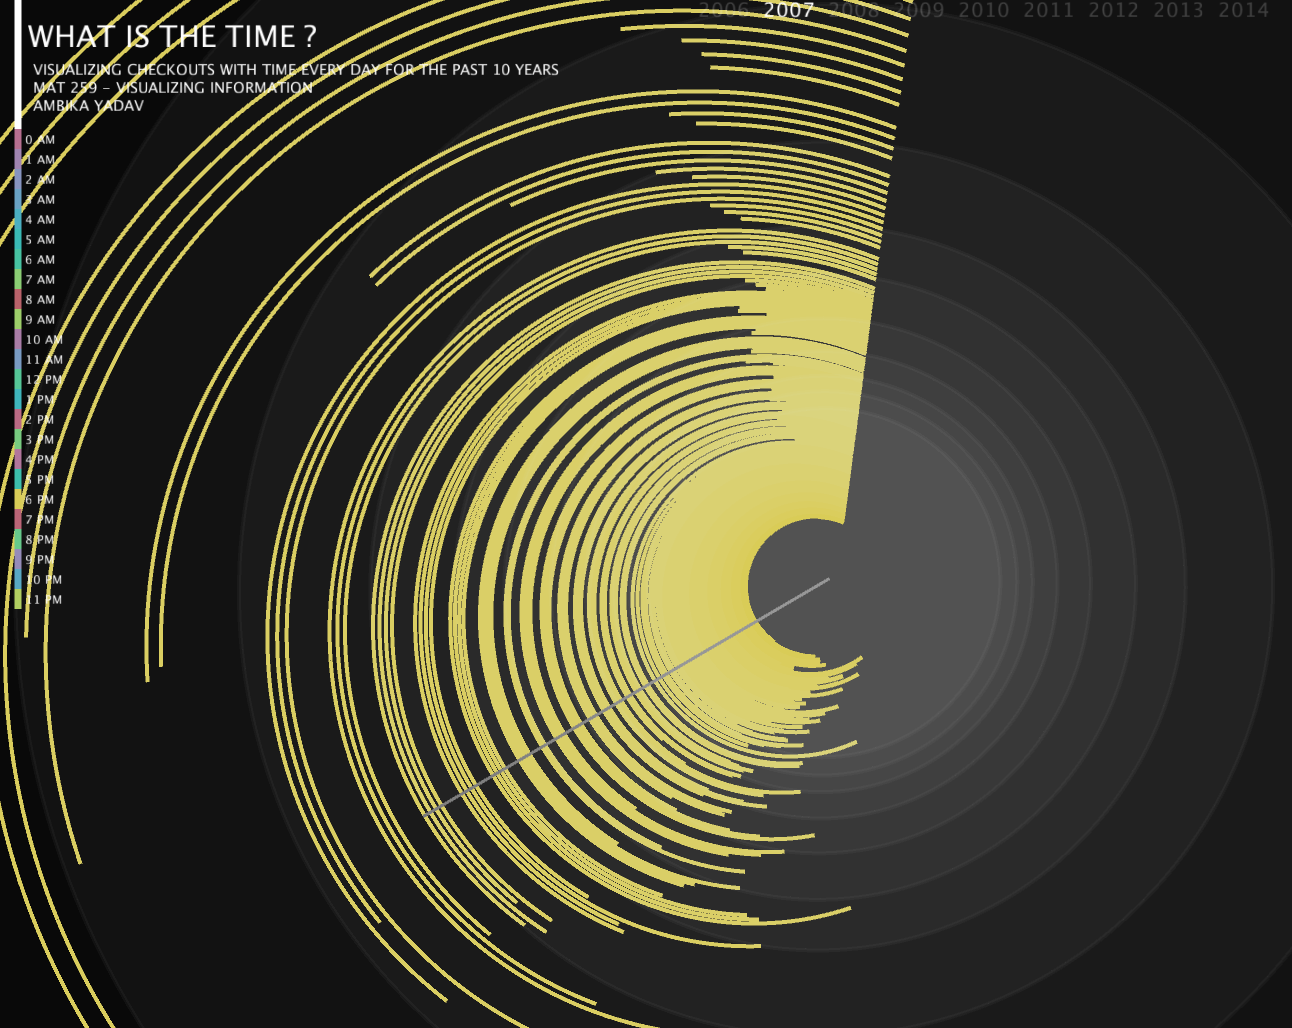
The user of data visualizer can interact with the visualisation to look into data for different years and analyse the checkouts for particular hours of the everyday.
YEAR INTERACTION
The keys 1 - 9 on the keyboard navigates the user through years 2006-2015.
TIME INTERACTION
Scrolling the mouse over the time index ,helped the user visualise the checkouts for different times over the years.
PEASY CAM INTERACTION
Mouse is used for the peasy interaction ,to look into data in detail.
Code