How Reading Preferences of Books about Sports in the Library Varies with Time
MAT 259, 2016
Junxiang Yao
Concept
In this project, I used the dataset of sports related books from Seattle Public Library. I want to find if there is any particular pattern that can display that field of data was impact by some kinds of factors, like world wide sports events, weather, climate, politic reasons, geographical reasons and so on.
In the 2D matrix, I want to highlight the differences not only in each fields, but also between each fields.I want to bring out the differences by organizing the layout of the whole image.
Query
SELECT YEAR(checkout) AS Year,MONTH(checkout) AS Month,

SUM(CASE

WHEN deweyClass >= 796.323 AND deweyClass < 796.324 Then 1

ELSE 0 END) AS 'Basketball',

SUM(CASE

WHEN deweyClass >= 796.325 AND deweyClass < 796.326 Then 1

ELSE 0 END) AS 'Volleyball',

SUM(CASE

WHEN deweyClass >= 796.33 AND deweyClass < 796.34 Then 1

ELSE 0 END) AS 'Football',

SUM(CASE

WHEN deweyClass >= 796.342 AND deweyClass < 796.343 Then 1

ELSE 0 END) AS 'Tennis',

SUM(CASE

WHEN deweyClass >= 796.346 AND deweyClass < 796.347 Then 1

ELSE 0 END) AS 'Table Tennis',

SUM(CASE

WHEN deweyClass >= 796.352 AND deweyClass < 796.353 Then 1

ELSE 0 END) AS 'Golf',

SUM(CASE

WHEN deweyClass >= 796.357 AND deweyClass < 796.358 Then 1

ELSE 0 END) AS 'Baseball',

SUM(CASE

WHEN deweyClass >= 796.4 AND deweyClass < 796.5 Then 1

ELSE 0 END) AS 'Weight Lifting,Track&Field, Gymnastics',

SUM(CASE

WHEN deweyClass >= 796.6 AND deweyClass < 796.7 Then 1

ELSE 0 END) AS 'Cycling',

SUM(CASE

WHEN deweyClass >= 796.7 AND deweyClass < 796.8 Then 1

ELSE 0 END) AS 'Motor',

SUM(CASE

WHEN deweyClass >= 796.8 AND deweyClass < 796.9 Then 1

ELSE 0 END) AS 'Combat',

SUM(CASE

WHEN deweyClass >= 796.9 AND deweyClass < 797 Then 1

ELSE 0 END) AS 'Ice&Snow',

SUM(CASE

WHEN deweyClass >= 797.1 AND deweyClass < 797.2 Then 1

ELSE 0 END) AS 'Boating',

SUM(CASE

WHEN deweyClass >= 797.2 AND deweyClass < 797.3 Then 1

ELSE 0 END) AS 'Swimming & Diving',

FROM spl3._rawXmlDataCheckOuts

WHERE

itemtype = 'acbk'

AND YEAR(checkOut) >= '2006'

AND YEAR(checkOut) < '2015'

GROUP BY  MONTH(checkOut),

YEAR(checkOut)

ORDER BY YEAR(checkOut)  , MONTH(checkOut)
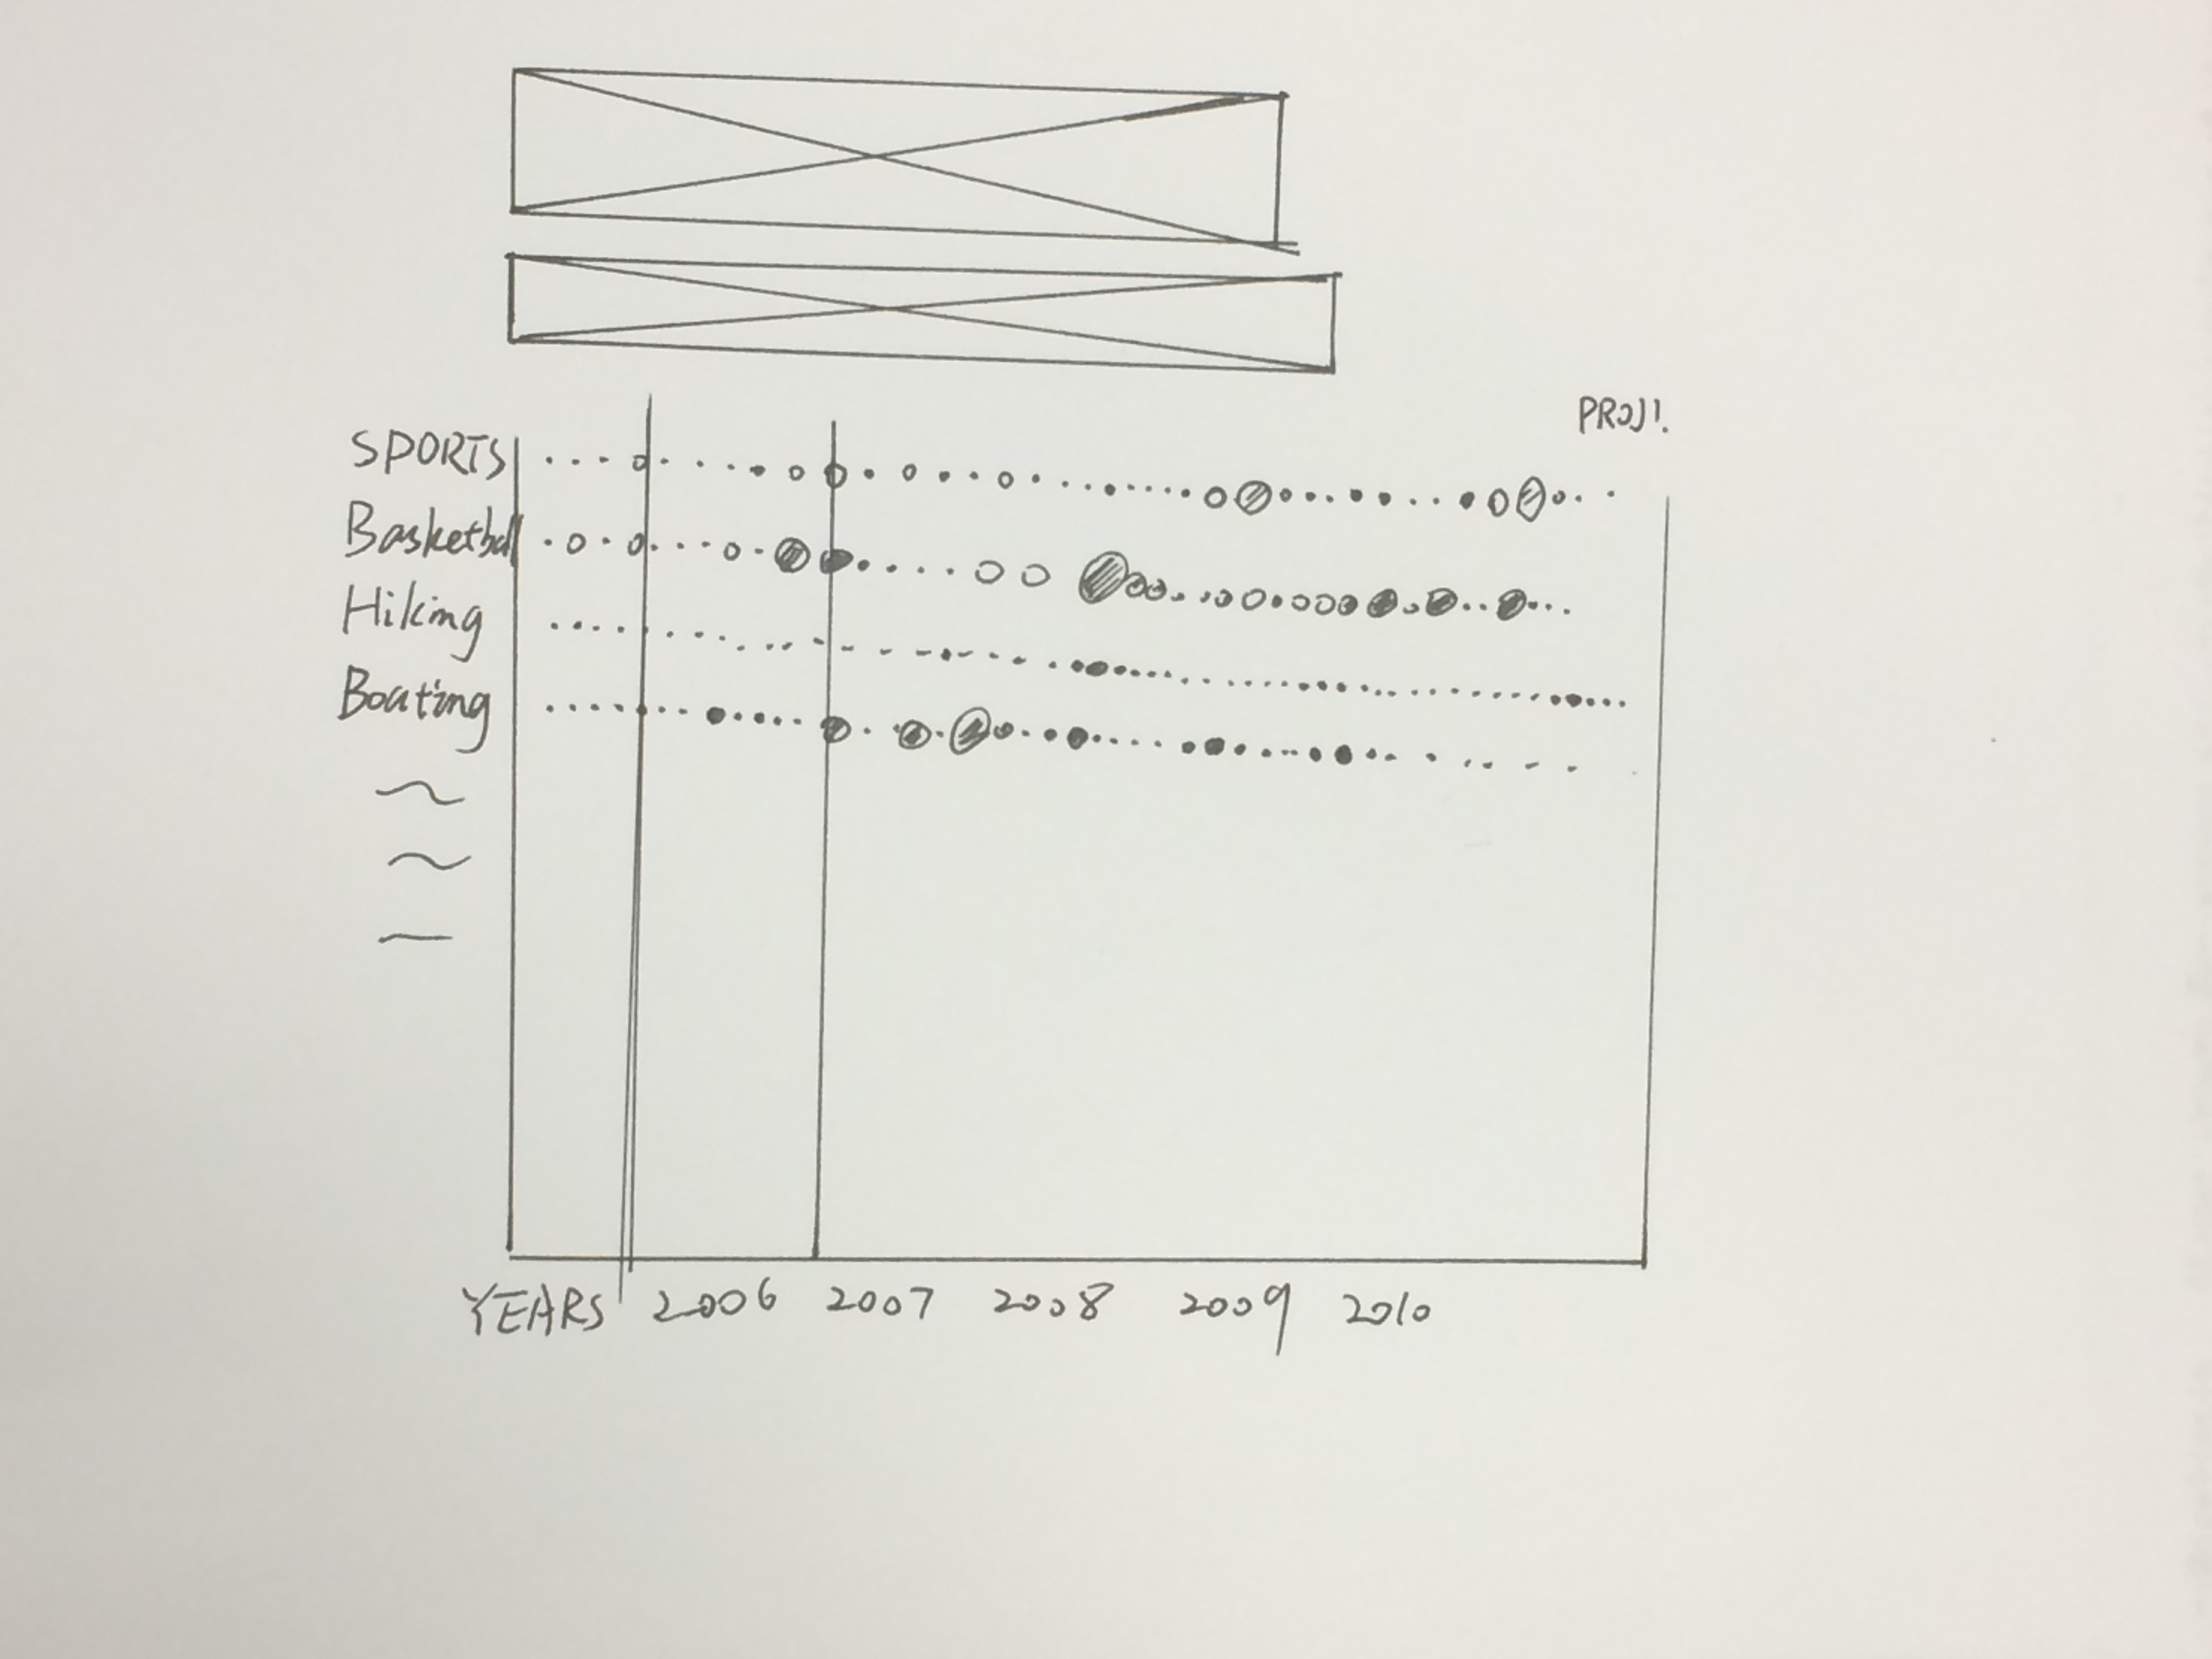
Preliminary sketches
At the beginning, I tried severl new form, like using circle instead of rectangle, to present the dataset.
Recalling the phrase "form follows function," I decided to focus on the function. My goal is to make the data easy to read and pleasing to the eye.
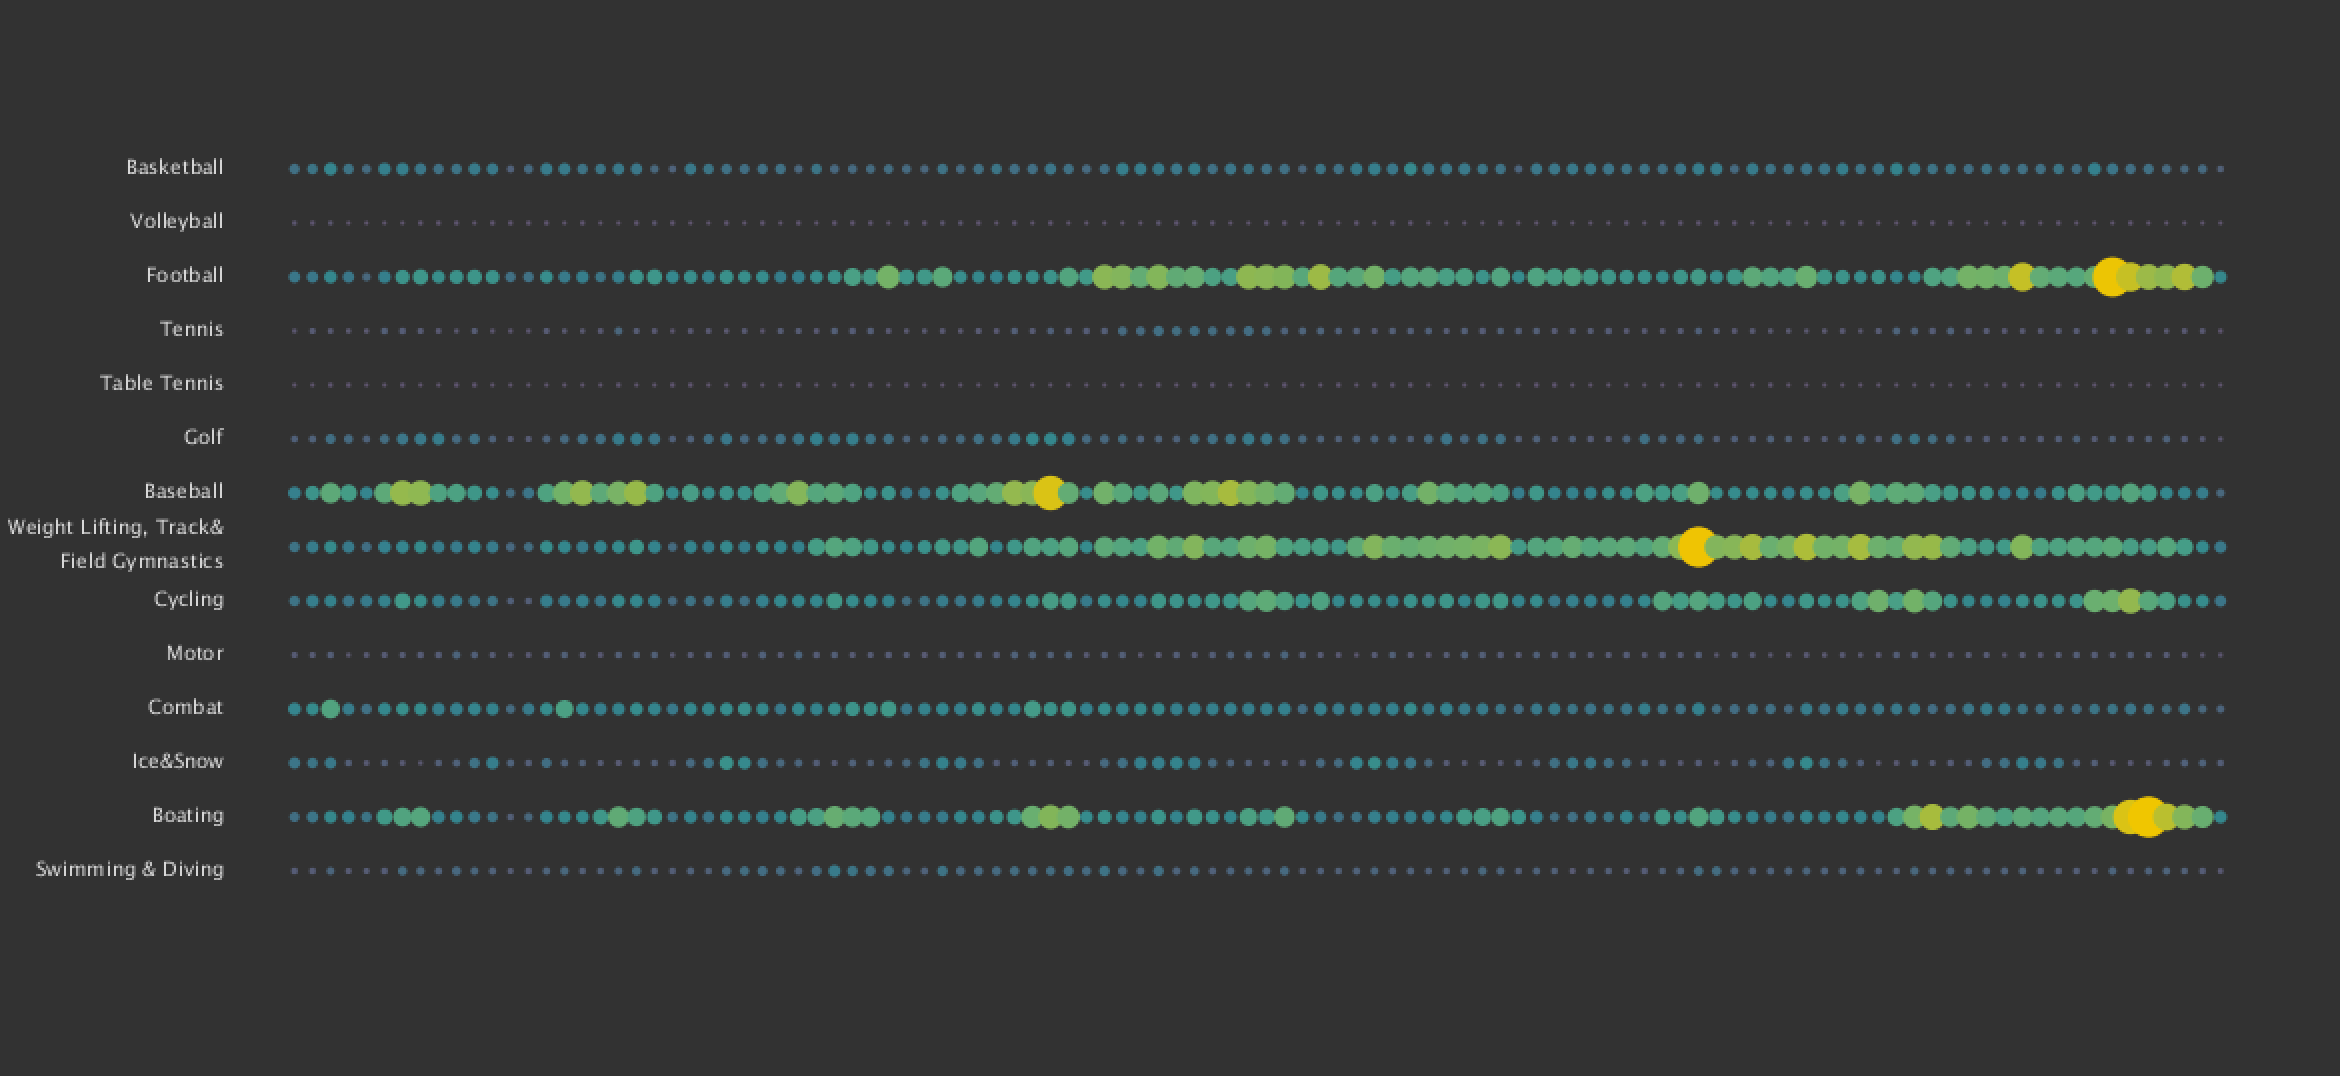
Process
I chose the color scheme and generated the data dots first. Next, I added more effects based on the 2d matrix.
Final result
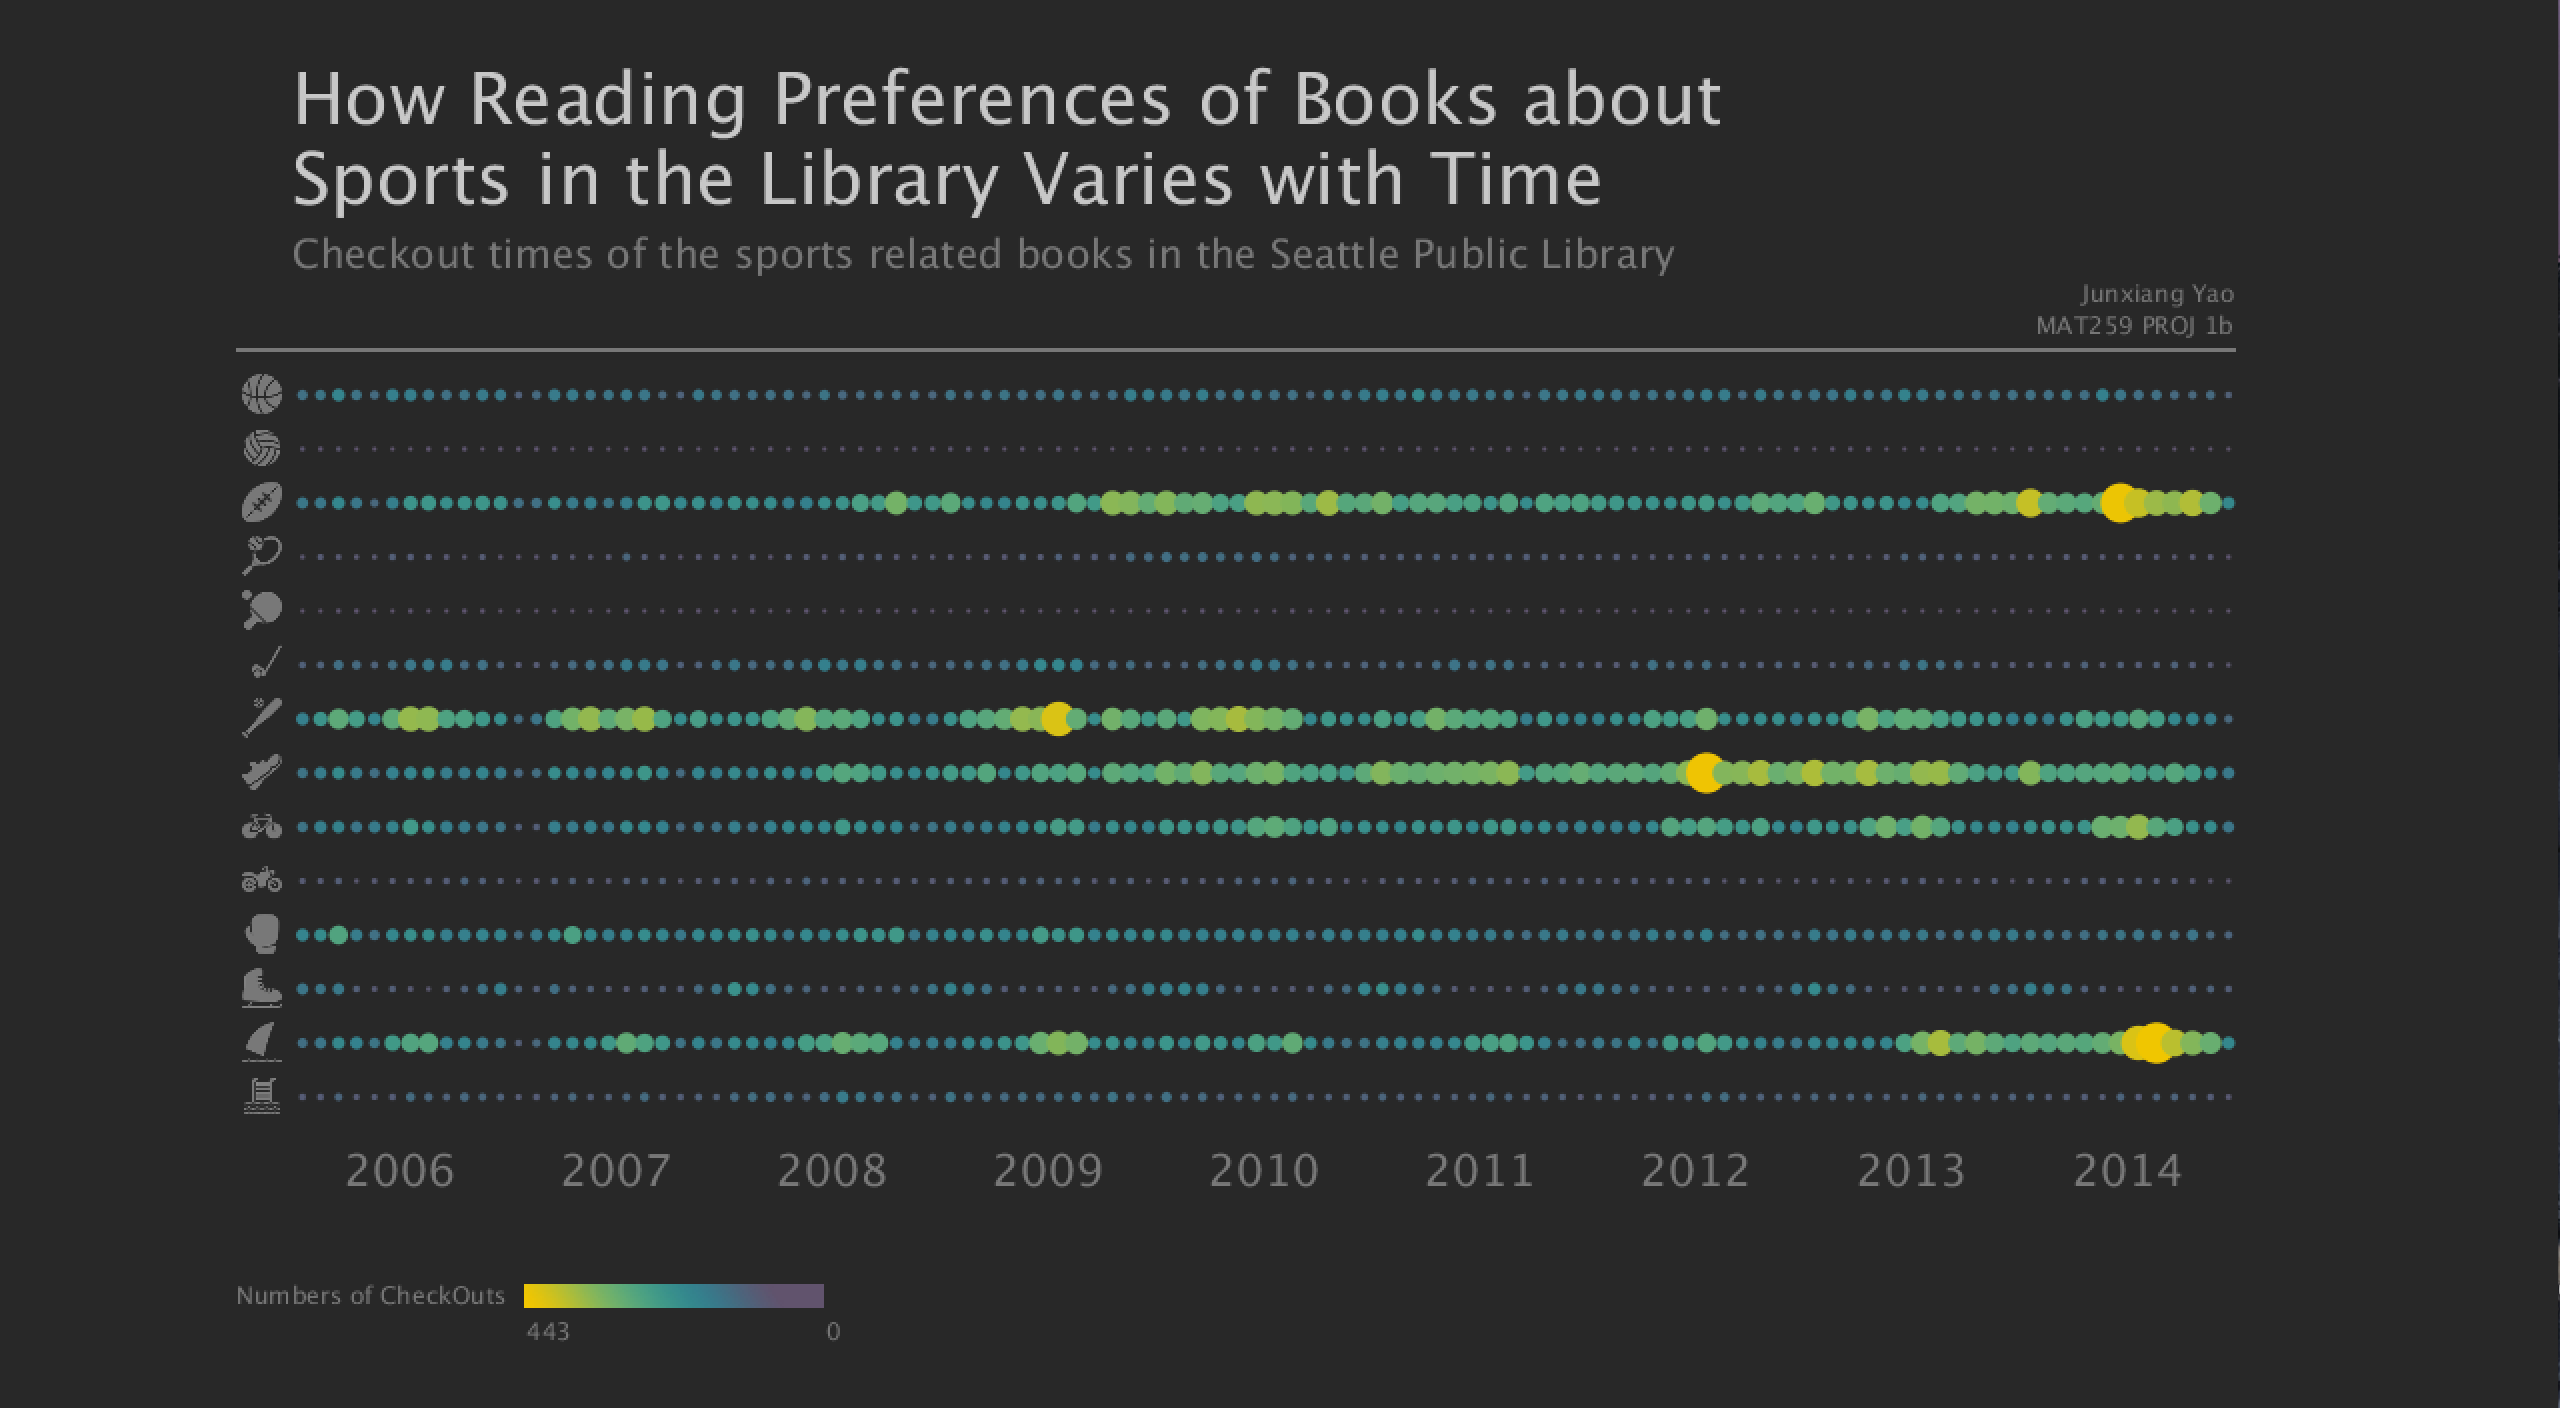
To foil the main body, I used different shades of grey to demonstrate the title, graphics that are not displaying data and other information that are not included in the main data chart.
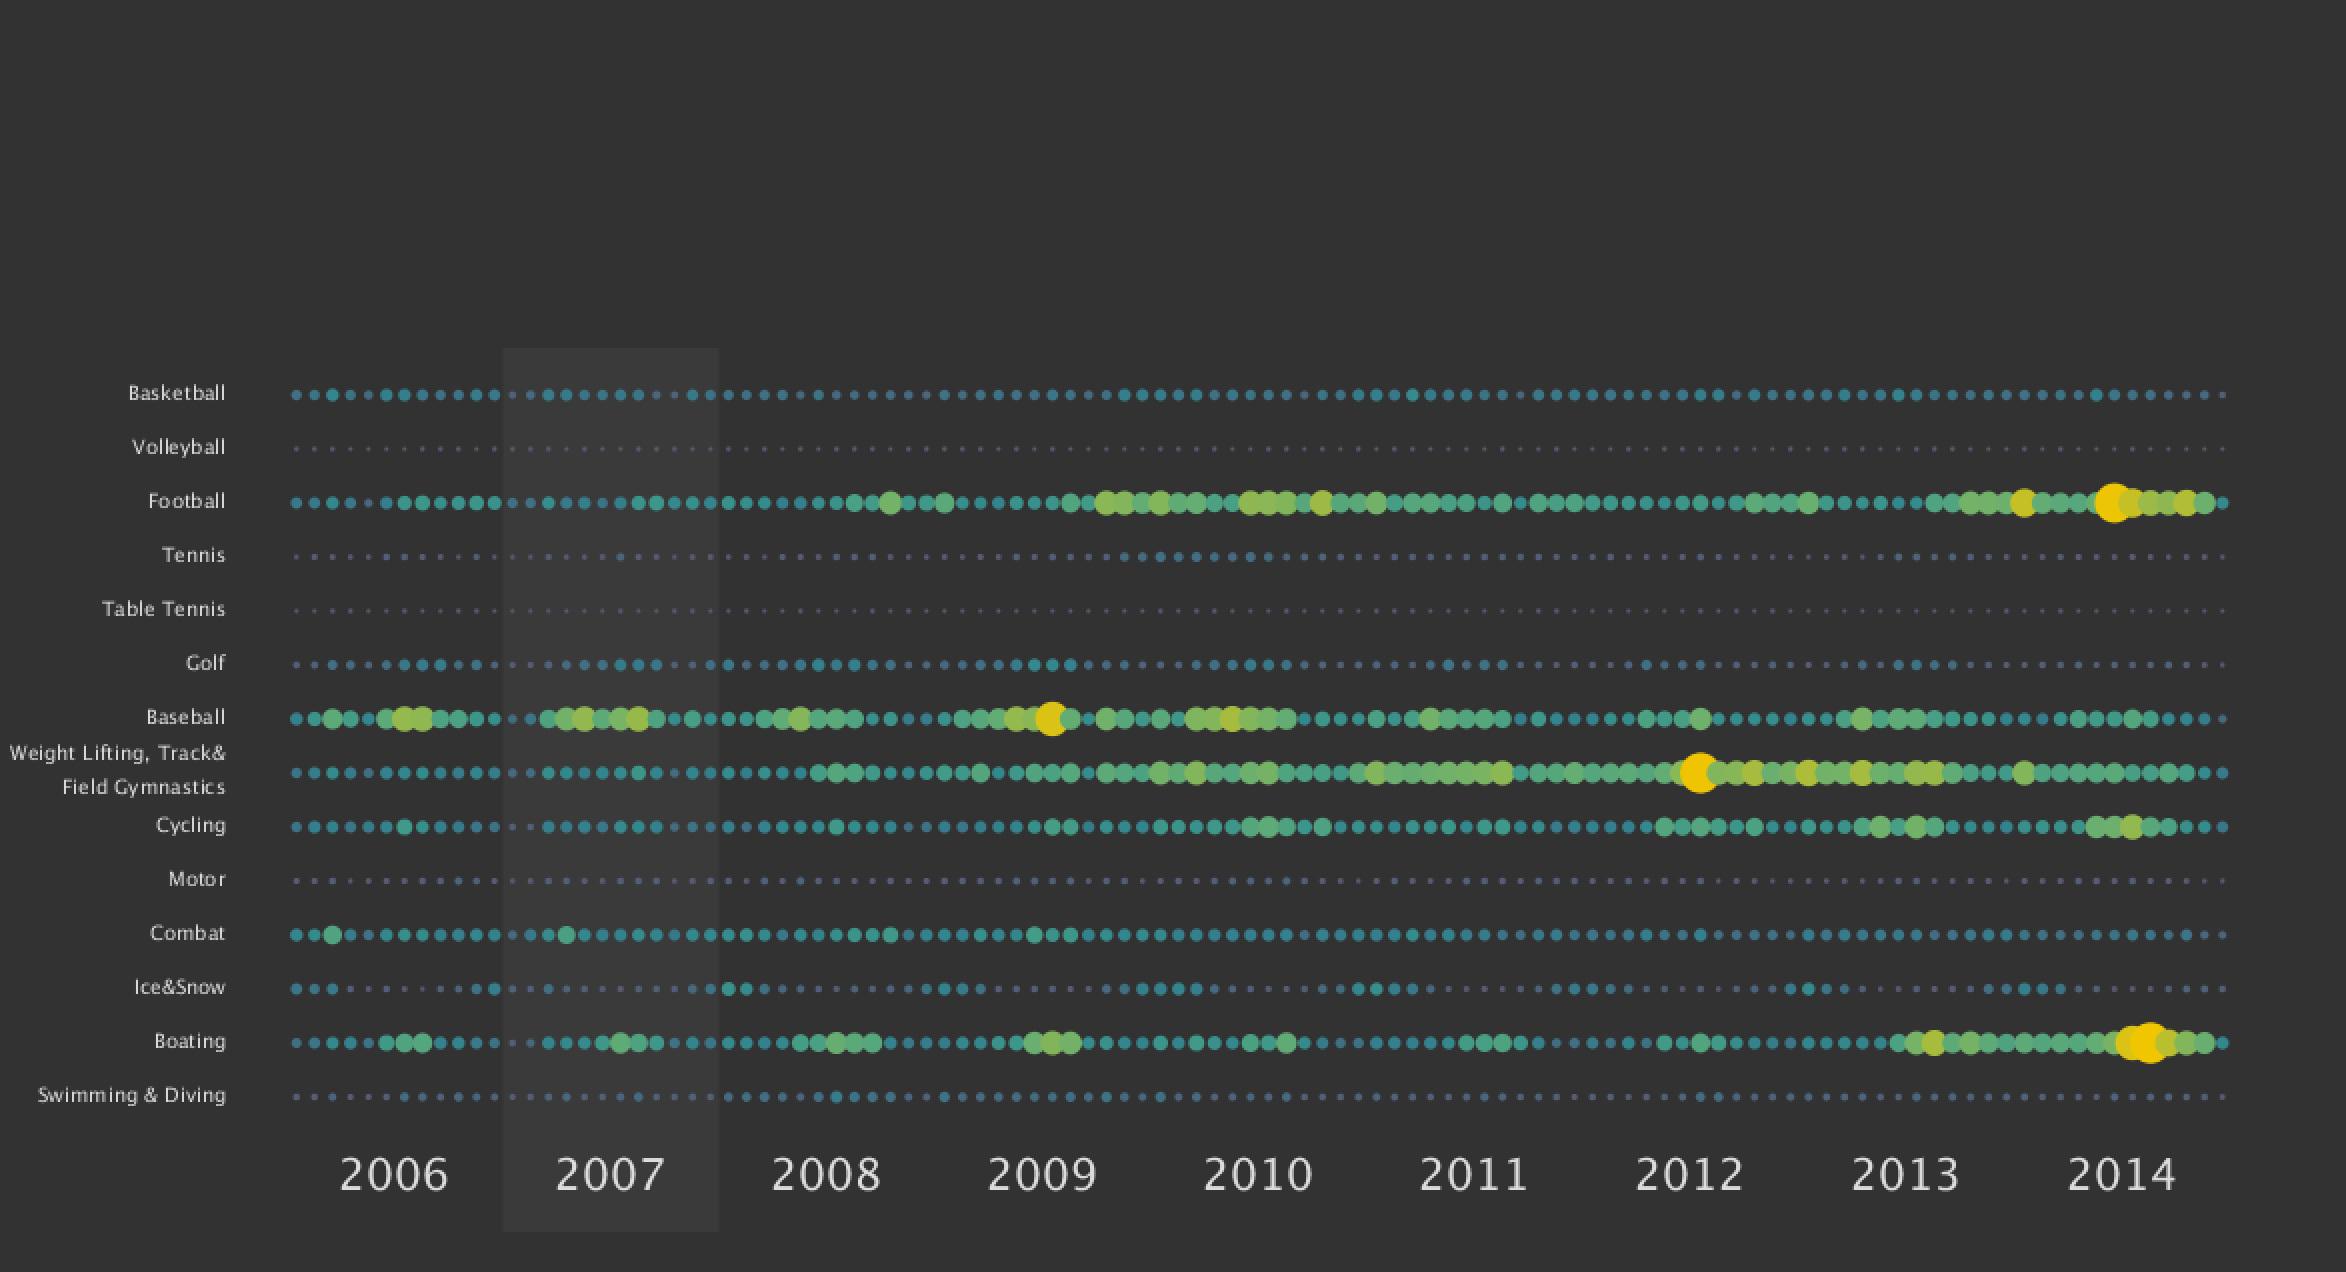
I used the grid system while designing the layout.
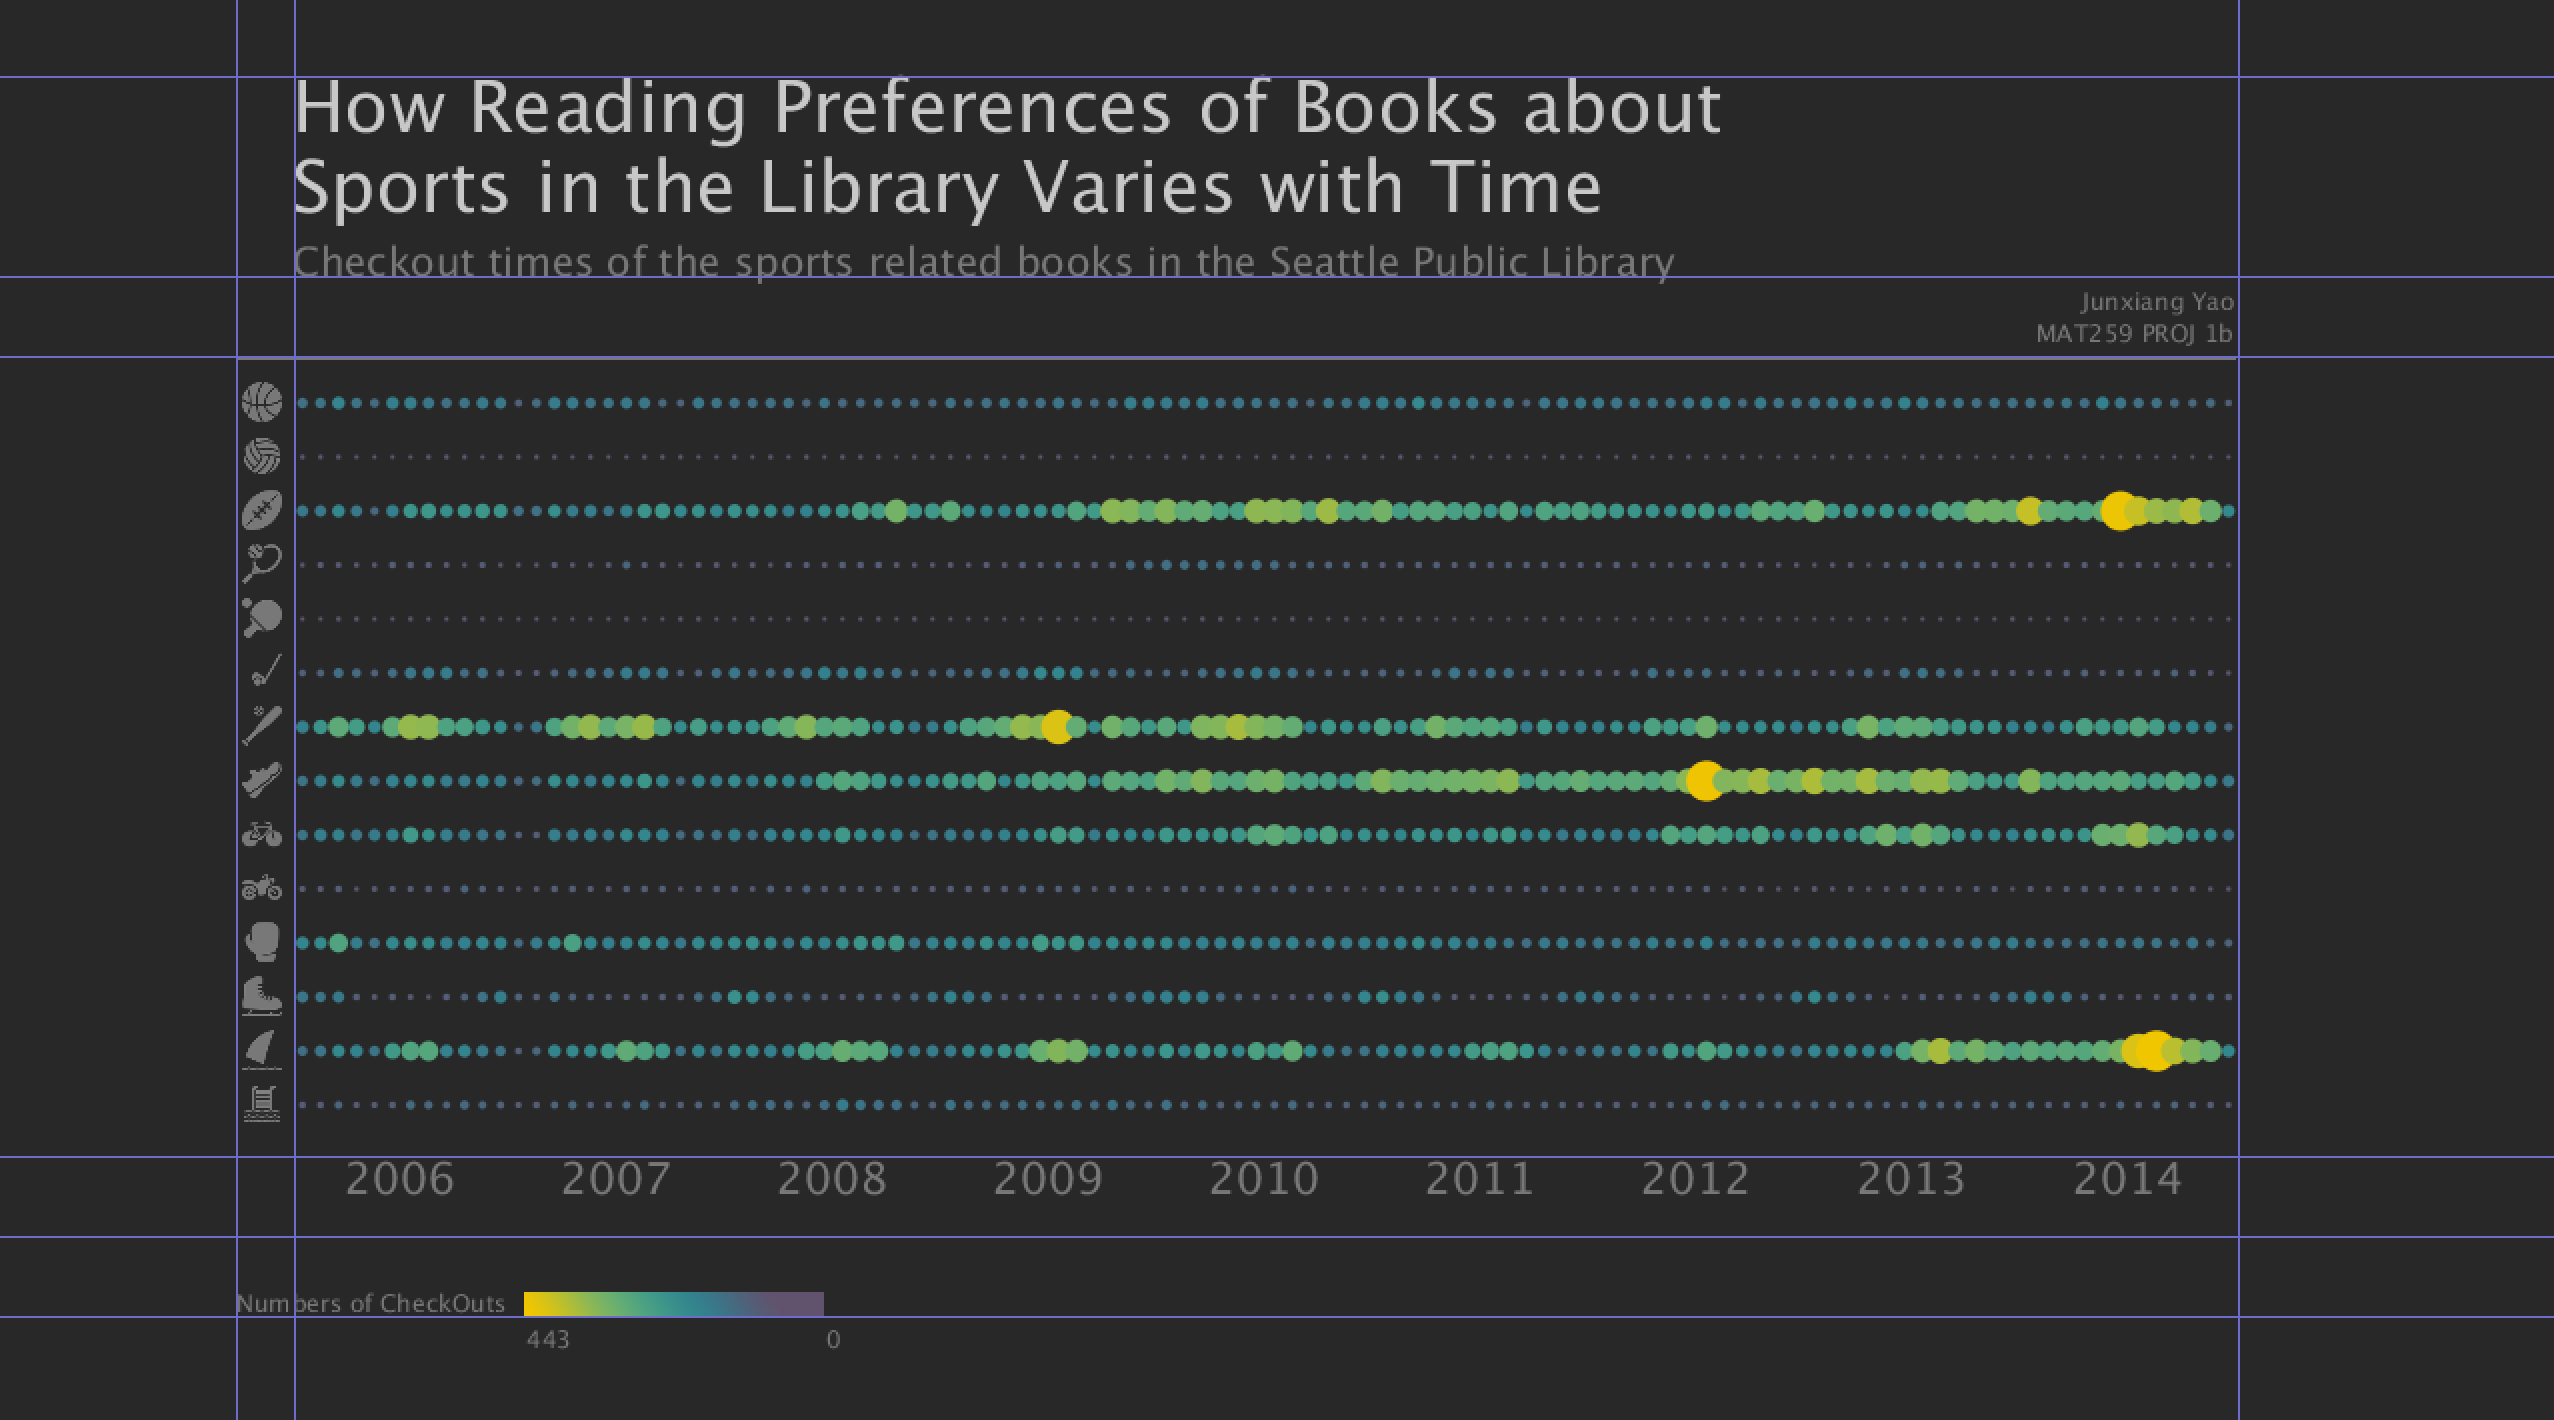
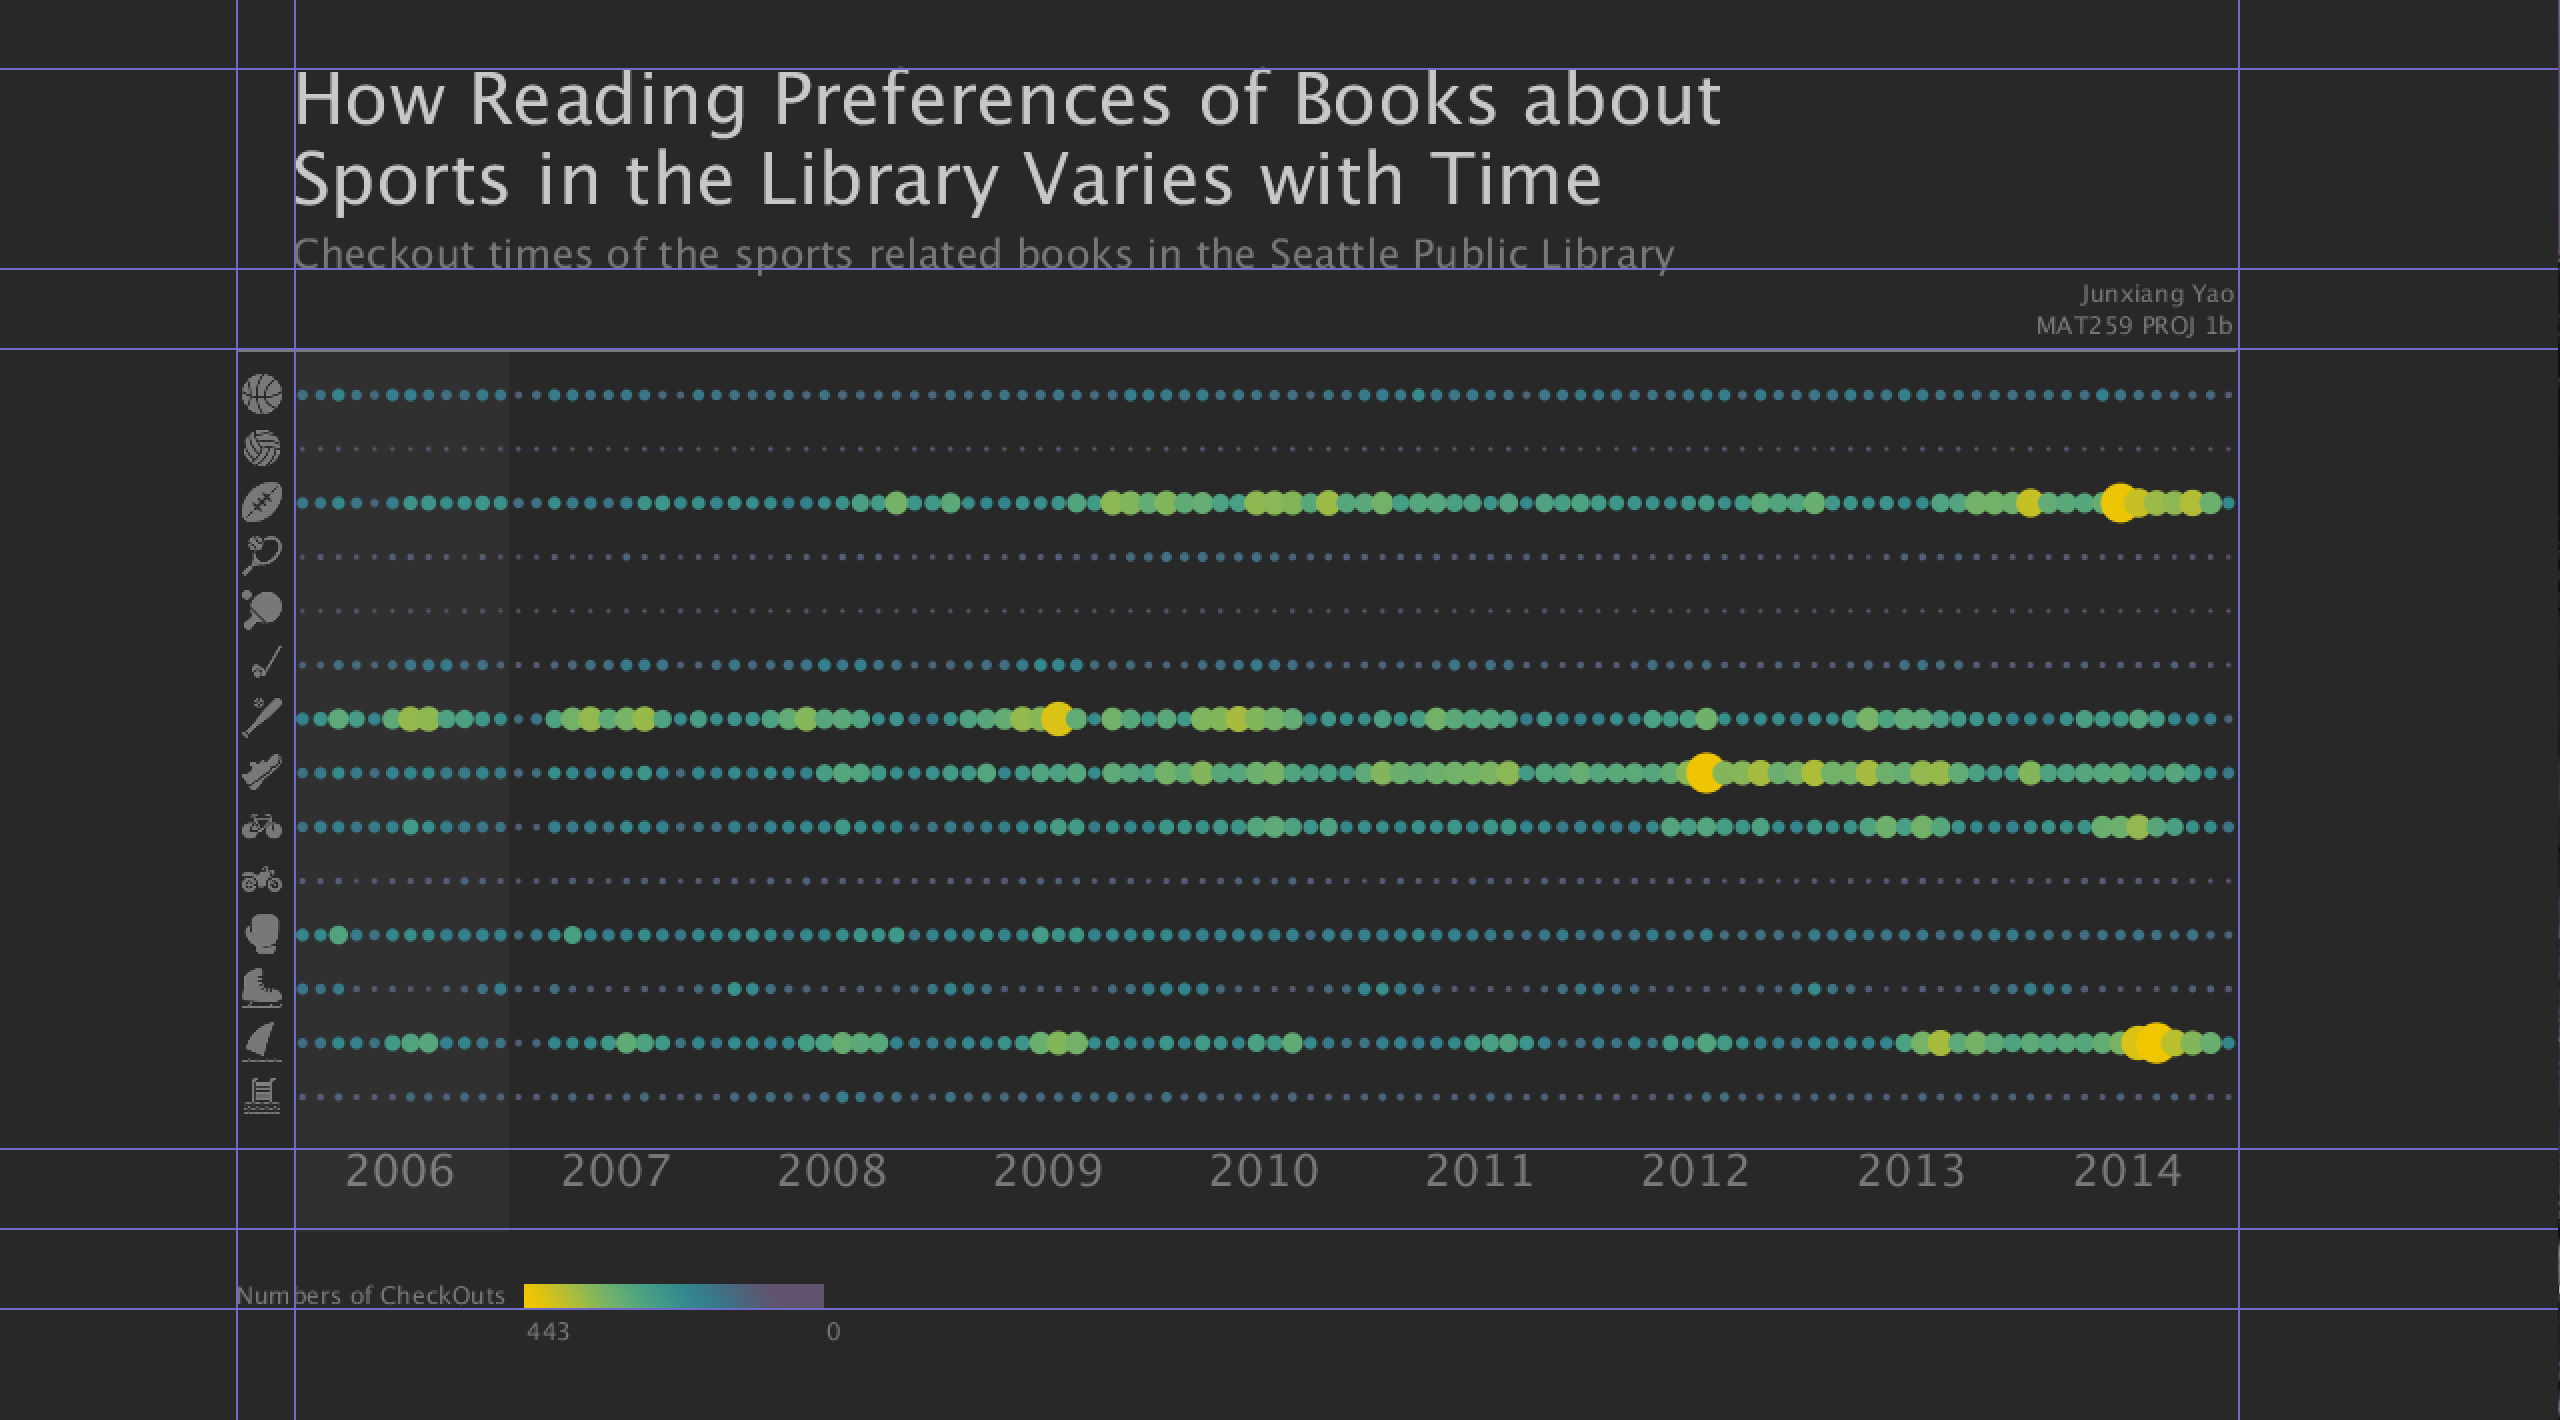
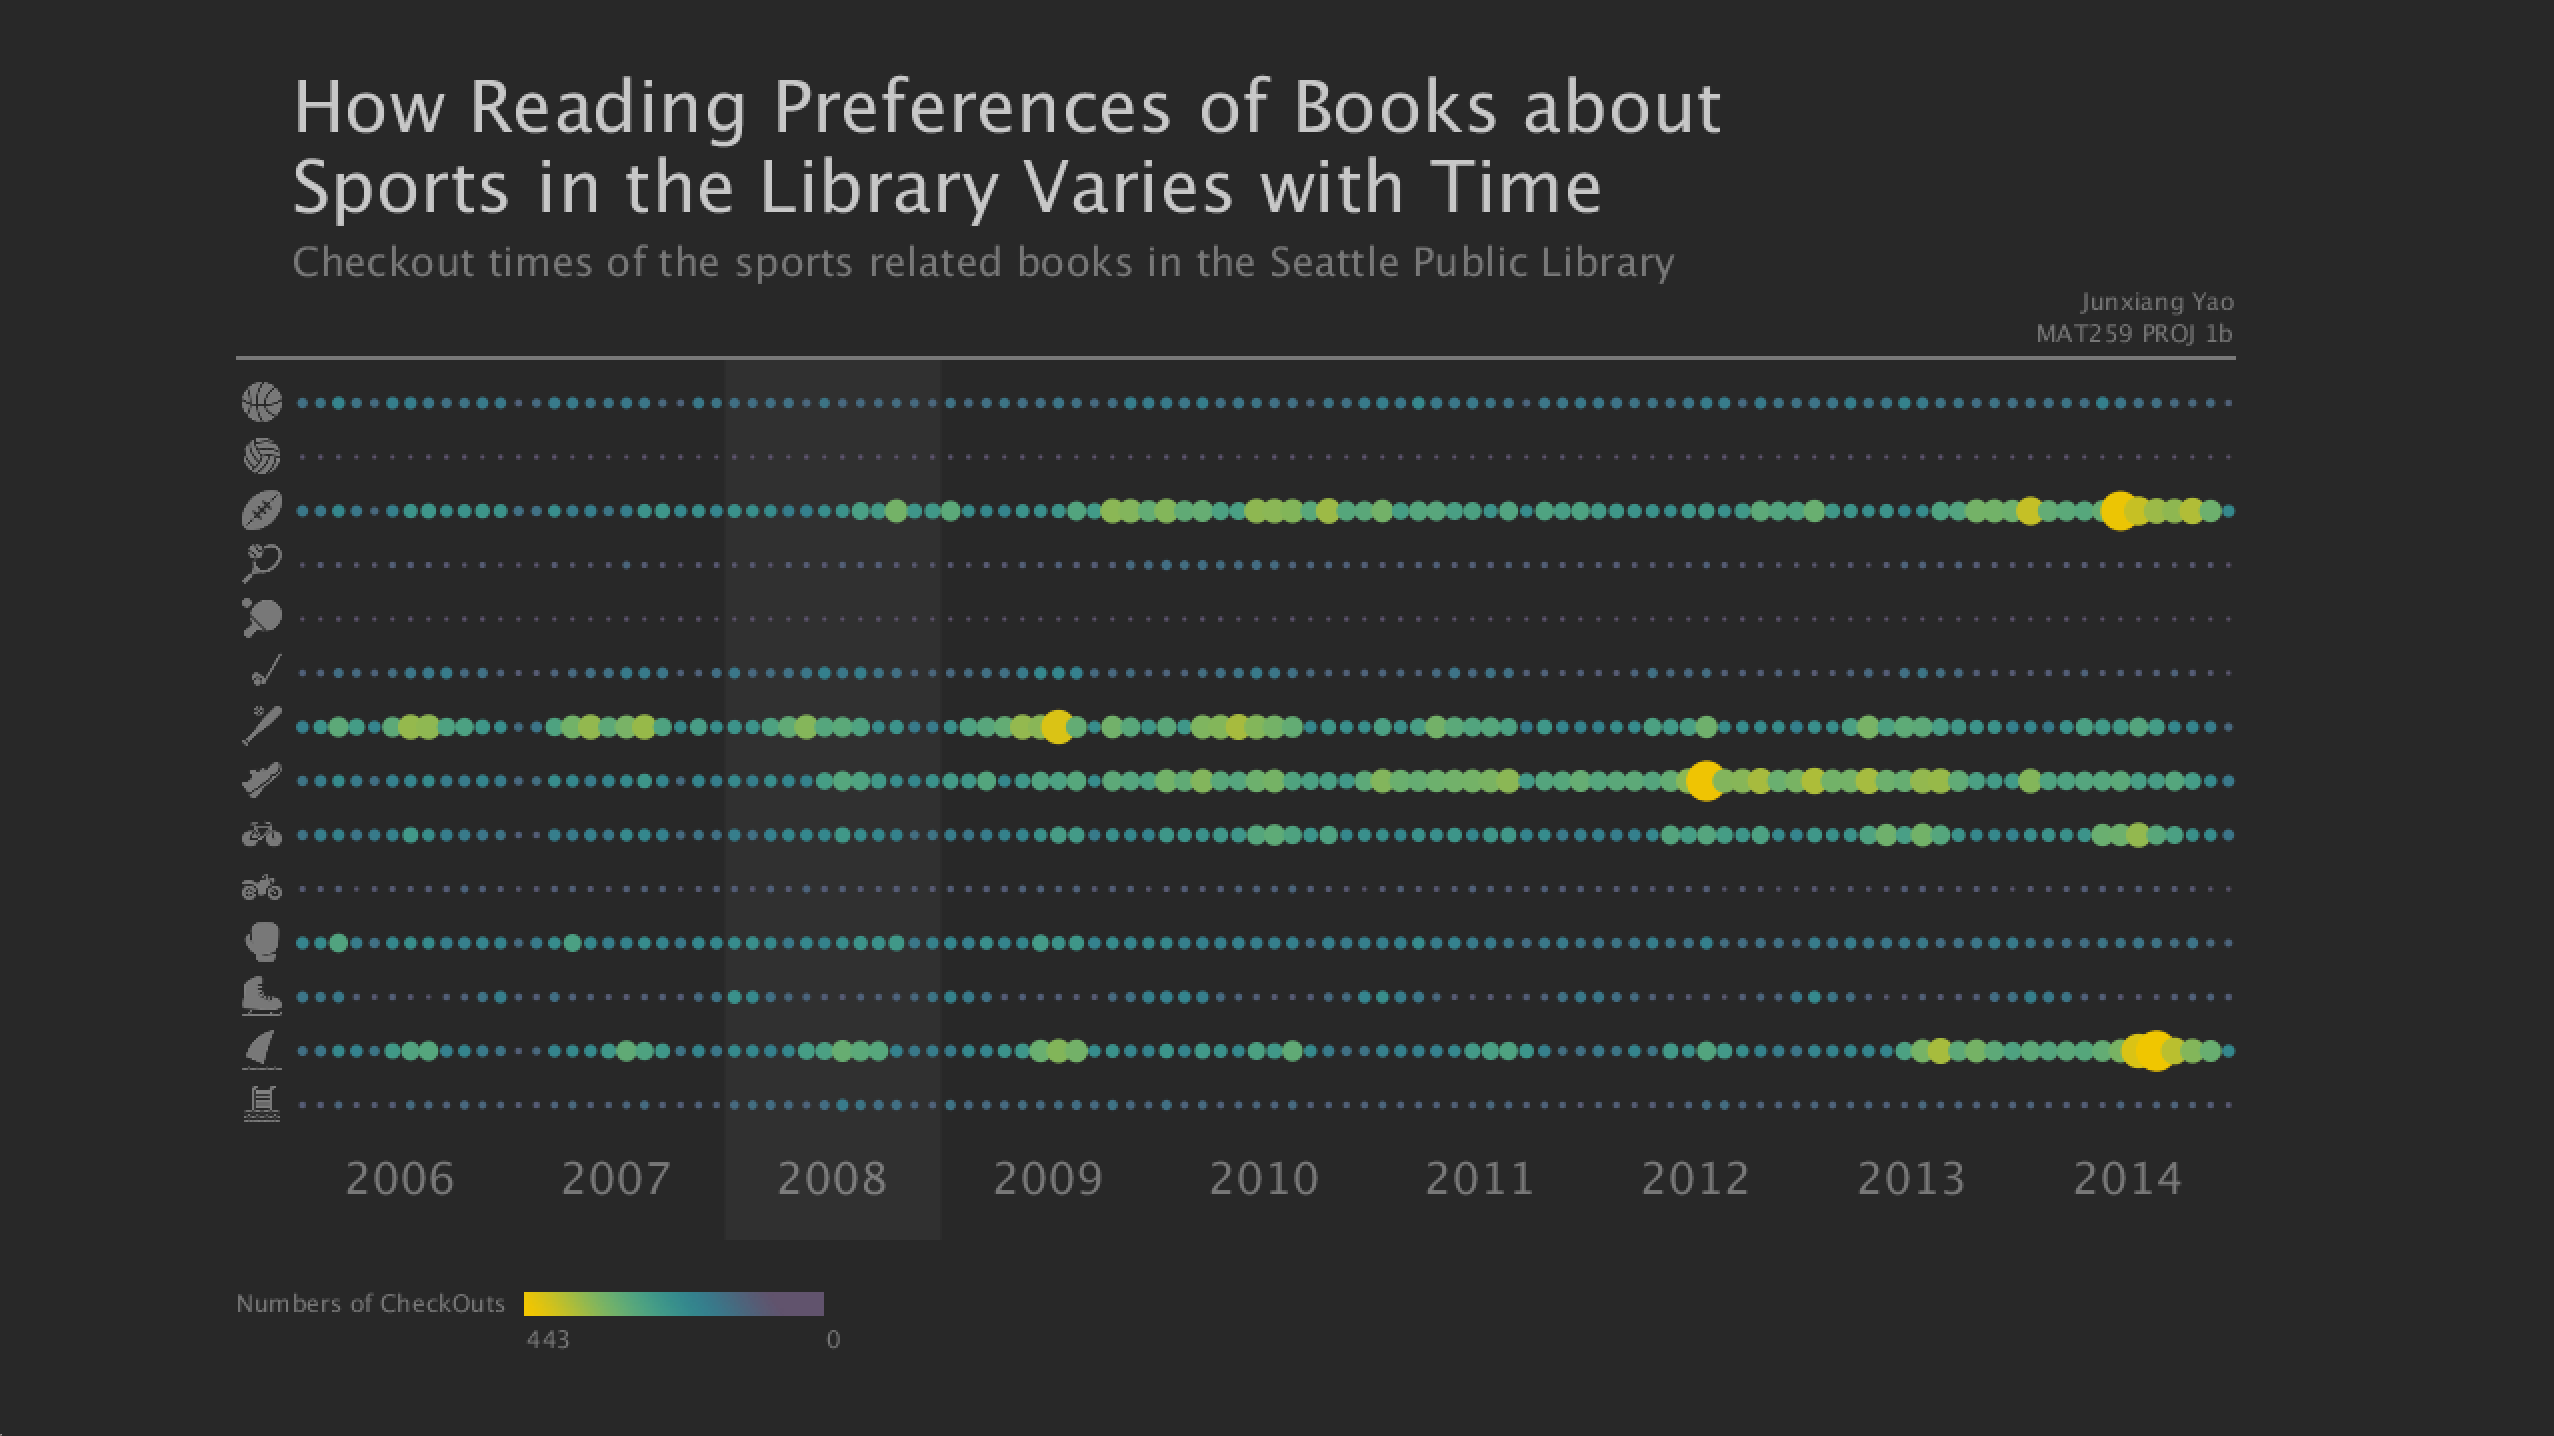
In addition, when the mouse is hovering around the certain year below the chart, the column of that year, including 12 ellipses representing data of each month in that year, will be emphasized by changing the background color of that column.
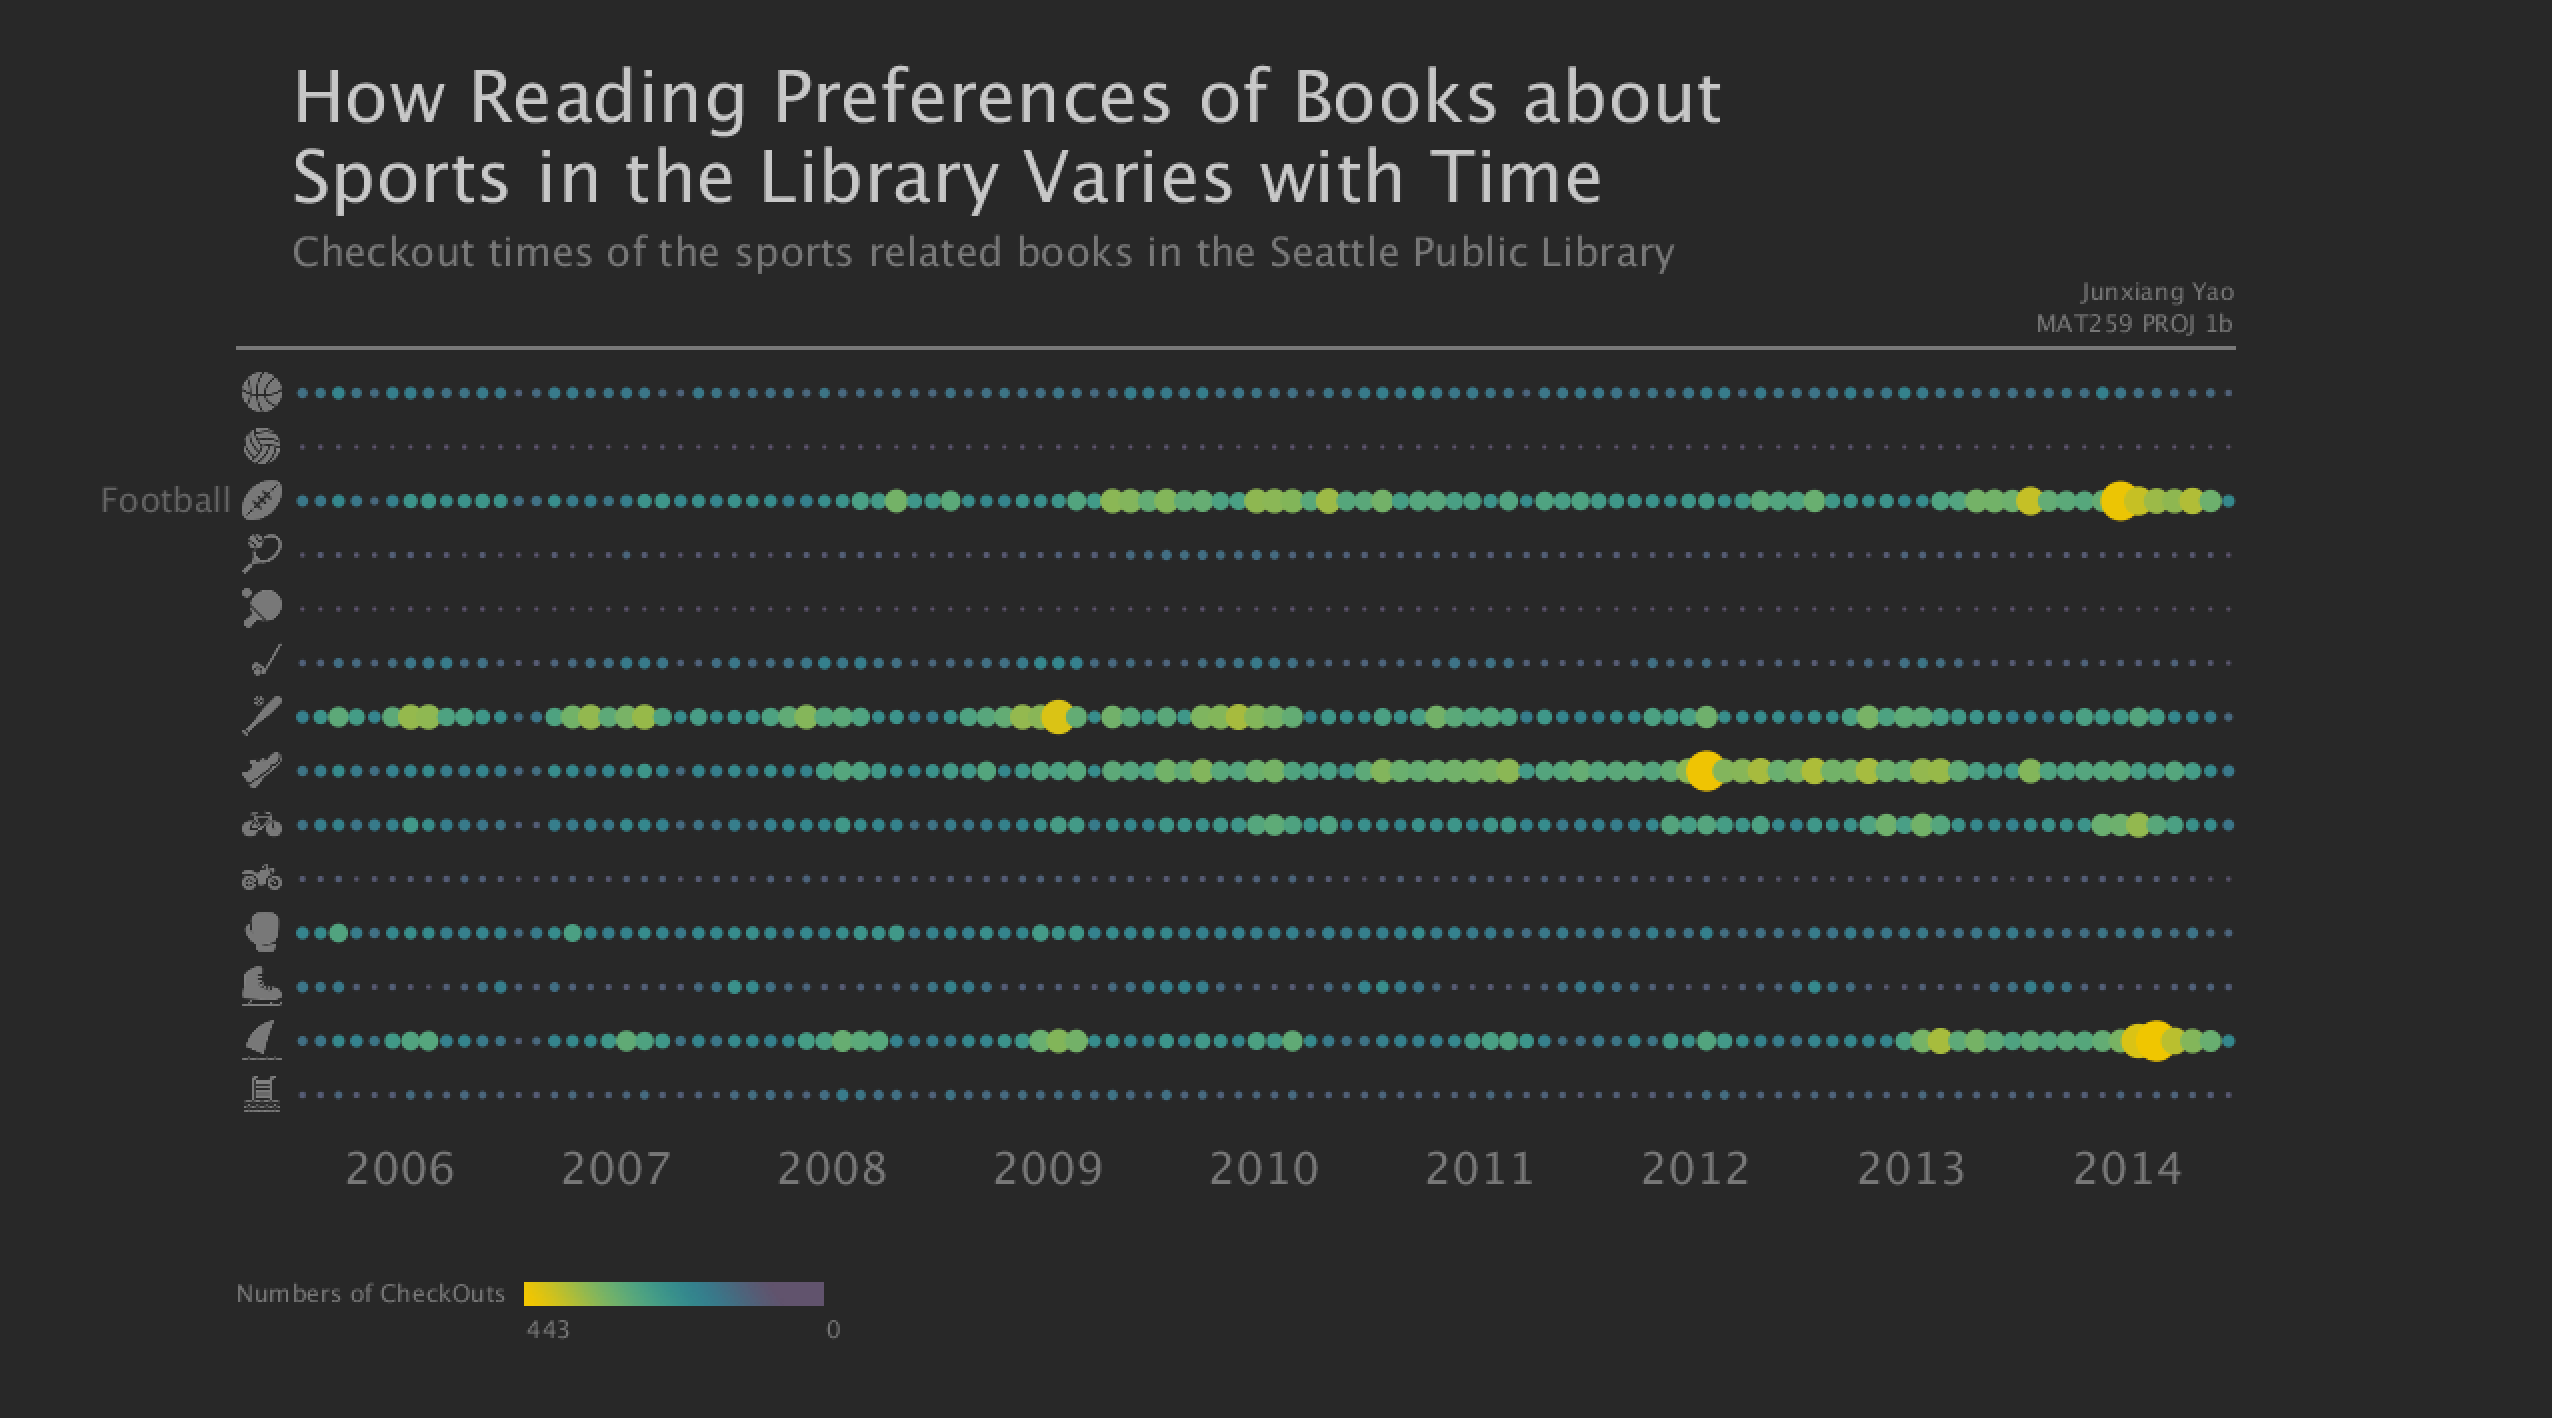
In order to reduce the verbal information displaying in the screen , I used icons to represent different kinds of sports. Only when the mouse is hovering around the icon, the verbal name of that kinds of books will be displayed.Icons used were downloaded from https://icons8.com/web-app/new-icons/all.
1.From the chart, I think reading behavior about sports related books of Seattle citizen is impacted by the factors in the real world to some level. Like in the row of ice&snow sports, there are increases in every winter. And there are also increase in the rows of boating and cycling every summer.
2.Having compared each rows of ellipses, I found that ellipses in rows like volleyball and table tennis are too small to see the change, but other ellipses in rows like football and baseball is more obvious, both in size and color. I think this difference between each rows can tell the popularity of the sports related books. And I have two assumptions about why check out times of books about volleyball and table tennis is so small. The first one is Seattle citizens don't like those two kinds of sports; The second one is they do like these two kinds of sports, but they don't like to read or borrow books about these sports from Seattle Public Library. As for the rows of football, baseball, cycling, boating, etc, the data show that those sports are more popular. The data in the row of "weight lifting,track&field,gymnastics" is a special case. The number in this row is quite obvious because I summed up all the branches under this category in order to find a particular pattern. Otherwise the data will be scattered.
3.I think sports events in the real world are also impacting Seattle citizen's reading behavior. Since in 2008 and 2012, there are increases in the row of "weight lifting,track&field,gymnastics" in June, July and August, which are the months Beijing Olympics and London Olympics were hosted. In addition, there is another clear rise I may have an assumption to explain. In the row of football, from 2013 to 2015, the growth is obvious. I think the reason might be that in 2014, Seattle Seahawks, a NFL team from Seattle, won there first Super Bowl champion ship and almost defended it in 2015.
I used the grid system while designing the layout.
In addition, when the mouse is hovering around the certain year below the chart, the column of that year, including 12 ellipses representing data of each month in that year, will be emphasized by changing the background color of that column.
In order to reduce the verbal information displaying in the screen , I used icons to represent different kinds of sports. Only when the mouse is hovering around the icon, the verbal name of that kinds of books will be displayed.Icons used were downloaded from https://icons8.com/web-app/new-icons/all.
1.From the chart, I think reading behavior about sports related books of Seattle citizen is impacted by the factors in the real world to some level. Like in the row of ice&snow sports, there are increases in every winter. And there are also increase in the rows of boating and cycling every summer.
2.Having compared each rows of ellipses, I found that ellipses in rows like volleyball and table tennis are too small to see the change, but other ellipses in rows like football and baseball is more obvious, both in size and color. I think this difference between each rows can tell the popularity of the sports related books. And I have two assumptions about why check out times of books about volleyball and table tennis is so small. The first one is Seattle citizens don't like those two kinds of sports; The second one is they do like these two kinds of sports, but they don't like to read or borrow books about these sports from Seattle Public Library. As for the rows of football, baseball, cycling, boating, etc, the data show that those sports are more popular. The data in the row of "weight lifting,track&field,gymnastics" is a special case. The number in this row is quite obvious because I summed up all the branches under this category in order to find a particular pattern. Otherwise the data will be scattered.
3.I think sports events in the real world are also impacting Seattle citizen's reading behavior. Since in 2008 and 2012, there are increases in the row of "weight lifting,track&field,gymnastics" in June, July and August, which are the months Beijing Olympics and London Olympics were hosted. In addition, there is another clear rise I may have an assumption to explain. In the row of football, from 2013 to 2015, the growth is obvious. I think the reason might be that in 2014, Seattle Seahawks, a NFL team from Seattle, won there first Super Bowl champion ship and almost defended it in 2015.
Code