ALA Frequently Challenged Titles in the Seattle Public Library
MAT 259, 2016
Jordan Hughes
Concept
I chose to explore the relationship between banned books and their popularity before, during, and after being "banned". The American Library Association puts out a list every year of the top ten most frequently challenged books and their reasons for being challenged.
My goal was to glean any kind of connection between the popularity of a particular title and it's addition or placement on the list. The list of the top most frequently challenged books by year can be found here.
As a note on how these lists are generated, the ALA says "The Top Ten Most Frequently Challenged books list is compiled by the Office for Intellectual Freedom (OIF) and is based on anecdotal data derived from media stories and voluntary reports sent to OIF about book challenges in communities across the United States. Challenges are documented requests to remove materials from schools or libraries, thus restricting access to them by others. In some cases OIF may get numerous details about who challenged a book, why they are complaining about the book, what happened during the challenge, and the current status of the book. In other cases, few details are supplied beyond the fact of the challenge and the reasons for the challenge. Sometimes OIF receives information as the challenge is happening, and sometimes OIF receives an online report years later. All of this can affect the total number of challenges reported in any given year and how we inform the public about those challenges. Thus the Top Ten Most Frequently Challenged Books list should be seen as a snapshot of the reports OIF receives and not an exhaustive report."
Query
To generate this particular query I first pulled the list of the Top 10 most frequently challenged books from each year during 2006-2014 (the 2015 list was not released at the time of this writing), and the library checkout data only goes back to 2006. I put these into a spreadsheet and made a pivot grid so I could easily view duplicates. From there, I modified the data in excel to extrapolate the year by year breakdown of the checkout frequency for each title.
SELECT title, checkouts.checkOut, checkouts.bibNumber,
checkouts.itemType  FROM spl3.`_rawXmlDataCheckOuts`
AS checkouts
WHERE ((checkouts.title LIKE "%bad boy can be good%")
OR (checkouts.title LIKE "stolen life a memoir%")
OR (checkouts.title LIKE "starting with alice")
OR (checkouts.title LIKE "%tango makes three%")
OR (checkouts.title LIKE "%athletic shorts%")
OR (checkouts.title LIKE "%bless%ultima%")
OR (checkouts.title LIKE "bone vol 1%")
OR (checkouts.title LIKE "brave new world")
OR (checkouts.title LIKE "adventures of
captain underpants%")
OR (checkouts.title LIKE "crank")
OR (checkouts.title LIKE "drama")
OR (checkouts.title LIKE "fifty shades of grey")
OR (checkouts.title LIKE "flashcards%life%")
OR (checkouts.title LIKE "gossip girl")
OR (checkouts.title LIKE "golden compass")
OR (checkouts.title LIKE "i know why the caged bird%")
OR (checkouts.title LIKE "its perfectly normal%")
OR (checkouts.title LIKE "looking for alaska")
OR (checkouts.title LIKE "lush")
OR (checkouts.title LIKE "my moms having a baby%")
OR ( checkouts.title LIKE "my sisters keeper a novel")
OR ( checkouts.title LIKE "nickel and dimed on%")
OR ( checkouts.title LIKE "olives ocean")
OR ( checkouts.title LIKE "persepolis")
OR ( checkouts.title LIKE "revolutionary voices%")
OR ( checkouts.title LIKE "saga volume one")
OR ( checkouts.title LIKE "scary stories to tell%")
OR ( checkouts.title LIKE "absolutely true diary%")
OR (checkouts.title LIKE "adventures of huck%")
OR (checkouts.title LIKE "bluest eye")
OR (checkouts.title LIKE "catcher in the rye")
OR (checkouts.title LIKE "chocolate war")
OR (checkouts.title LIKE "color of earth")
OR (checkouts.title LIKE "color purple")
OR (checkouts.title LIKE "earth my butt%")
OR (checkouts.title LIKE "glass castle")
OR (checkouts.title LIKE "hunger games")
OR (checkouts.title LIKE "kite runner")
OR (checkouts.title LIKE "perks of being%")
OR (checkouts.title LIKE "thirteen reasons why%")
OR (checkouts.title LIKE "to kill a mock%")
OR (checkouts.title LIKE "ttyl%" AND callNumber
LIKE "%myracle%")
OR (checkouts.title LIKE "twilight")
OR (checkouts.title LIKE "uncle bobby%")
OR (checkouts.title LIKE "what my mother does%"))
AND ((checkouts.checkout
BETWEEN "2005-01-01" AND "2014-12-31")
AND (checkouts.`itemType` LIKE  "%bk%"))
ORDER BY title, checkout
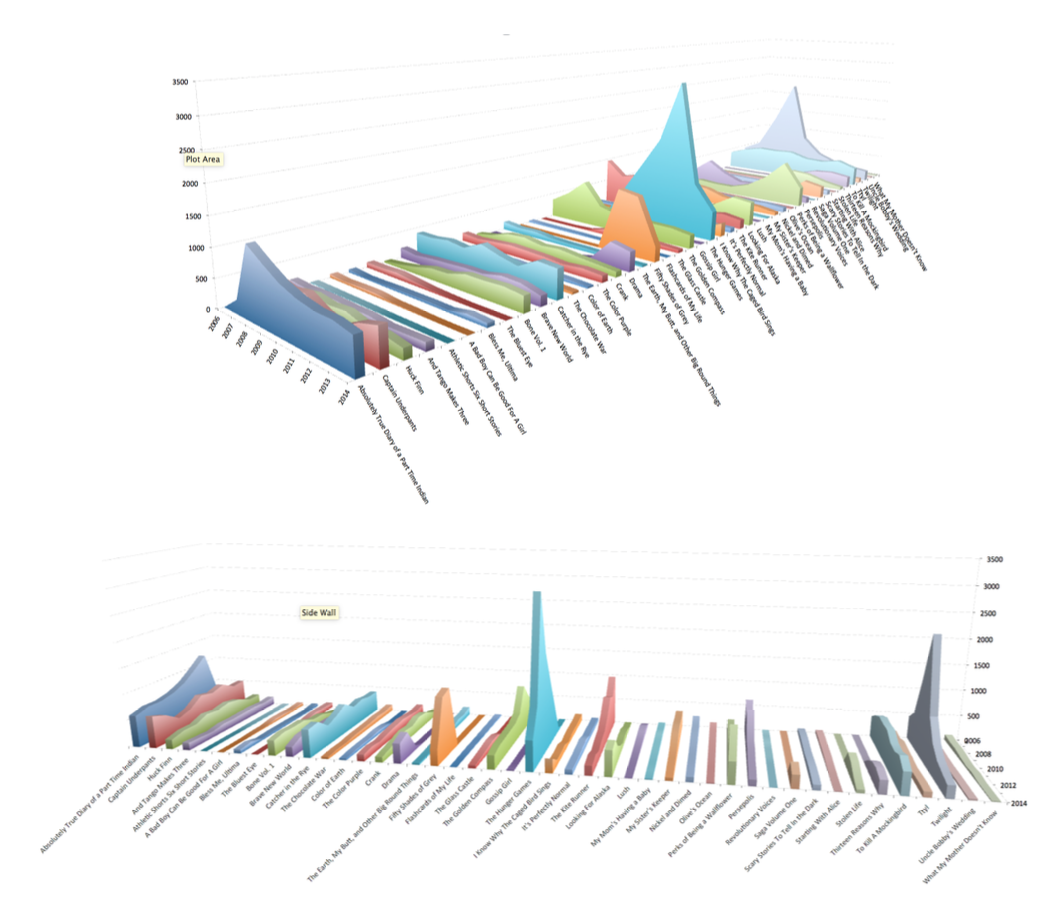
Preliminary data and visualization
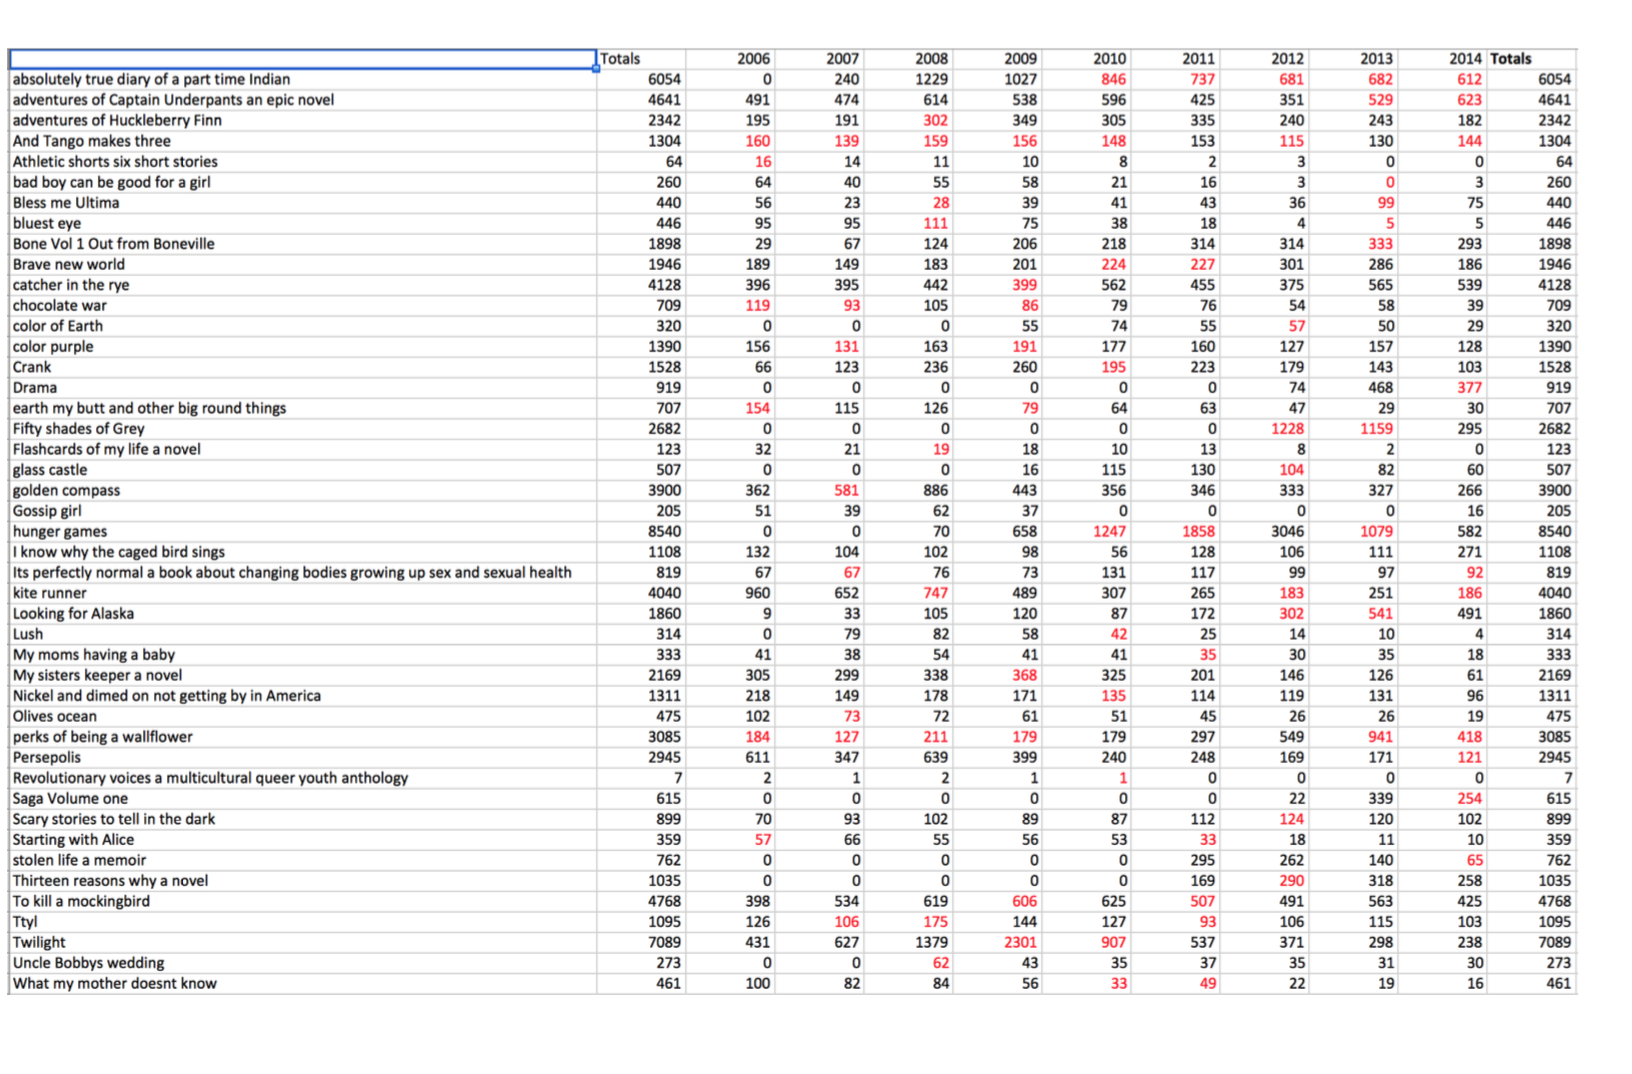
The query took approximately 513.74 seconds to run when fully completed. It was built line by line to include each book title on the list, and the filtered for those titles. The query essentially pulls each checkout for each title for the time period between 2006 and 2014. This returned 80,875 checkouts for all of these titles over that time period. From there, I created a data table that broke the titles down by year and did a frequency count of each title and checkout year.
Process
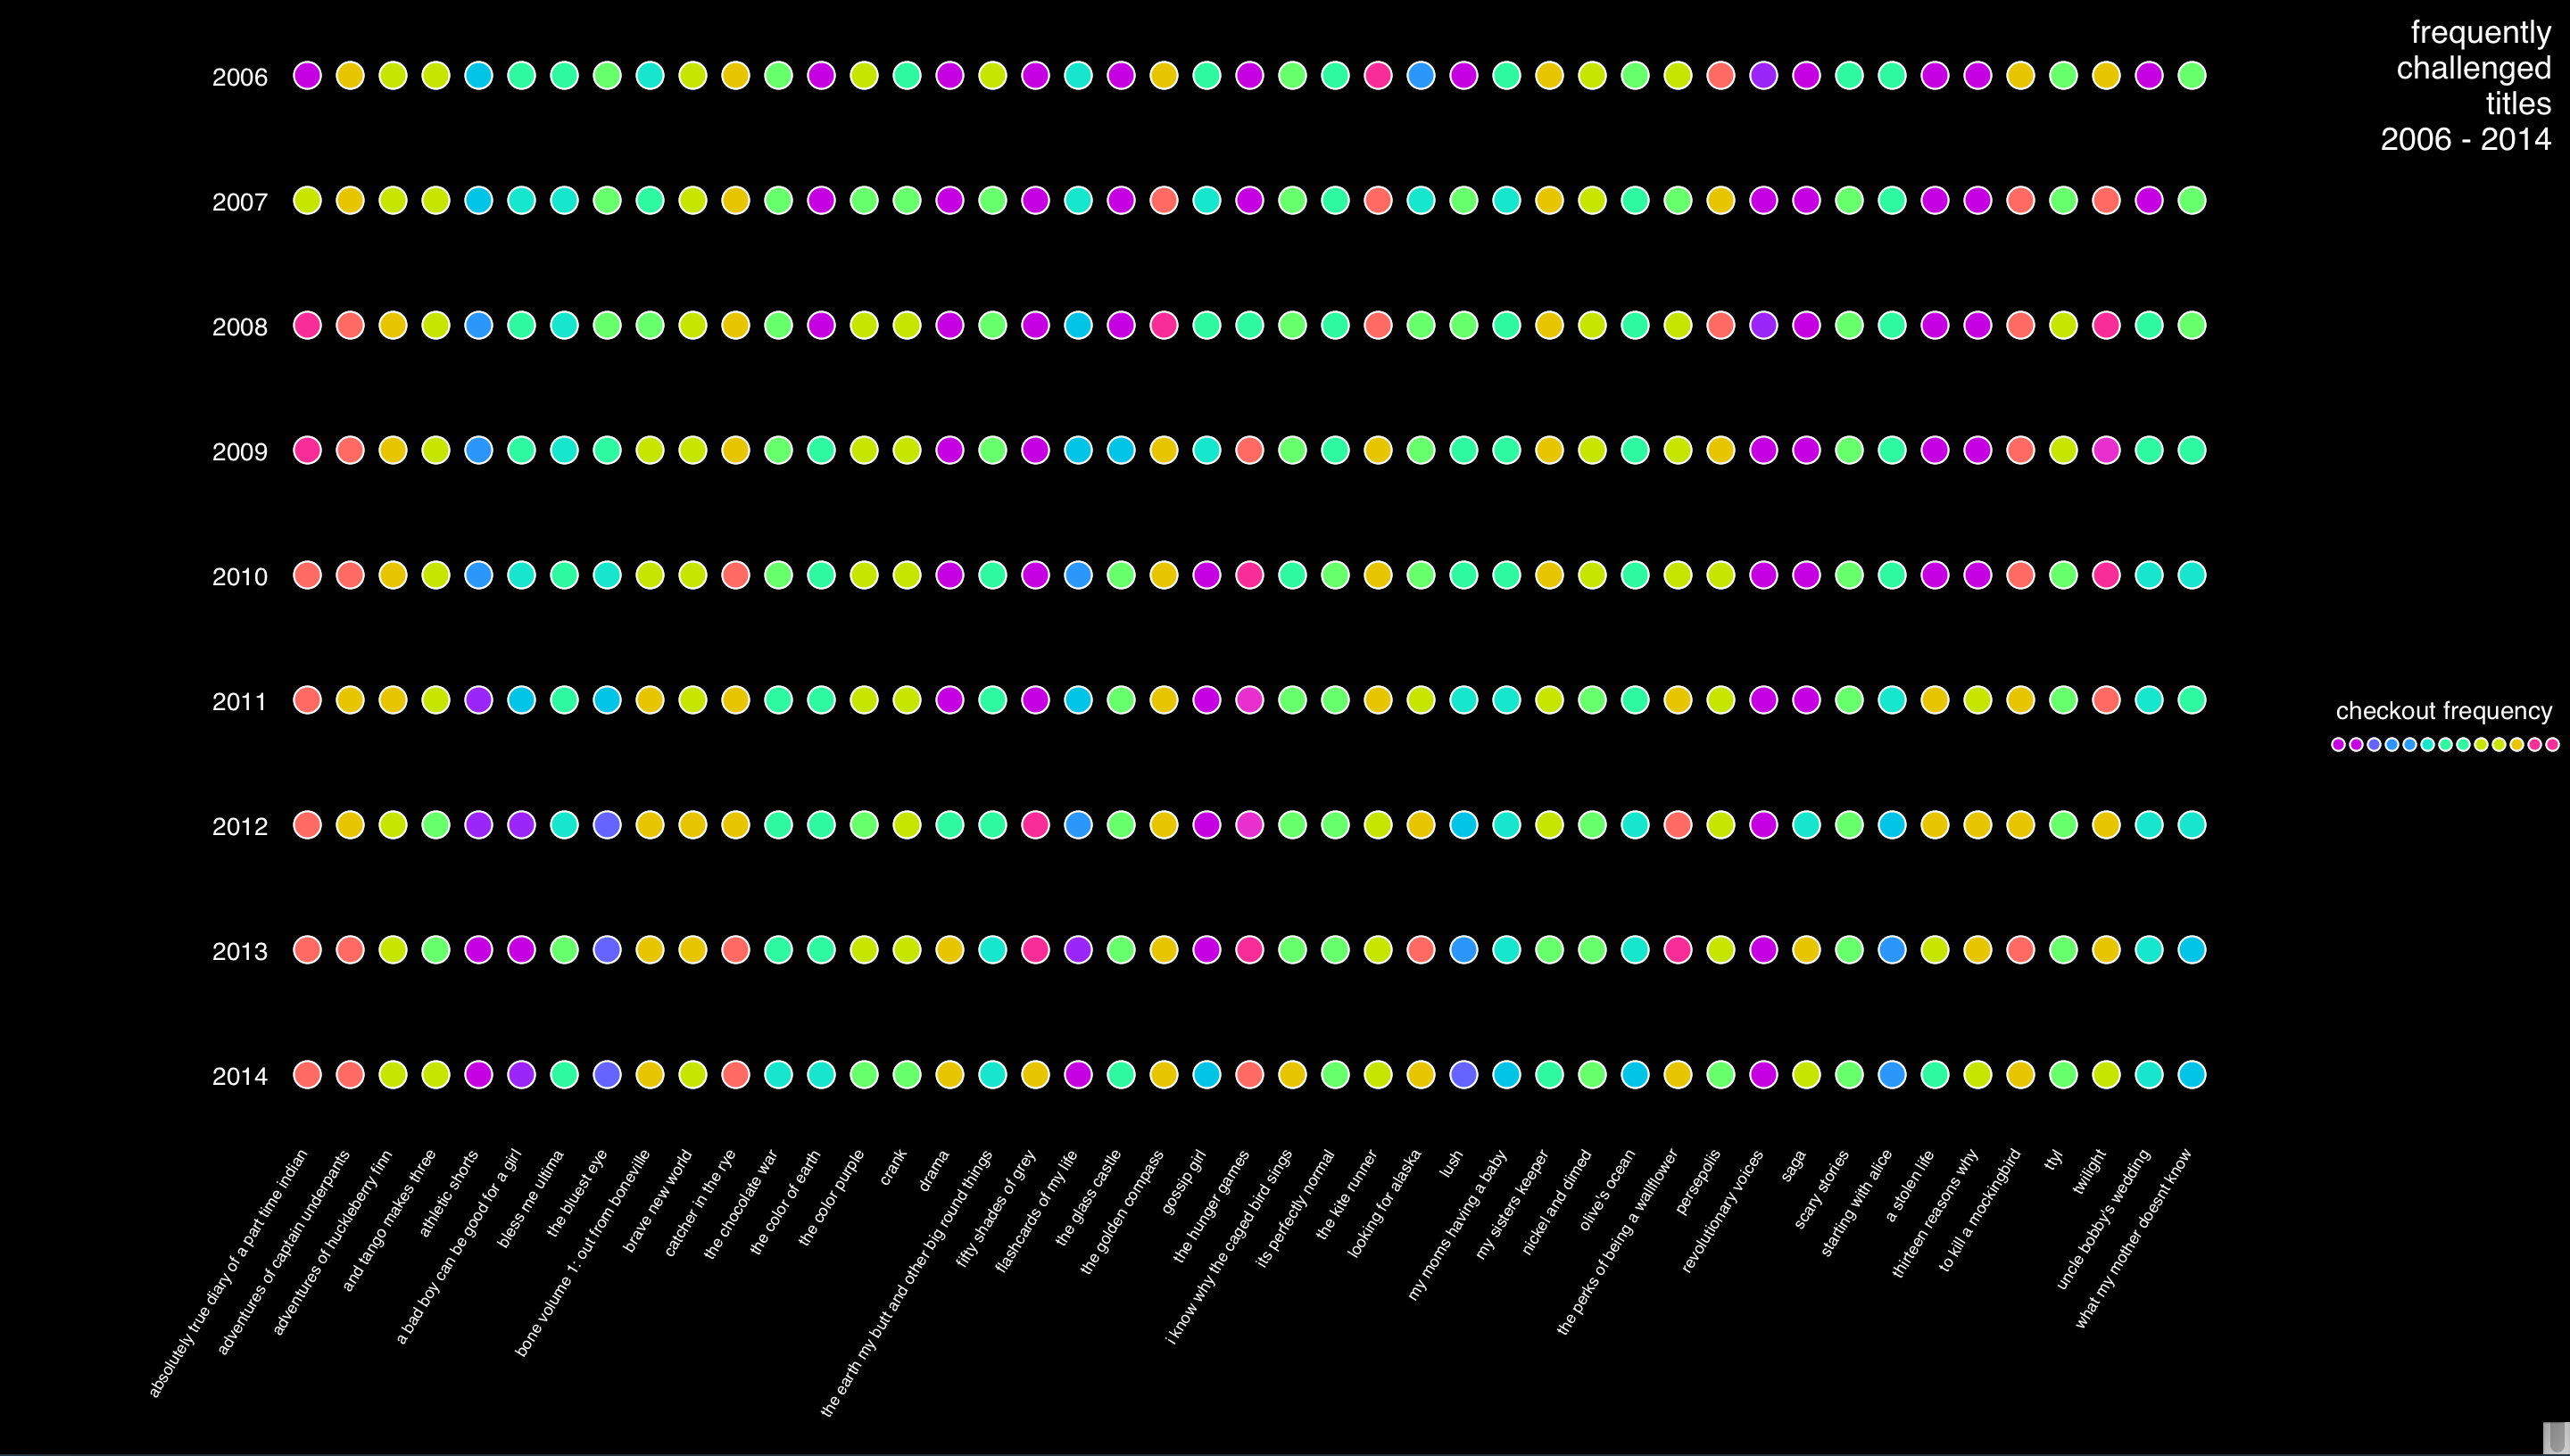
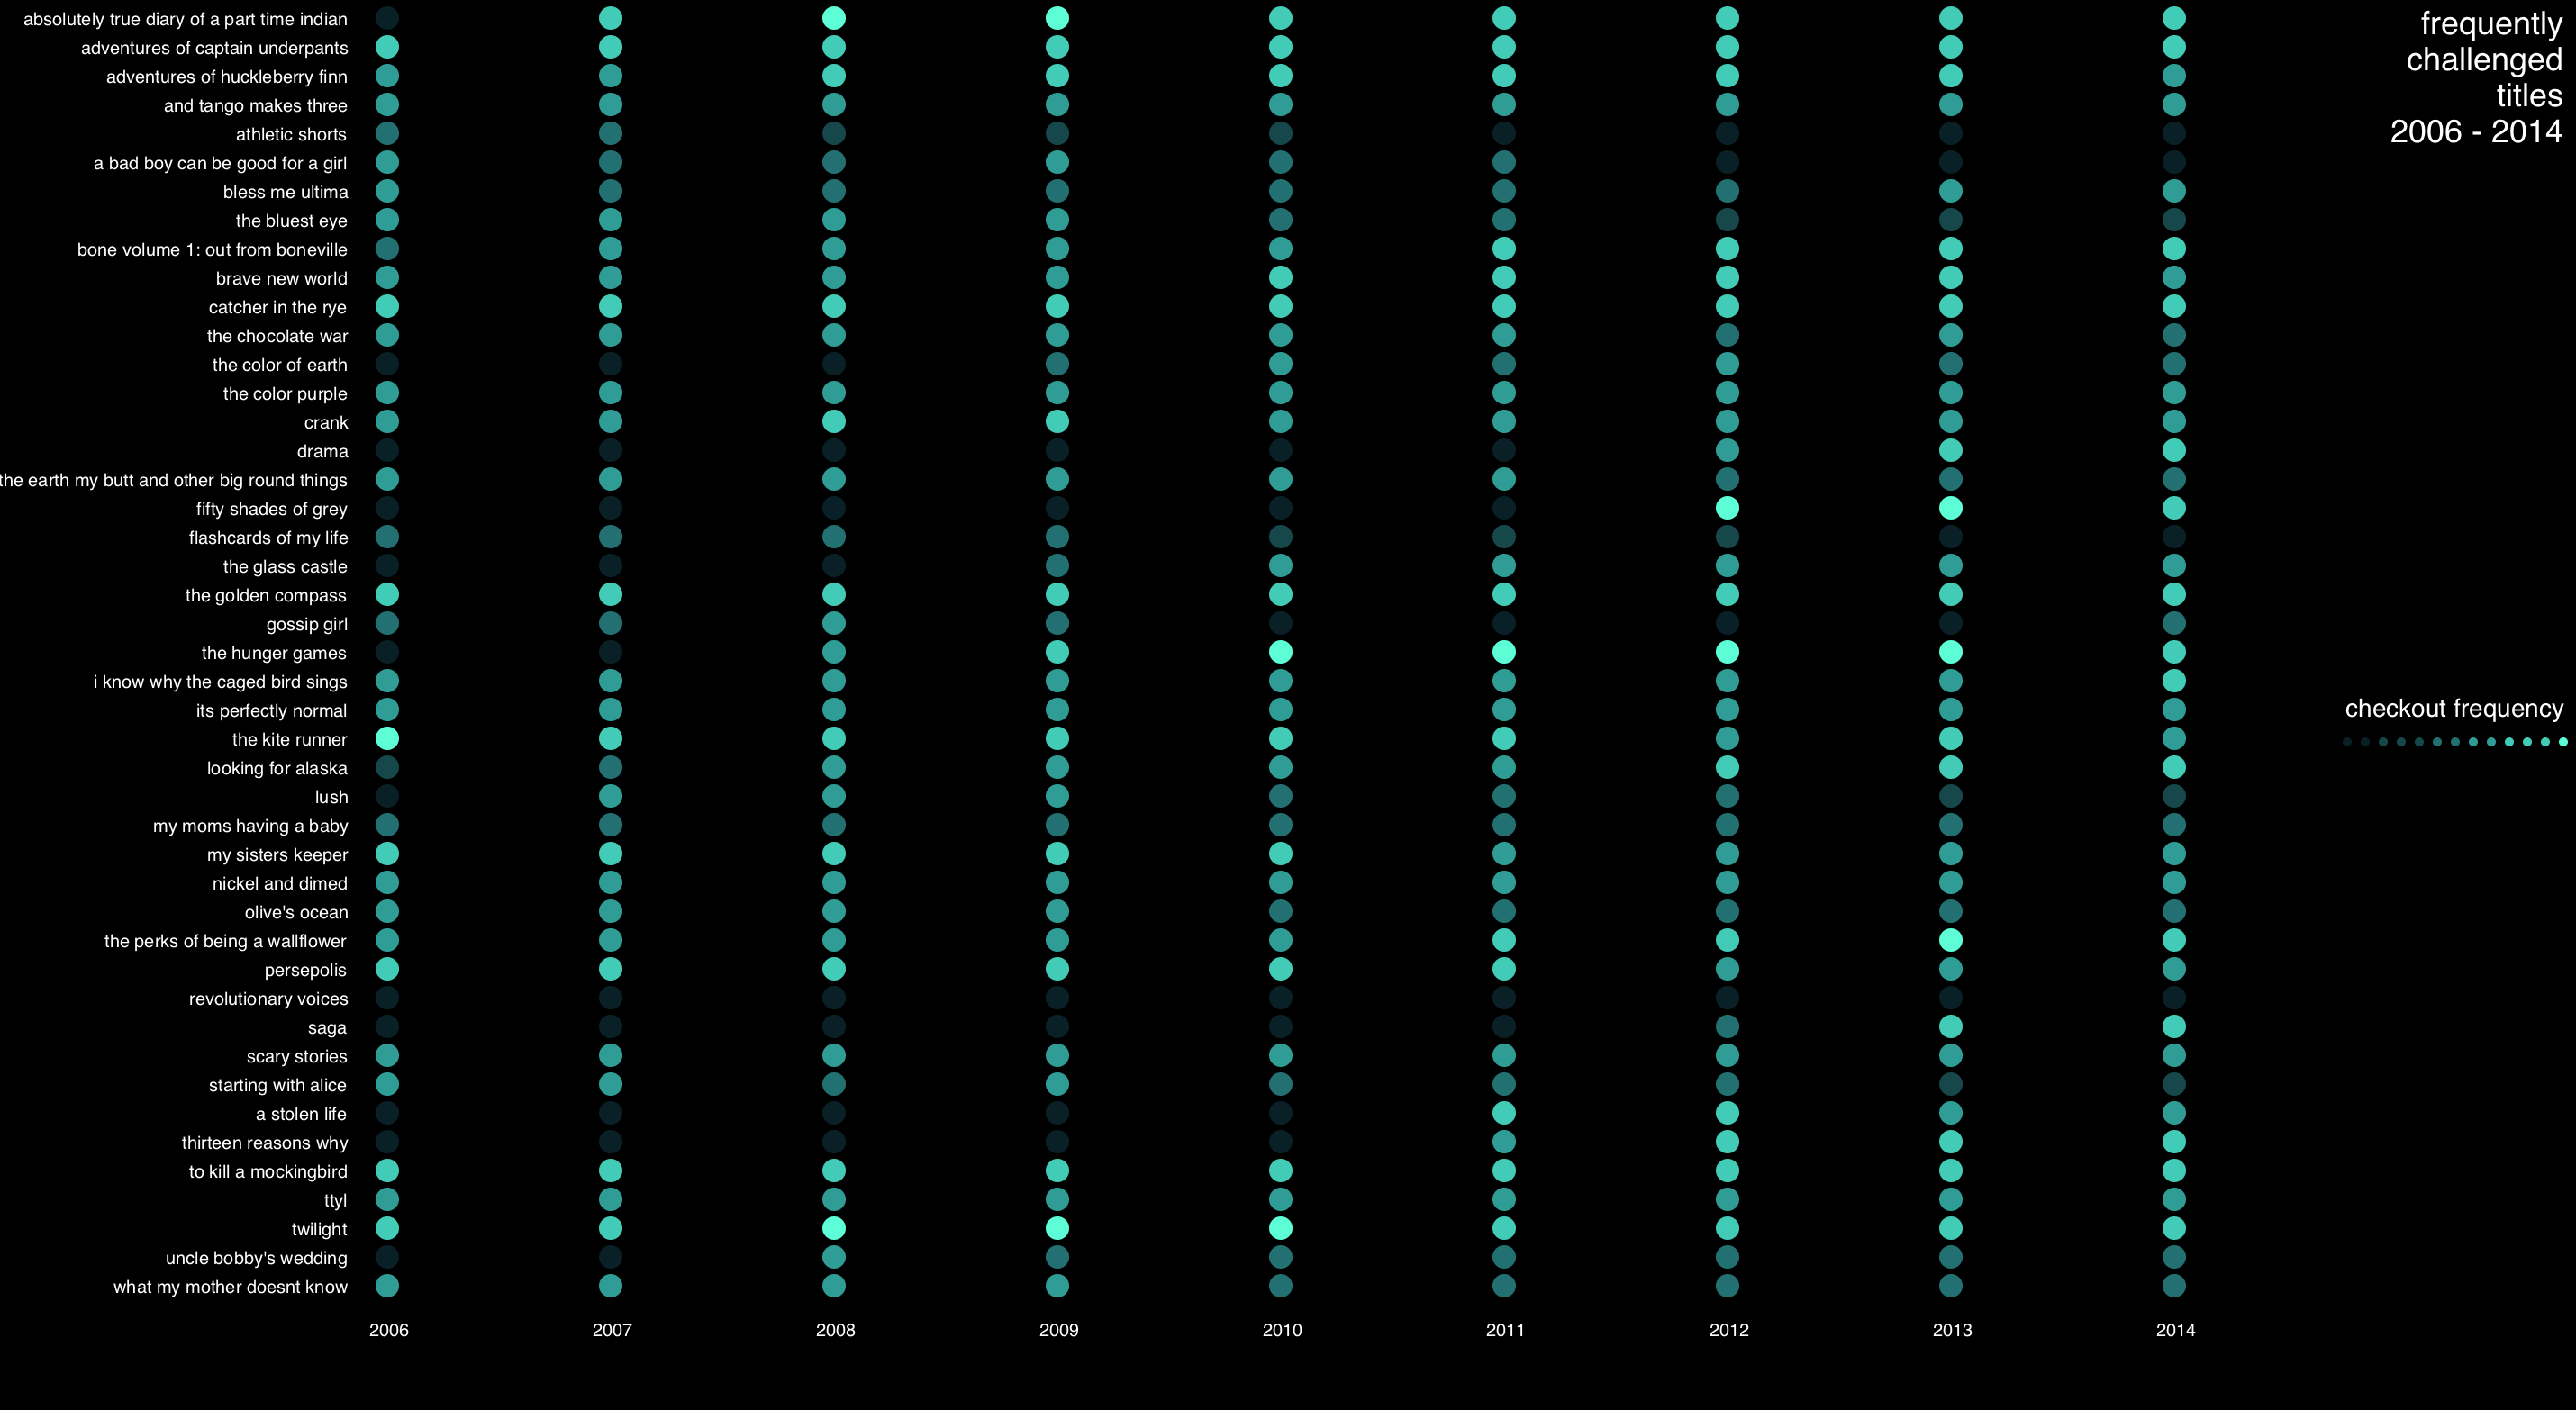
This was the initial 2D visualization done in processing. The basic idea was to align titles on the x-axis and years on the y-axis, with color of the circle corresponding to the frequency of the checkouts.
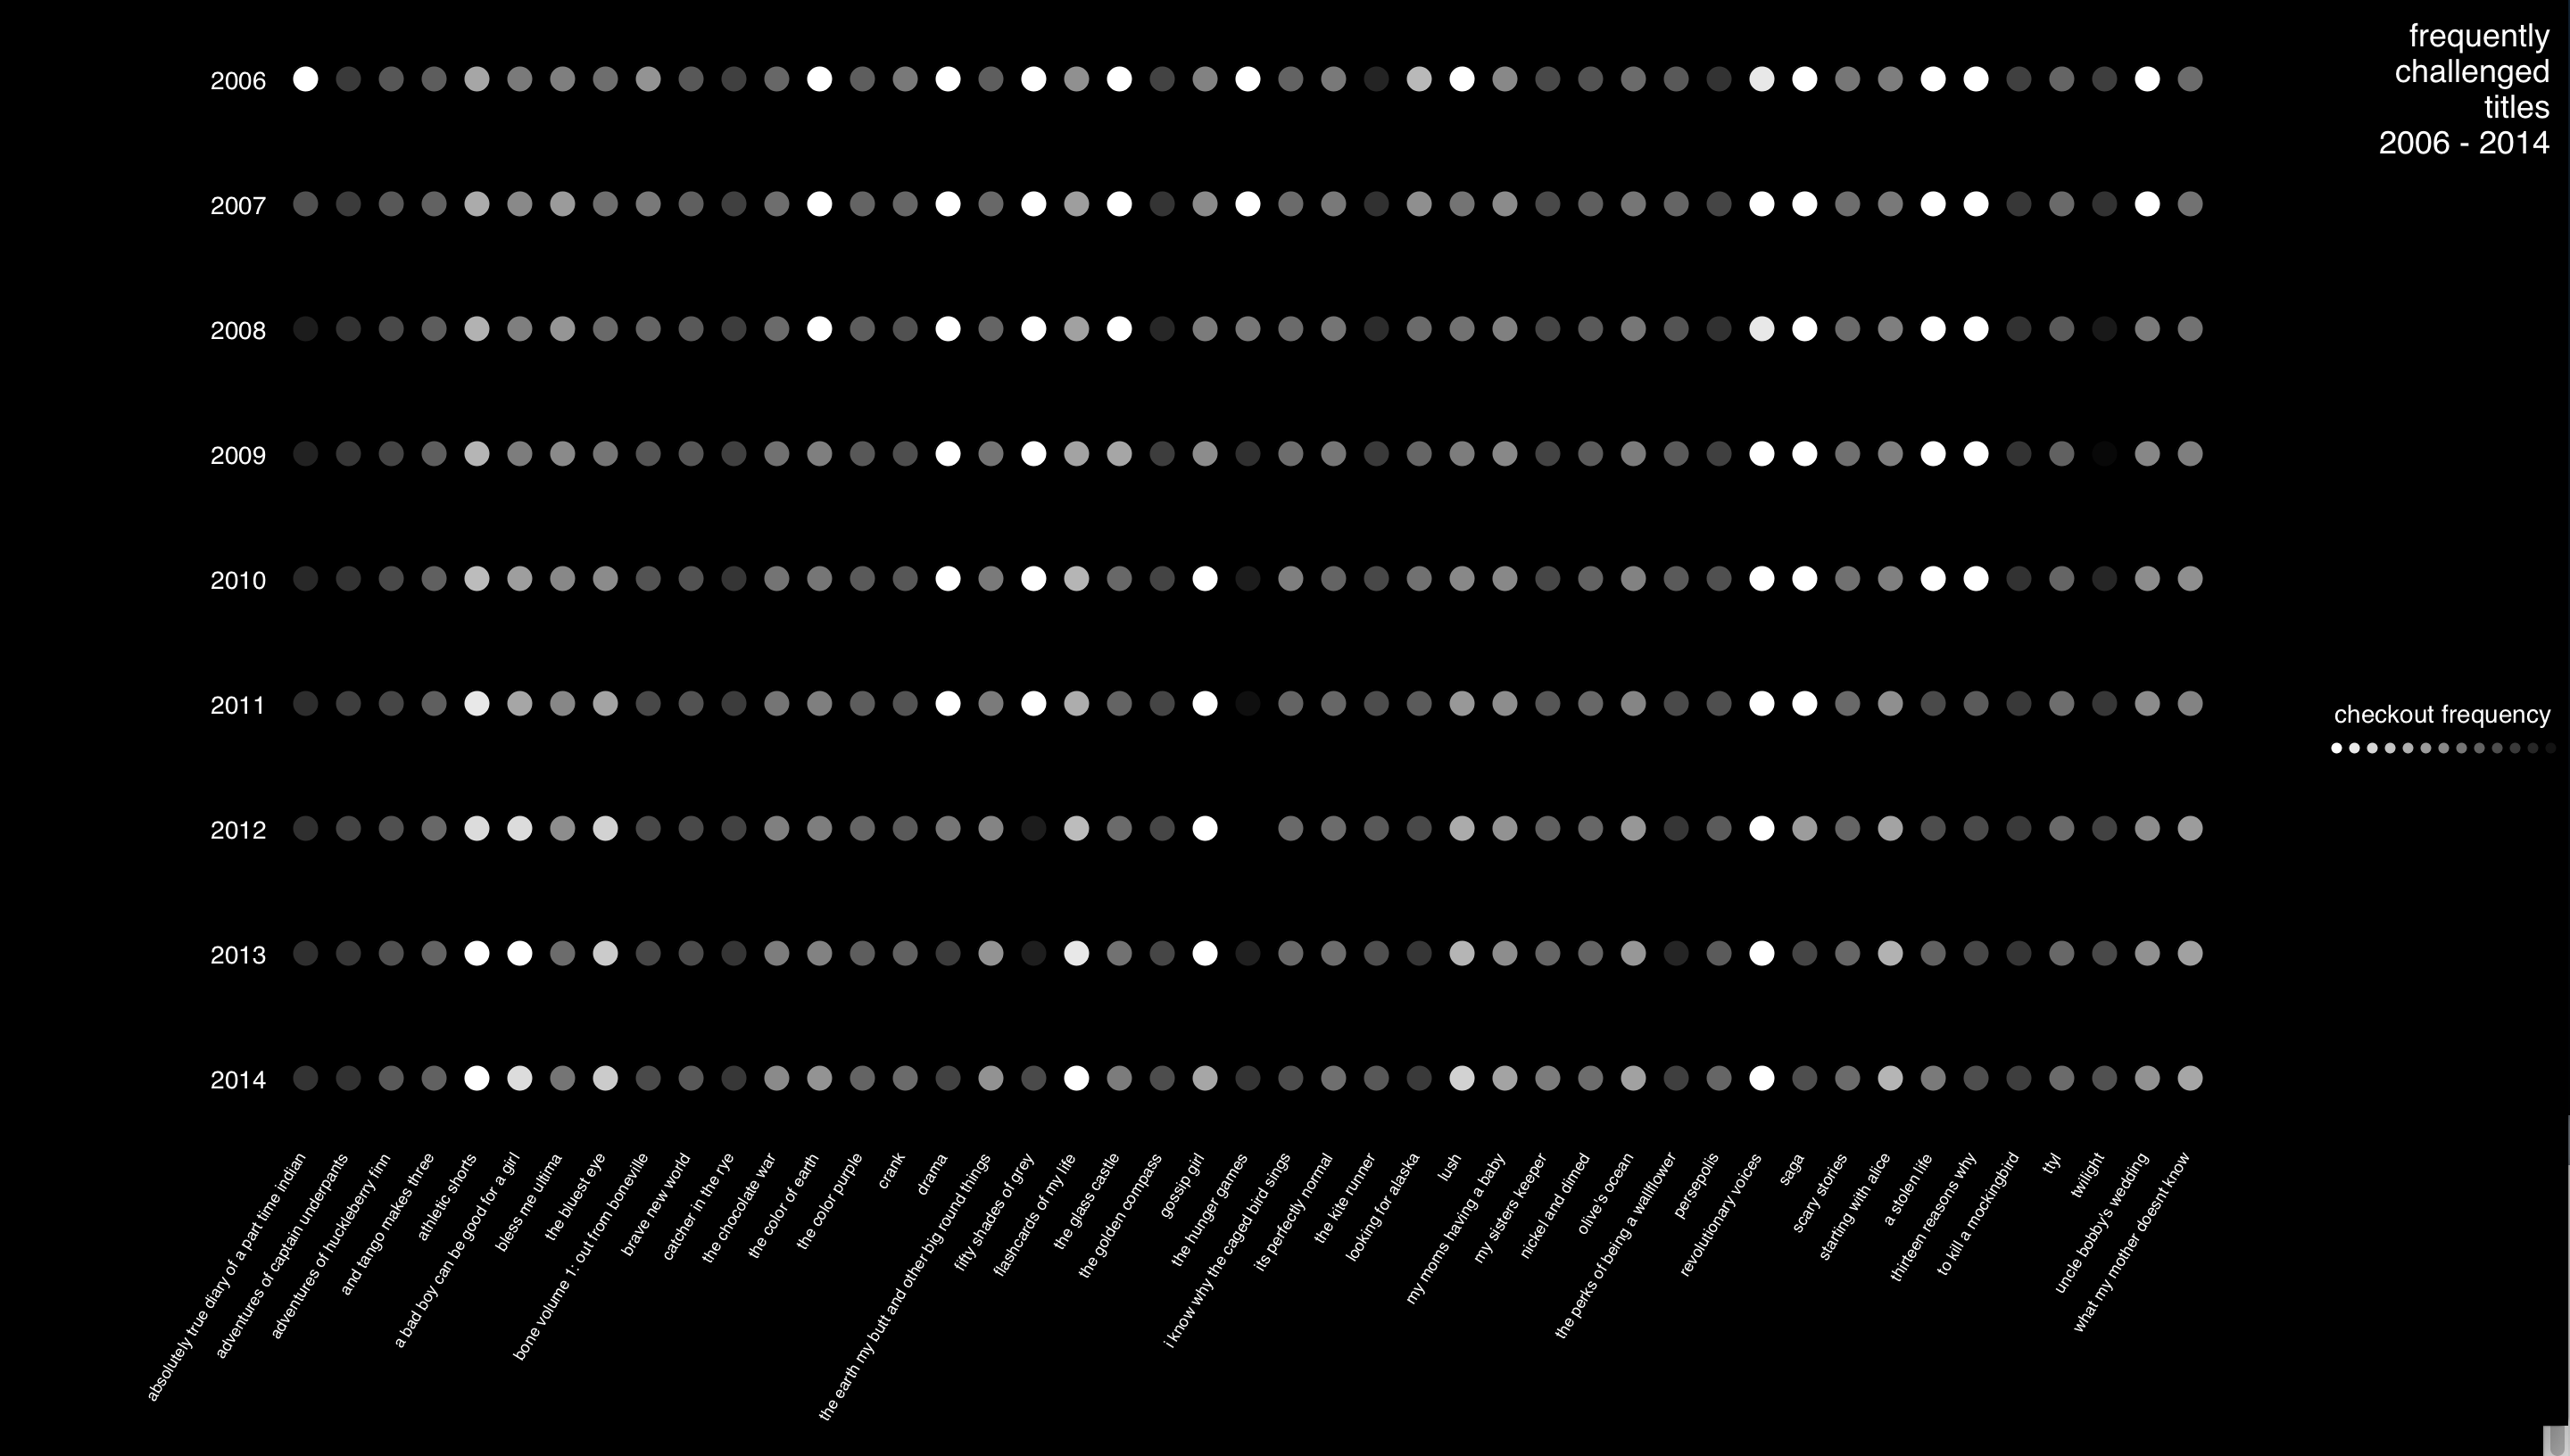
Final result
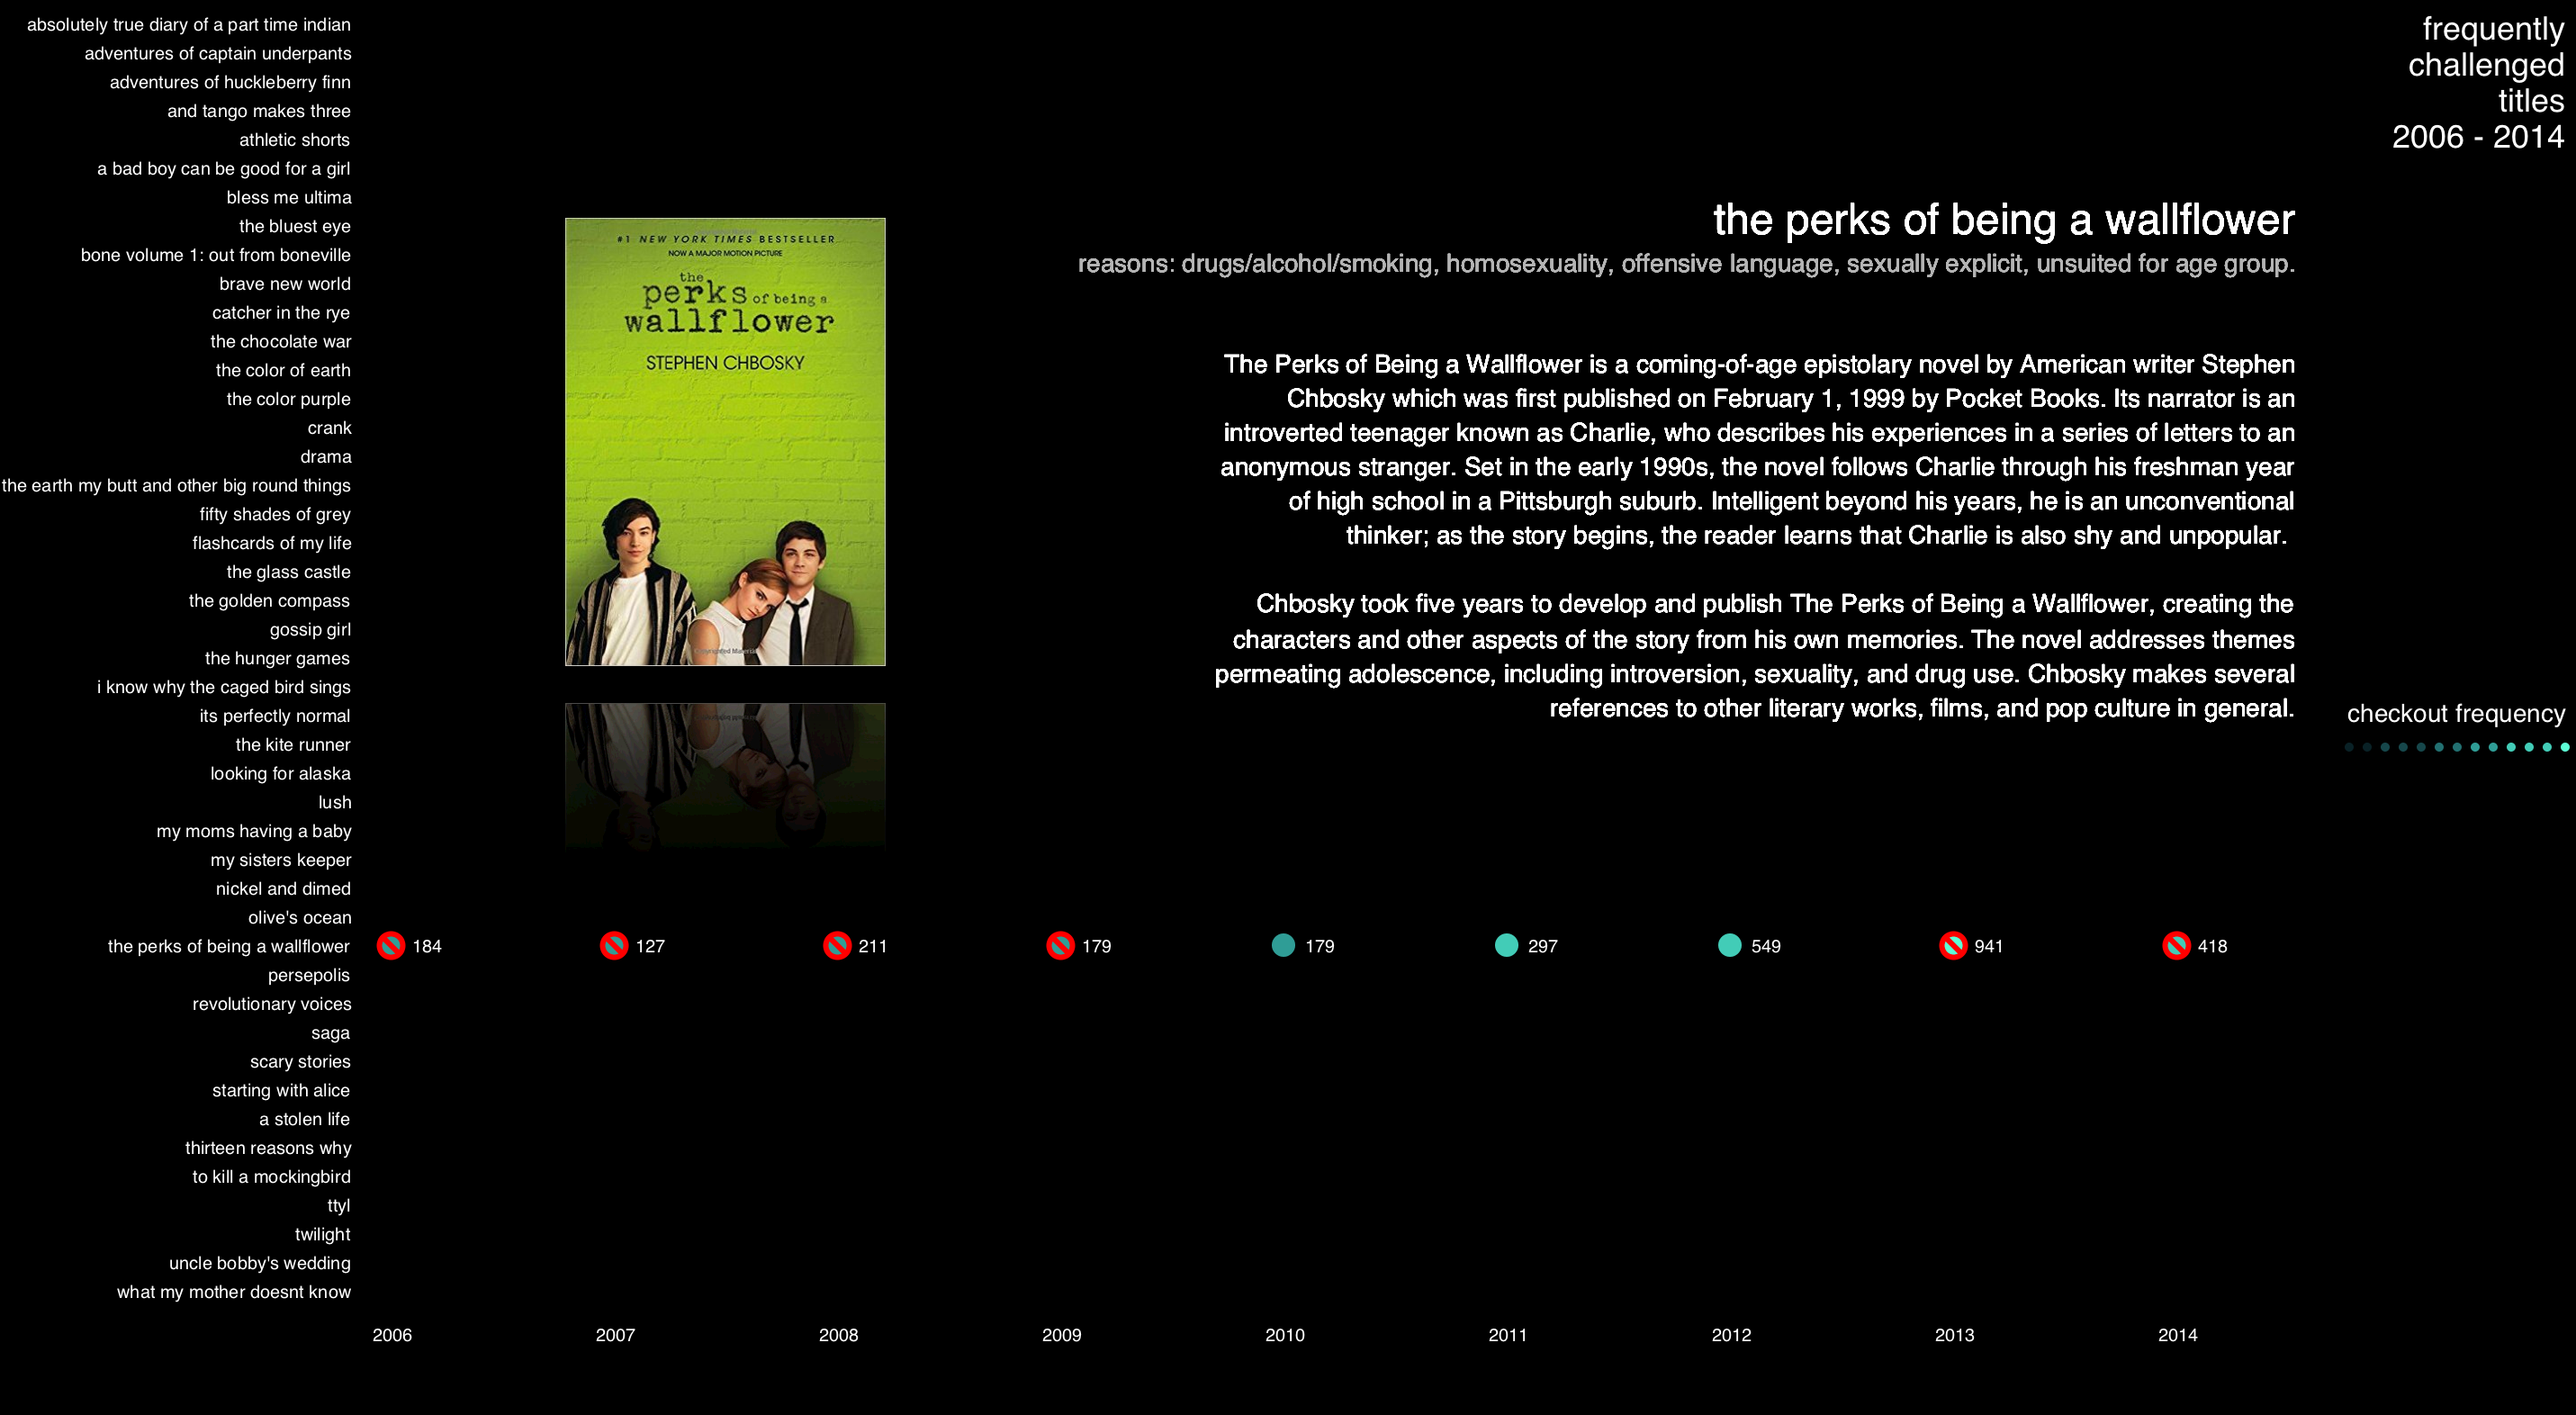
Mouse-over events were added to the visualization so that the user can individually see the challenged book title and the reasons that the book has made the challenged list. Also, the frequency of the checkouts and years banned are made available on the mouseover.
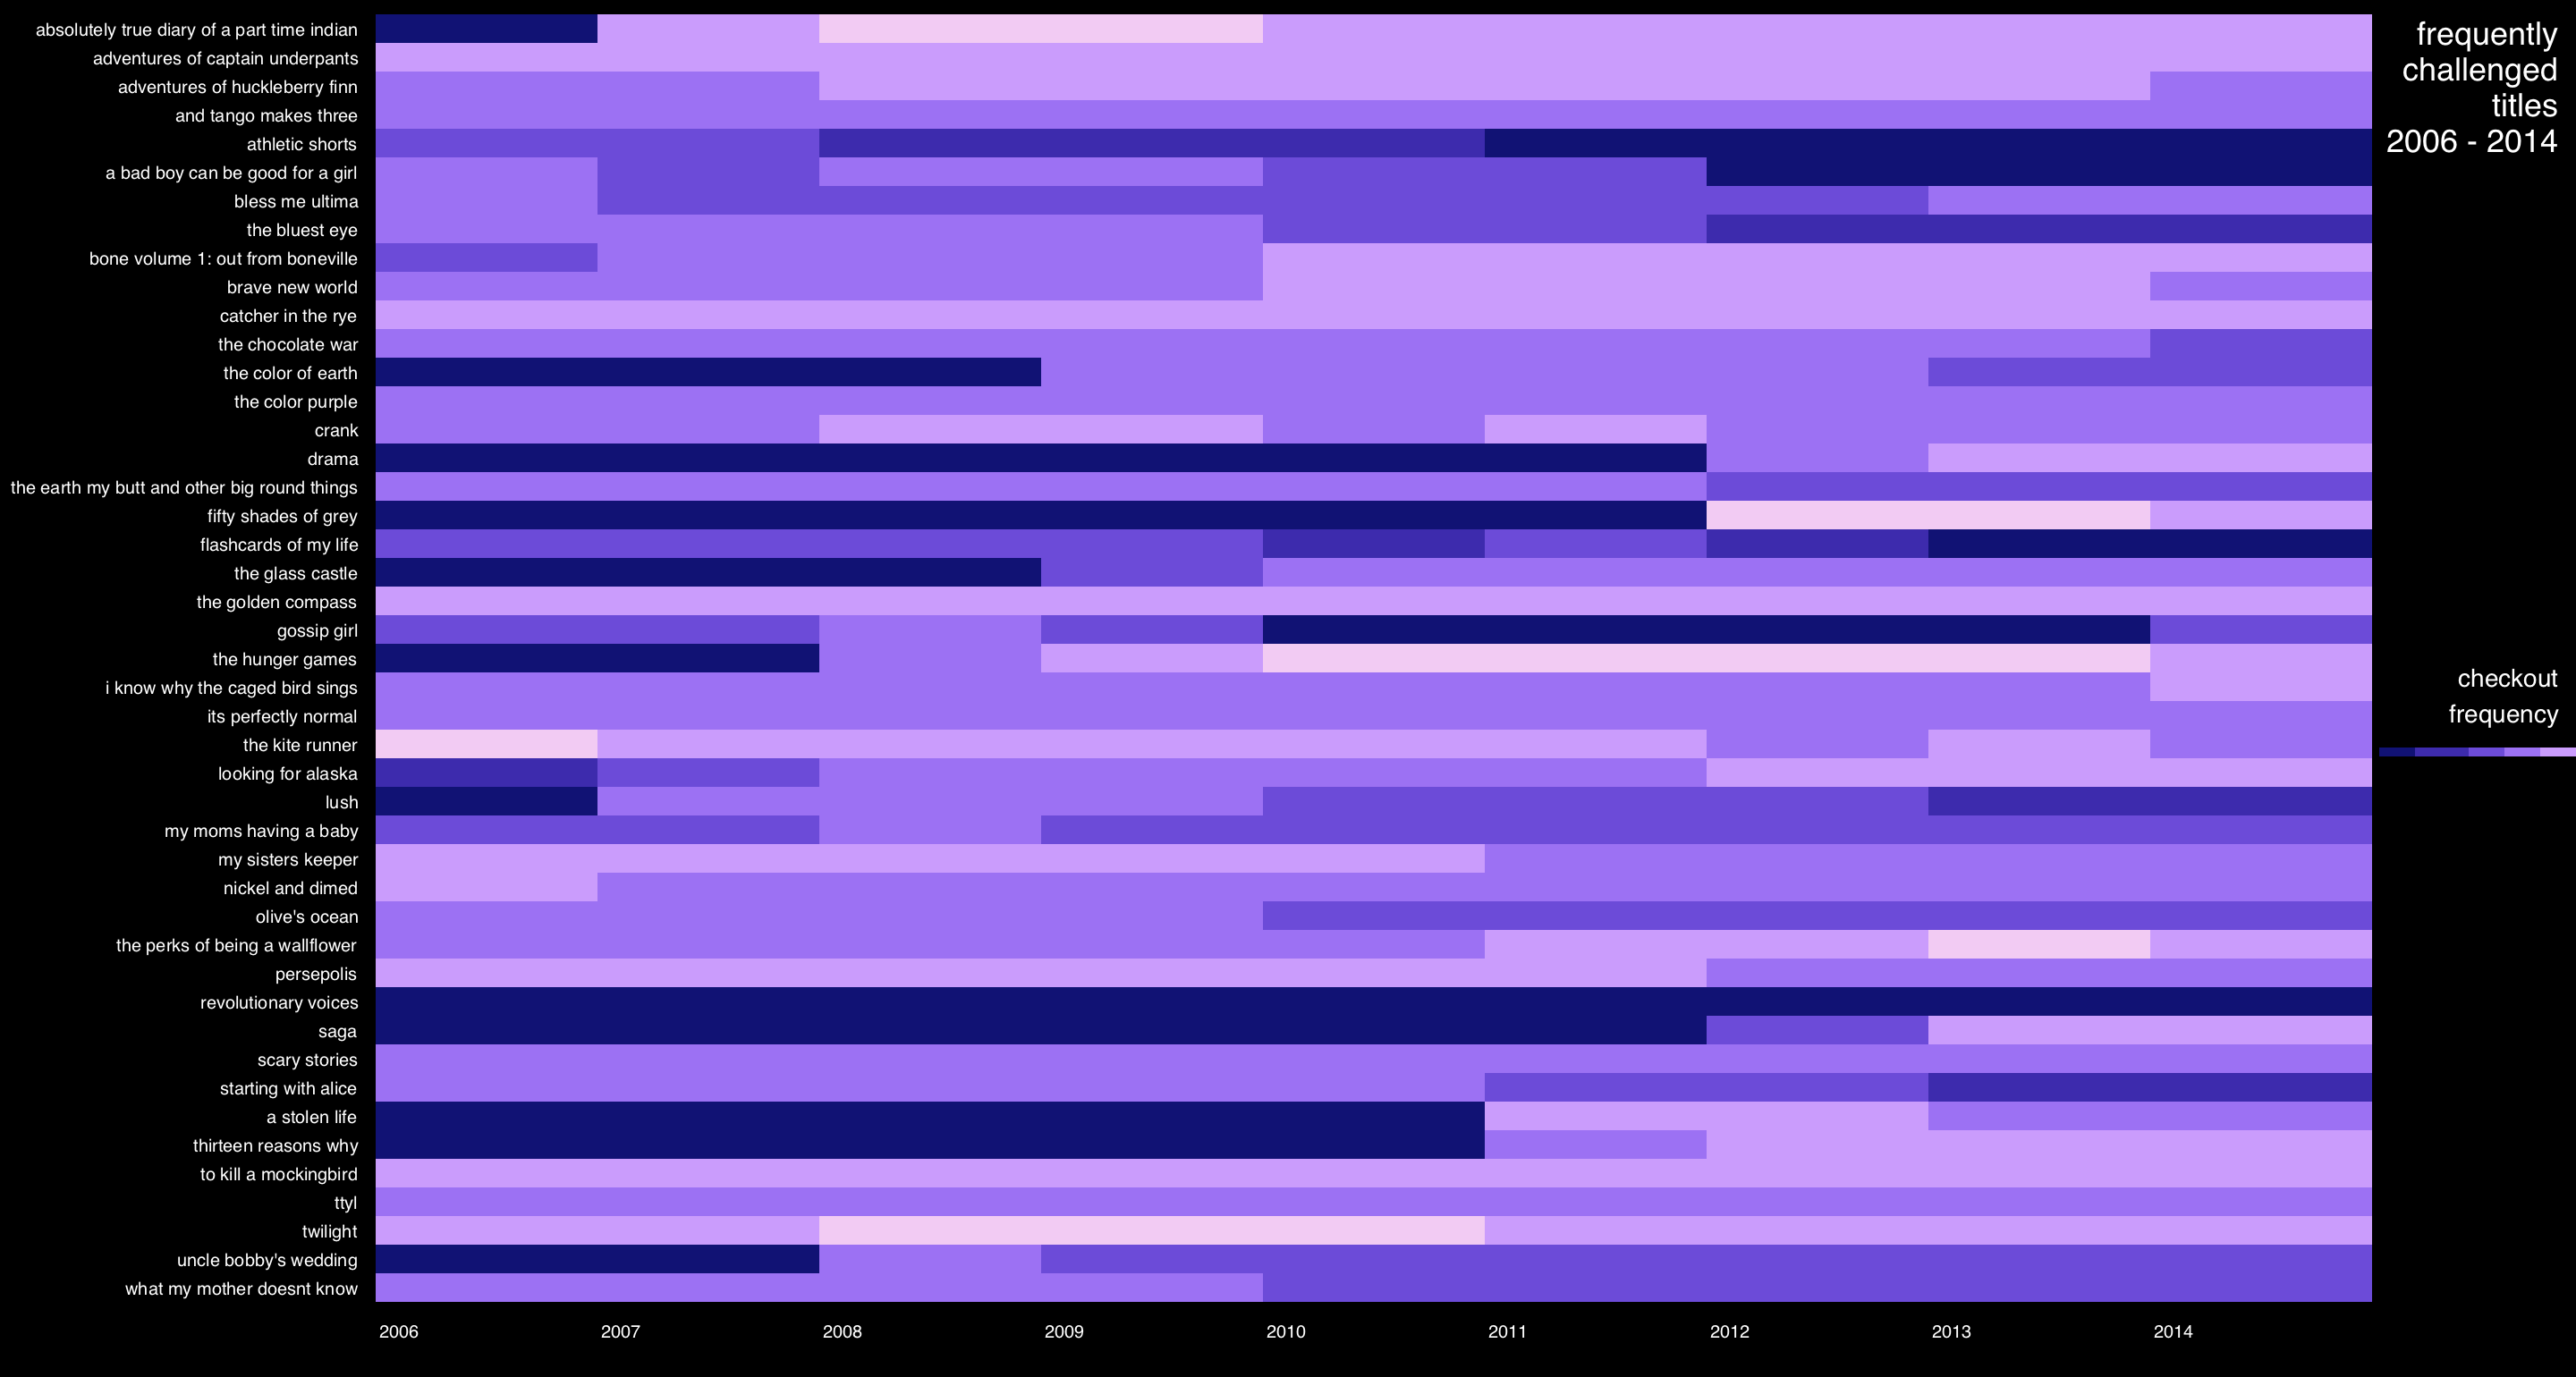
Additionally, I gave the user the option to visualize the data with rectangles or circles in the final iteration. This allowed for a greater sense of frequency and gave more volume to the visualization.
Code