Books and Technology
MAT 259, 2016
David Aleman
Concept
Technology continues to become apart of our lives a little more everyday. Just think about the smartphone in your pocket and the laptop you carry in your bag everywhere. The demand for engineers and computer scientists for future innovation has never been higher. With this in mind I wanted to looks into if the public of Seattle follow that same trend. Using MySQL I wrote queries that looked in to the checkout rates per year of specific Dewey Classes that include:
000 to 100 (Computer Science)
600 to 610 (Technology)
620 to 630 (Engineering)
740 to 741 (Graphic Arts)
776 to 777 (Computer/Digital Art)
000 to 100 (Computer Science)
600 to 610 (Technology)
620 to 630 (Engineering)
740 to 741 (Graphic Arts)
776 to 777 (Computer/Digital Art)
Query
SELECT
deweyClass AS Dewey,
SUM(CASE WHEN YEAR(checkOut) = 2006 THEN 1 ELSE 0 END) AS '2006',
SUM(CASE WHEN YEAR(checkOut) = 2007 THEN 1 ELSE 0 END) AS '2007',
SUM(CASE WHEN YEAR(checkOut) = 2008 THEN 1 ELSE 0 END) AS '2008',
SUM(CASE WHEN YEAR(checkOut) = 2009 THEN 1 ELSE 0 END) AS '2009',
SUM(CASE WHEN YEAR(checkOut) = 2010 THEN 1 ELSE 0 END) AS '2010',
SUM(CASE WHEN YEAR(checkOut) = 2011 THEN 1 ELSE 0 END) AS '2011',
SUM(CASE WHEN YEAR(checkOut) = 2012 THEN 1 ELSE 0 END) AS '2012',
SUM(CASE WHEN YEAR(checkOut) = 2013 THEN 1 ELSE 0 END) AS '2013',
SUM(CASE WHEN YEAR(checkOut) = 2014 THEN 1 ELSE 0 END) AS '2014'
FROM
spl3._rawXmlDataCheckOuts
WHERE
(deweyClass > 000 AND deweyClass < 100)
OR (deweyClass >= 600 AND deweyClass < 610)
OR (deweyClass >= 620 AND deweyClass < 630)
OR (deweyClass >= 740 AND deweyClass < 741)
OR (deweyClass >= 776 AND deweyClass < 777)
GROUP BY deweyClass
ORDER BY SUM(CASE
WHEN
(YEAR(checkOut) >= 2006 OR YEAR(checkOut) <= 2014)
THEN 1 ELSE 0
END) DESC
Preliminary sketches
When starting the project I always liked the idea of using size to reflect quantity. The sketch below is a simple mock up of what I hoped to achieve.

Process
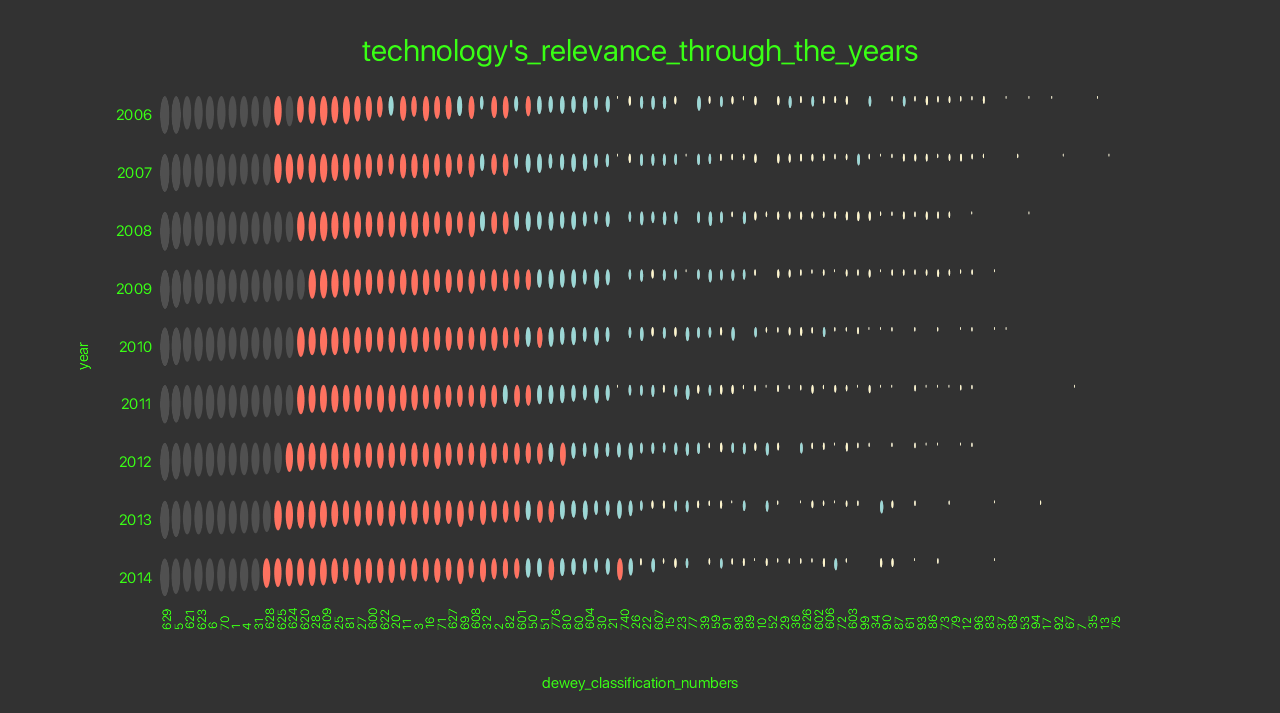
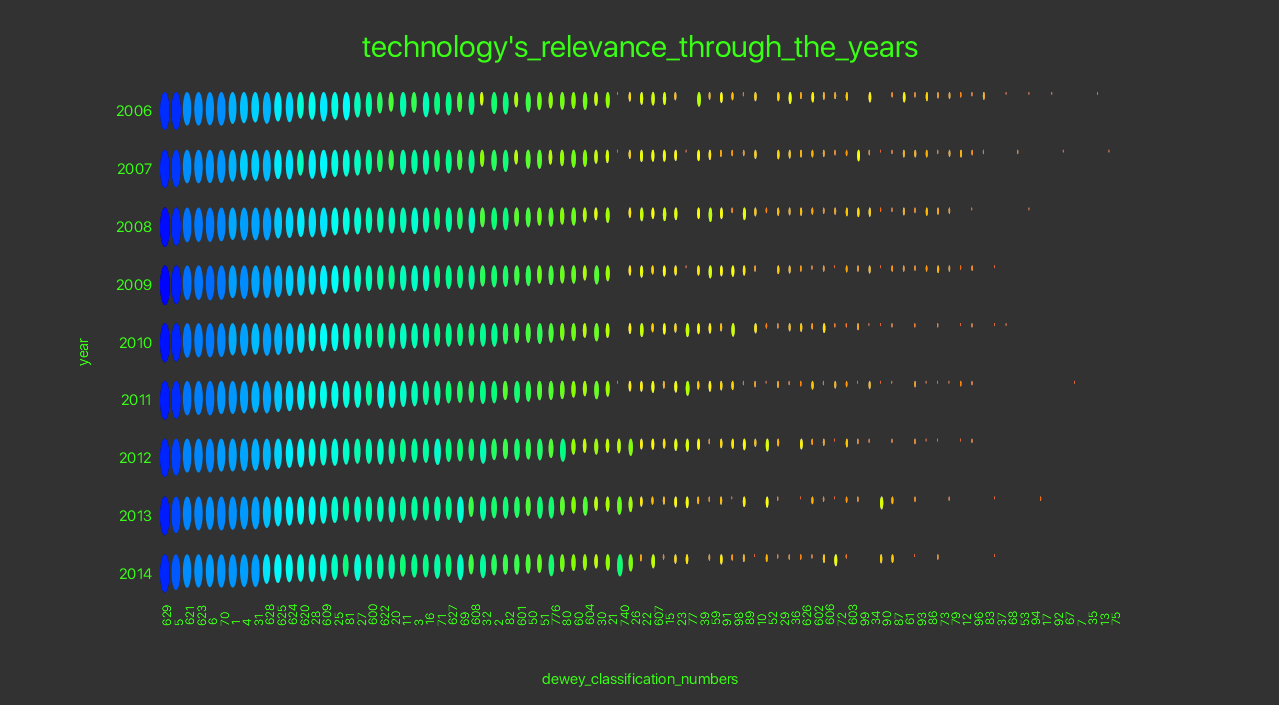
With this project the y-axis is the years from 2006 to 2015. The x-axis is the different Dewey Classes. The amount of checkouts for each of the Dewey Classes is reflected by the size of the ellipse shown in the data matrix as well as the color. The bigger the circle the more checkouts of books pertaining to the Dewey Class there is.
Final result
The visualization brings clarity to how many books that are related to technology are being checked out per year by the people of Seattle. The data reveals that as the years go by the public tends to check out books related to technology less frequently. This can be due to the fact that books, articles and other print related media is accessible online.
Here are a few shots of the final product.
This first image is using a greyscale colorscheme while the other two images that follow use a color scheme according to color map JPEG images that are included.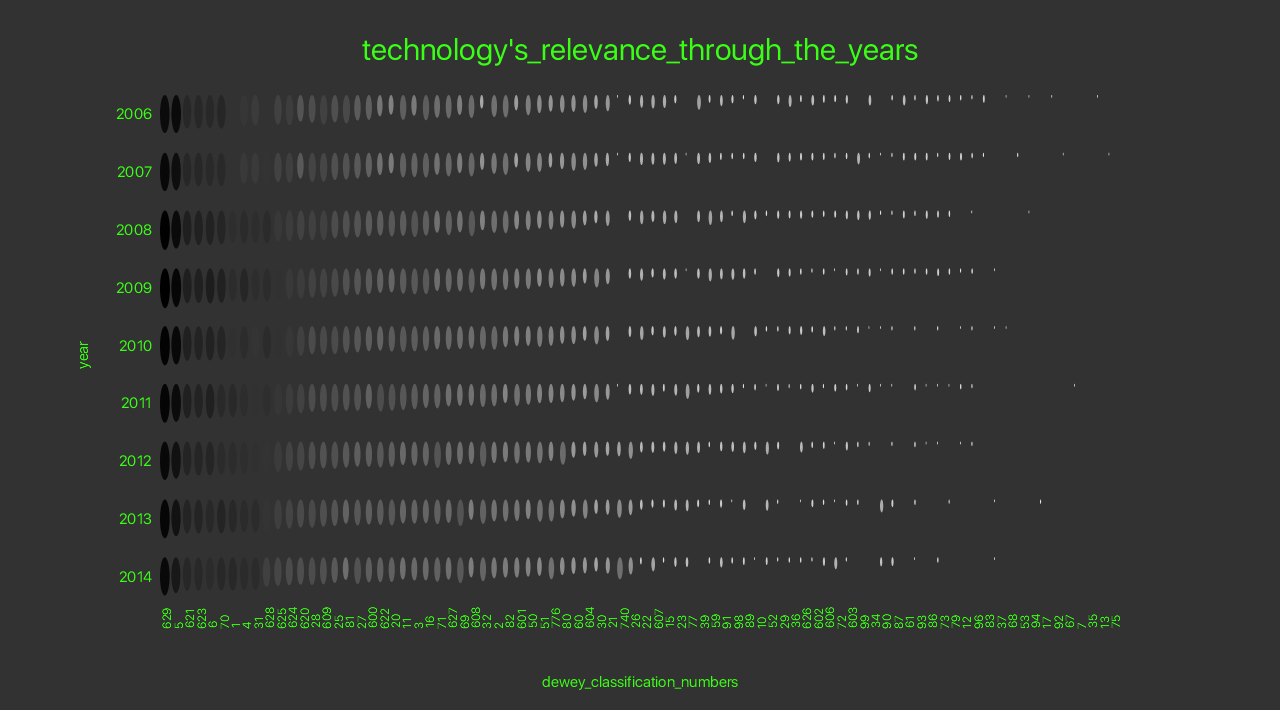
Here are a few shots of the final product.
This first image is using a greyscale colorscheme while the other two images that follow use a color scheme according to color map JPEG images that are included.
Code