Is The Sun Out ?
MAT 259, 2016
Ambika Yadav
Concept
Visiting a library is a recreational activity for some, academic pursuit for some and research for a few others. But whether we humans take the step ahead and go visit the library for these activities depends on a lot of factors. A major factor that I thought would play a crucial role in this decision at an individual level would be the weather.I wanted to see how the number of checkouts in Seattle Public Library ,which is dependent on the peoples’ presence in library is affected by weather conditions.
Query
The development of the query for this project was a complete process within itself. There was more data that had to be studied to get the right insight about the dependency of the checkouts on the weather conditions on those particular days in Seattle Public Library.
1. First I did a general analysis of grouping months into Summer, Spring, Fall and Winter months over the years 2006 to 2015 and found the number of checkouts for every season every year. This helped me understand the variations of checkouts over the seasons, but a more detailed analysis was what was required.
2. In the second iteration I tried to go over time on a monthly basis and see the number of checkouts every month to understand the dependency in more detail. This iteration helped getting a better insight on the checkouts, but the dependency on the weather was still not very clear ,as the weather conditions were still unknown.
3. Finally, I went on to analyse the number of checkouts on a daily basis over the past 10 years and compare it with the daily temperature and precipitation values extracted using pythons Beautiful Soup library from http://www.wunderground.com/.
SELECT
date(CheckOut) AS Date,
COUNT(Date(CheckOut)) AS TotalCheckouts,
SUM(CASE
WHEN deweyClass = ' ' THEN 1
ELSE 0
END) AS 'Fiction Items',
SUM(CASE
WHEN deweyClass != ' ' THEN 1
ELSE 0
END) AS 'Non-Fiction Items',
FROM
spl3._rawXmlDataCheckOuts
GROUP BY date
ORDER BY date
LIMIT 3700;
This data was then combined with the weather data extracted from external sources using hte following query.
SELECT Assign1.library_data.Date as Date ,
Assign1.library_data.TotalCheckouts as TotalCheckouts ,
Assign1.weather_temp.Average_Temp as Average_Temp
FROM Assign1.library_data
LEFT JOIN Assign1.weather_temp
ON Assign1.library_data.date=Assign1.weather_temp.date
ORDER BY Assign1.library_data.Date
Preliminary sketches
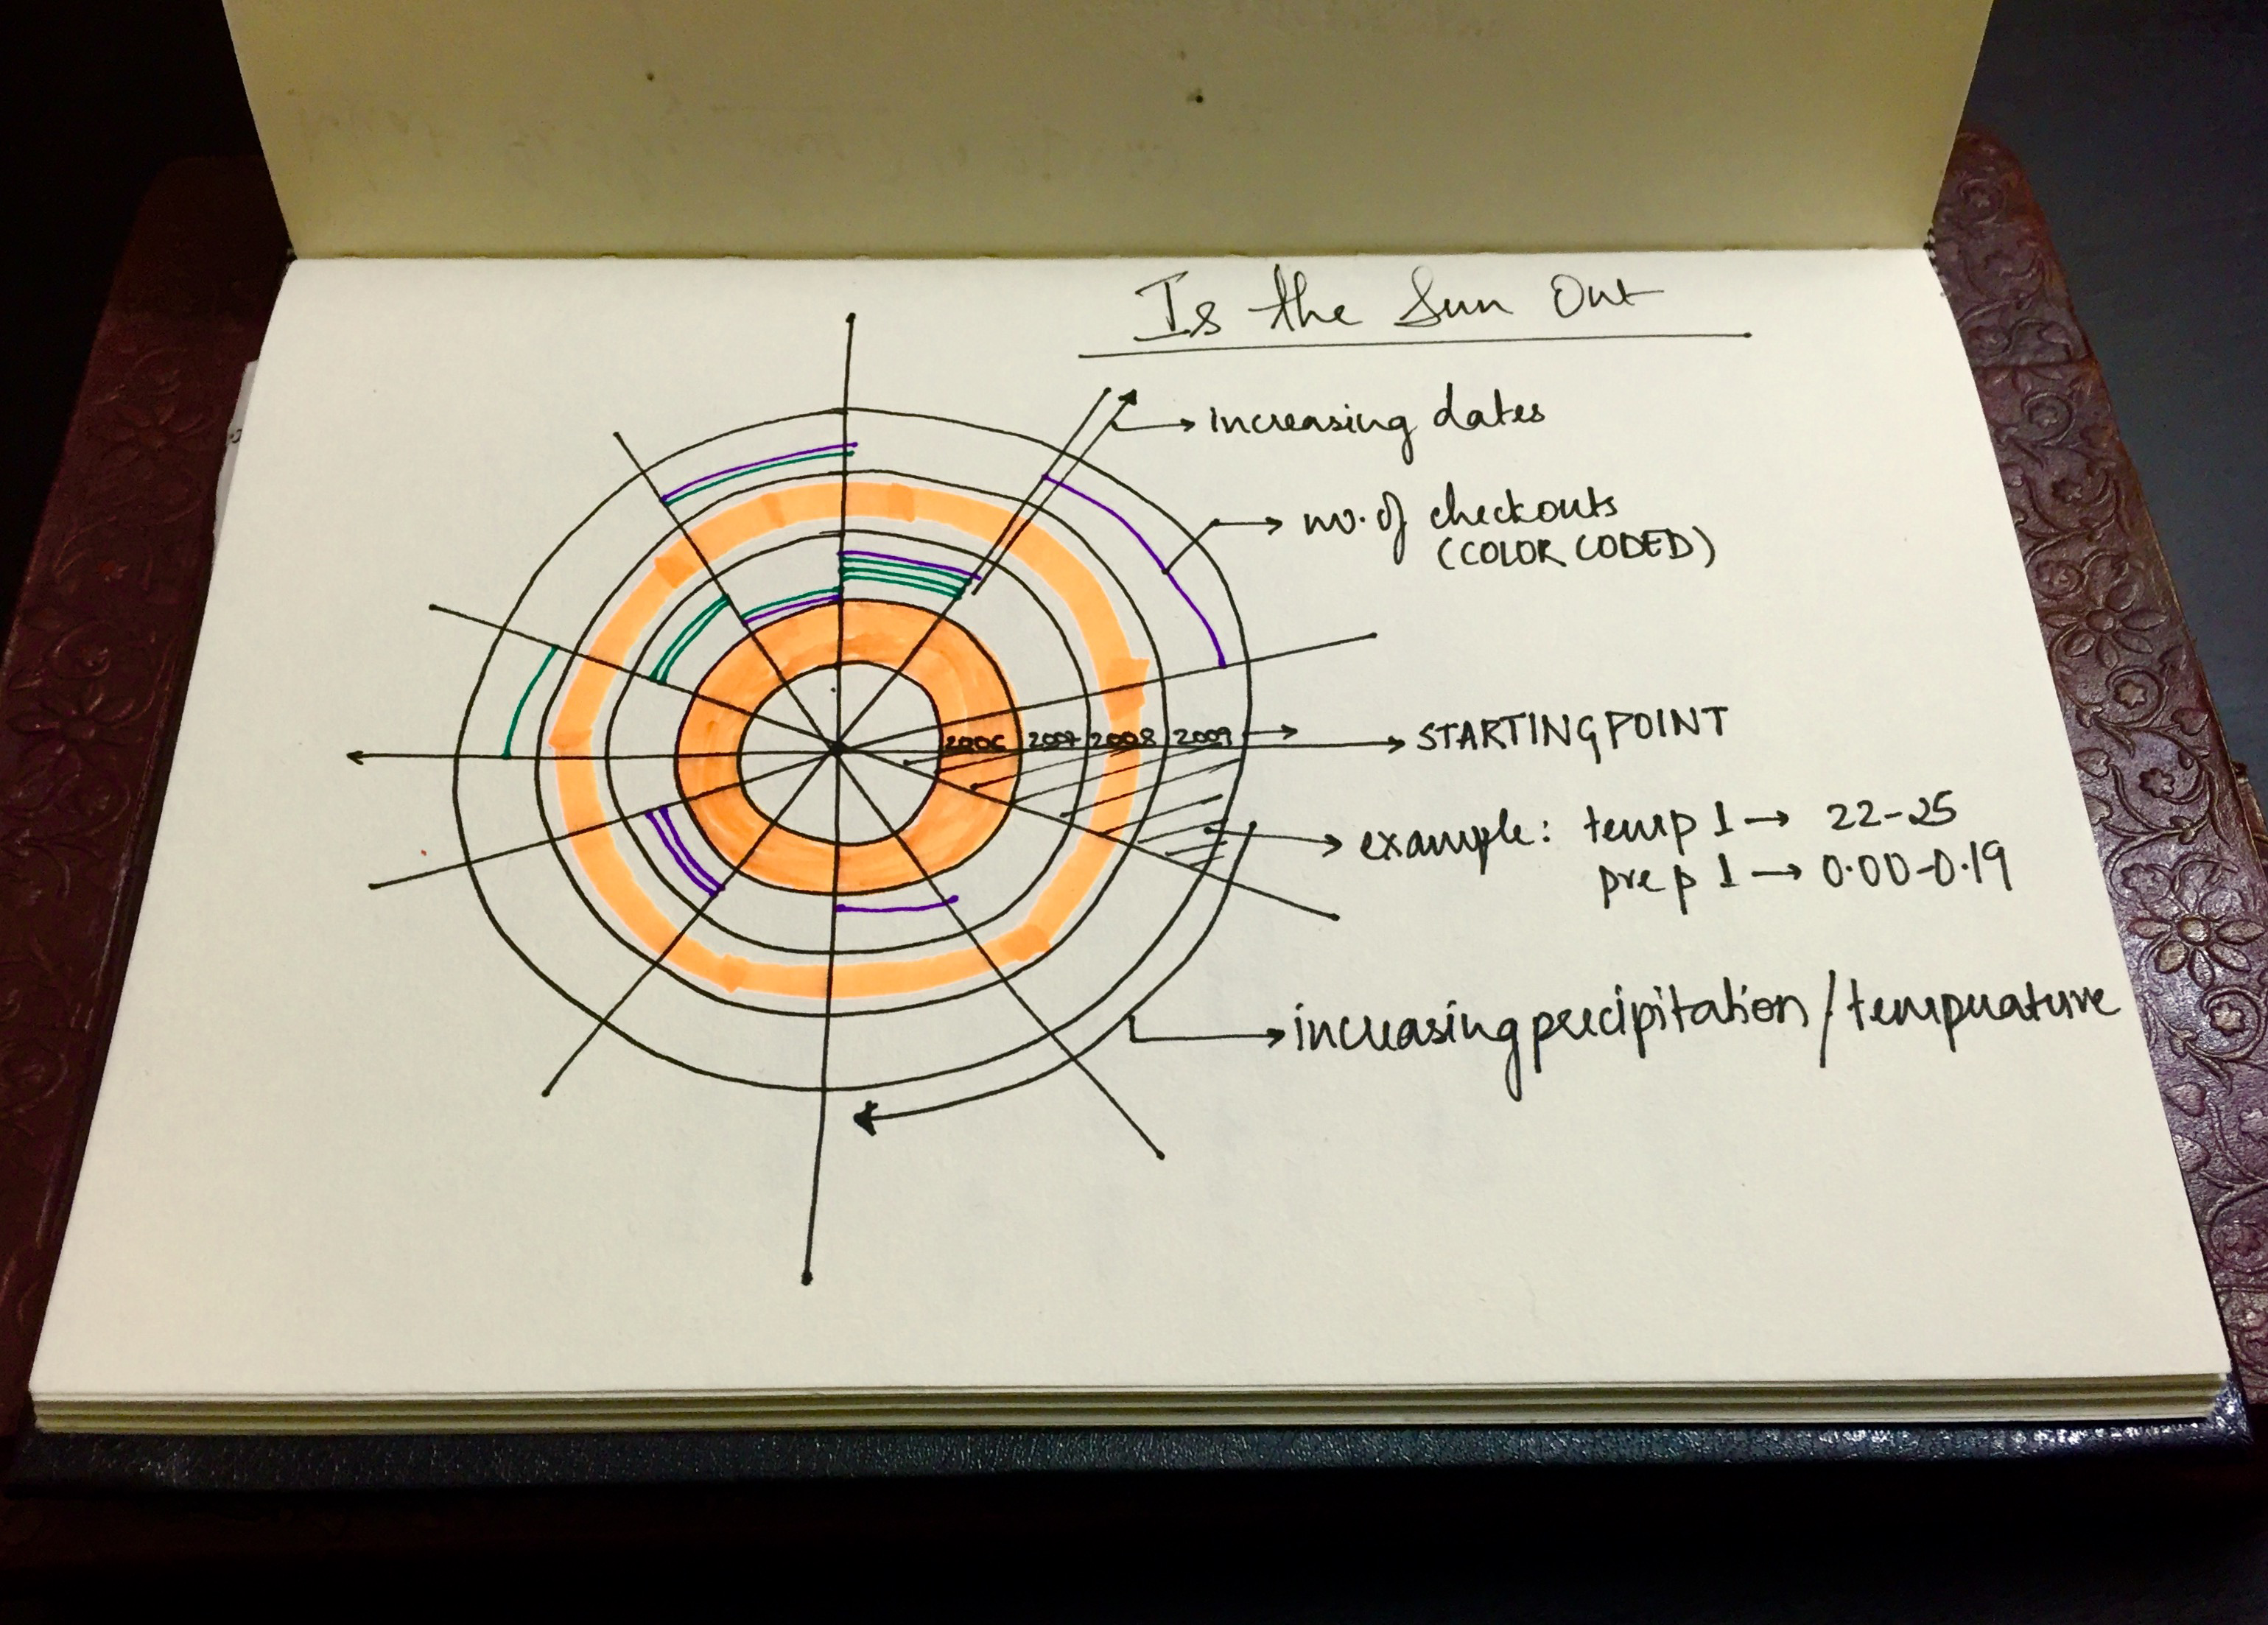
For the purpose of visualising this data I had the idea of putting them in a circular format by utilising concentric circles and using only certain parts of the circles.
The time axis corresponds to the radius of the concentric circles. The smallest radius circle closest to the center is for 1st January 2006 and the largest radius circle farthest away from the center is for 31 December 2015.
The weather conditions which is the temperature and precipitation are depicted by the angle. As we move in an anticlockwise direction from the center, we move in a direction of increasing precipitation or temperature.
Process
To achieve this visualisation I utilised the arc function in processing.
"arc(a_centerx, b_centery, c_radiusx, d_radiusy, start_angle, stop_angle)"
The first two parameters (a_centerx,b_centery) for all the data points were the same ,as each data point corresponds to the concentric circles of the same radius.
The third and fourth parameters (c_radiusx,d_radiusy) were mapped to the dates of the checkouts for each datapoint.
The final two parameters (start_angle,stop_angle) were mapped to weather conditions. Each set of start_angle and stop_angle corresponded to a set of temperature or precipitation values. These values increase as we move in the anticlockwise direction.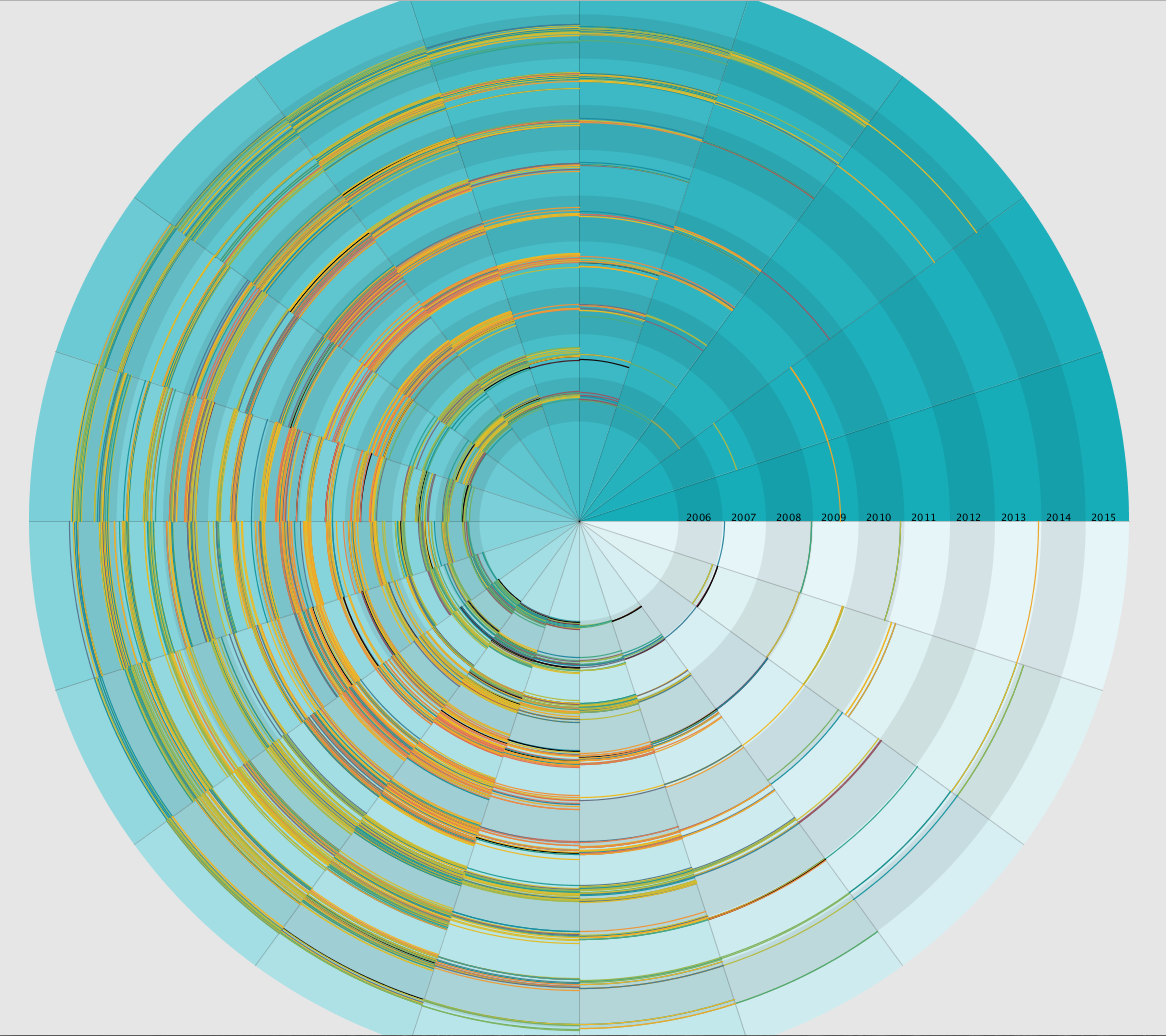
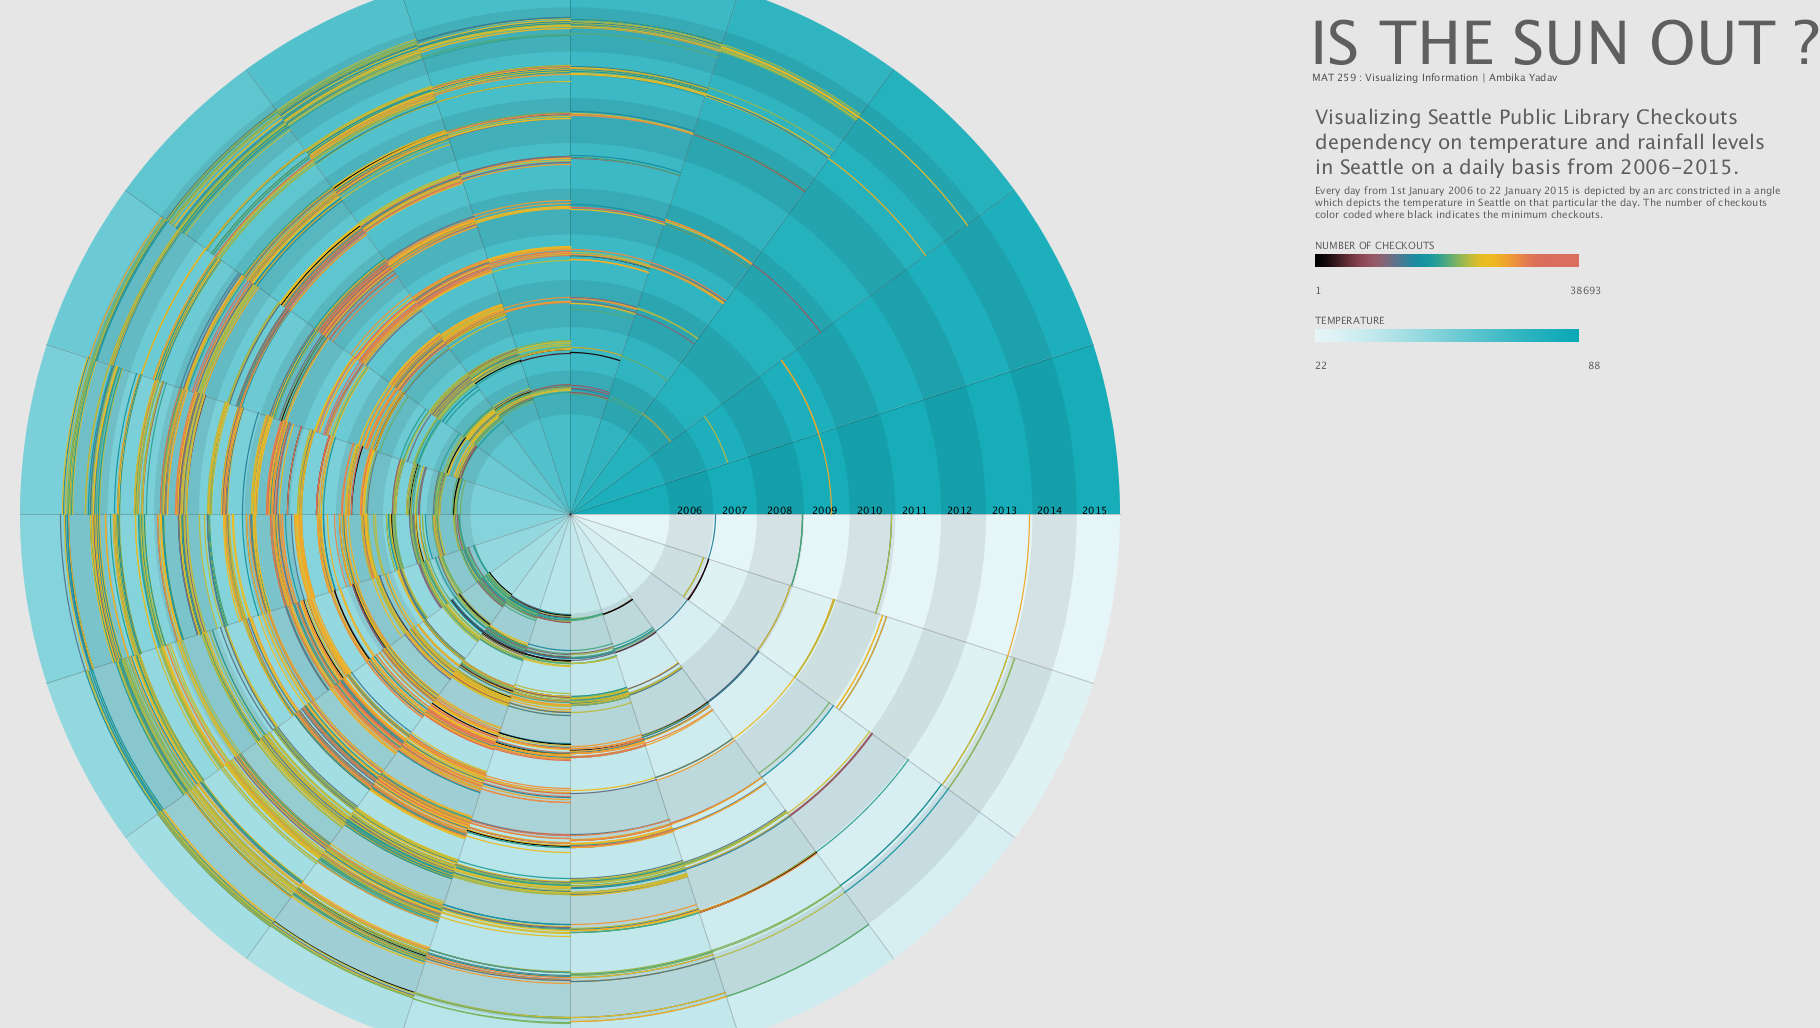
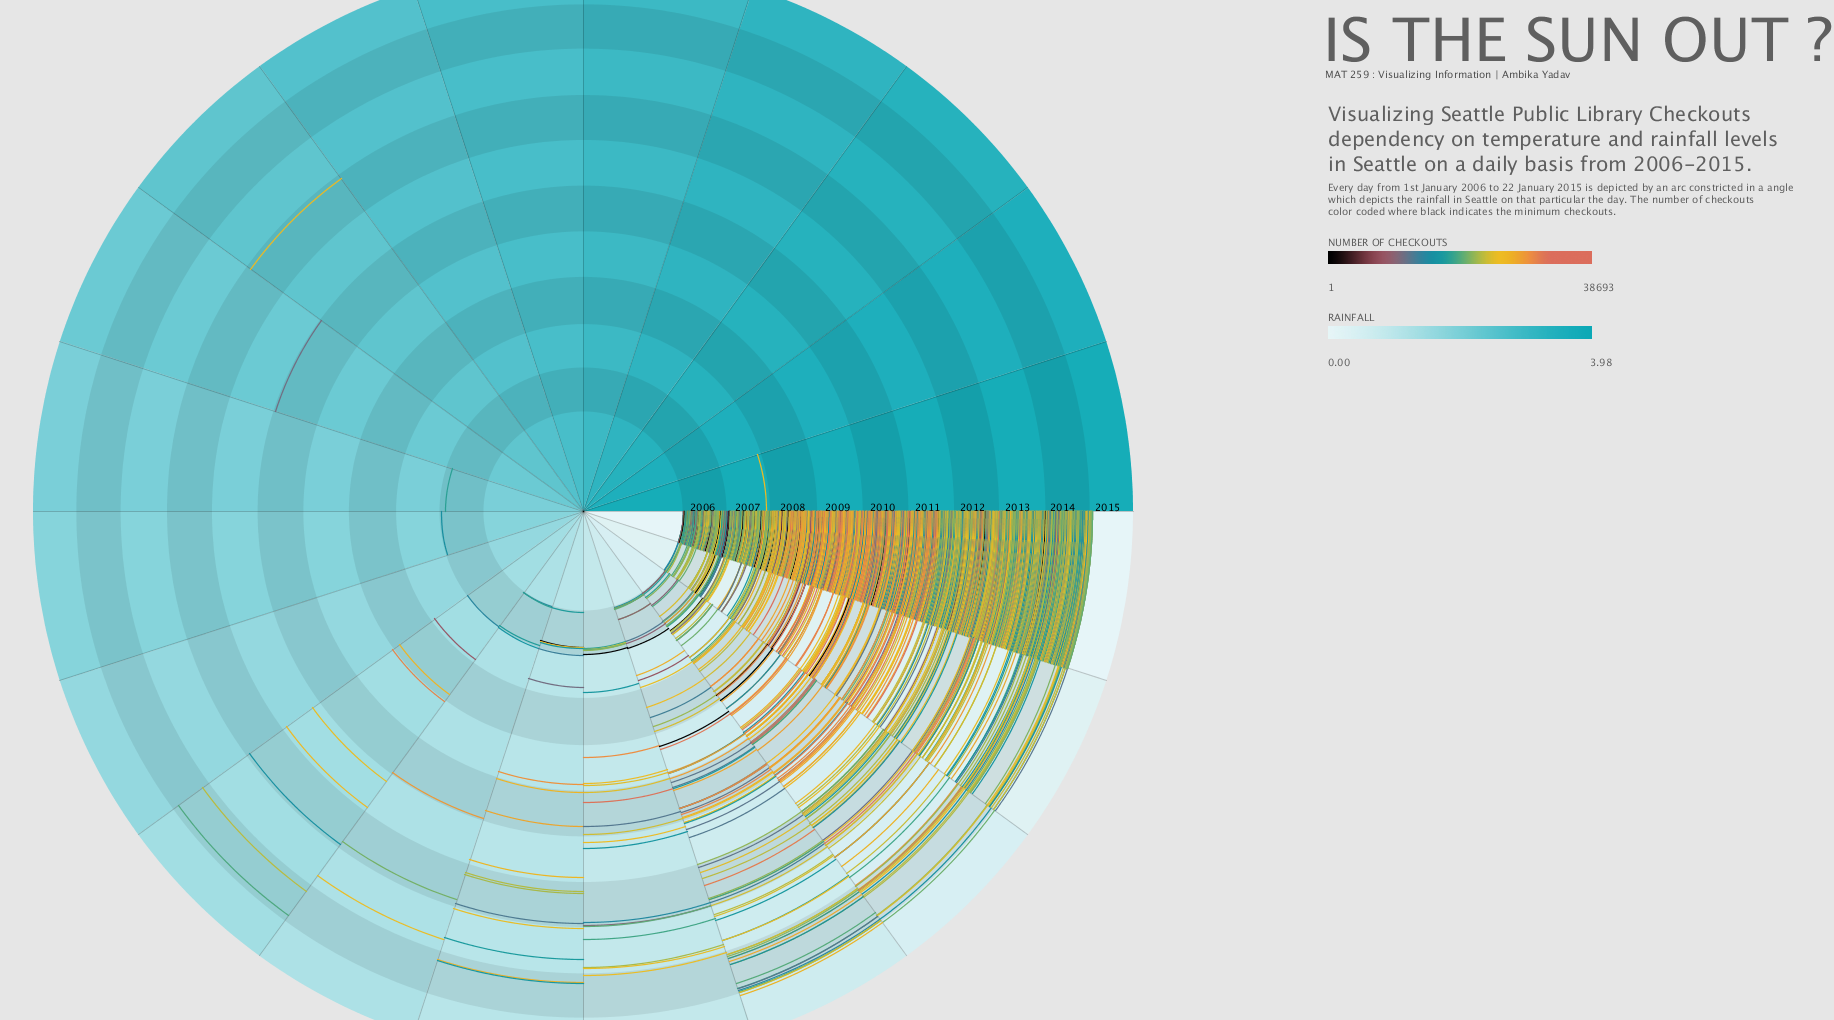
Final result
Finally, the dependency of number of checkouts with weather conditions could be observed . One screen showed the dependency with the temperature and another with precipitation.
Code
All work is developed within Processing
Different views (dependency on temperature and precipitation) can be seen by pressing the key 'N' on keyboard. Source Code + Data
Different views (dependency on temperature and precipitation) can be seen by pressing the key 'N' on keyboard. Source Code + Data