Instagram Map - API Correlation
MAT 259, 2015
Rodger (Jieliang) Luo
Concept
This project is working with live data from Instagram, which is an online mobile photo and video sharing platform. Everyday, thousands of images are uploaded to the website, and each image is tagged by several keywords associated with the image.
In this project, I'm particularly curious about the numerous information behind a keyword. For example, when people upload images tagged with "China", what are those people? Where are they? And what kind of message they want to send?
In this project, I'm particularly curious about the numerous information behind a keyword. For example, when people upload images tagged with "China", what are those people? Where are they? And what kind of message they want to send?
Query
The project correlated with three APIs from Instagram, Tag API, Tag Count API, and User APT.
Tag API: String tagSearch = "https://api.instagram.com/v1/tags/" + keyword + "/media/recent?access_token=" + API;
Tag Count API: String mediaCount = "https://api.instagram.com/v1/tags/" + tagName[i][j] + "?access_token=" + API;
User API: String userInfo = "https://api.instagram.com/v1/users/" + userId[i] + "/?access_token=" + API;
Preliminary sketches
As shown from draft below, each exploration begins with a keyword. With TagSearch API, the most recent uploaded images containing the keyword will be found out. For each image, we will have it's geolocation, all the other tags, user id.
With all the tags of all the images, we can sort those tags according to their popularity by applying TagCount APIs, so it will tell what they were really talking about while they were talking about China or any other keywords. Also, with User API, we will get user information, such as the amount of posts, follows, and numbers of being followed.
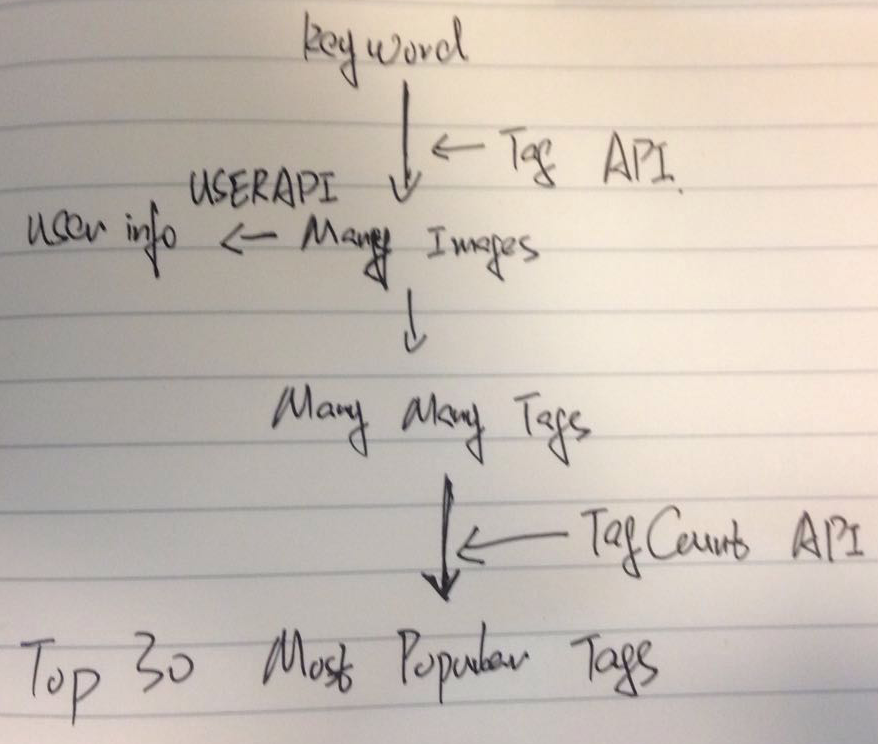
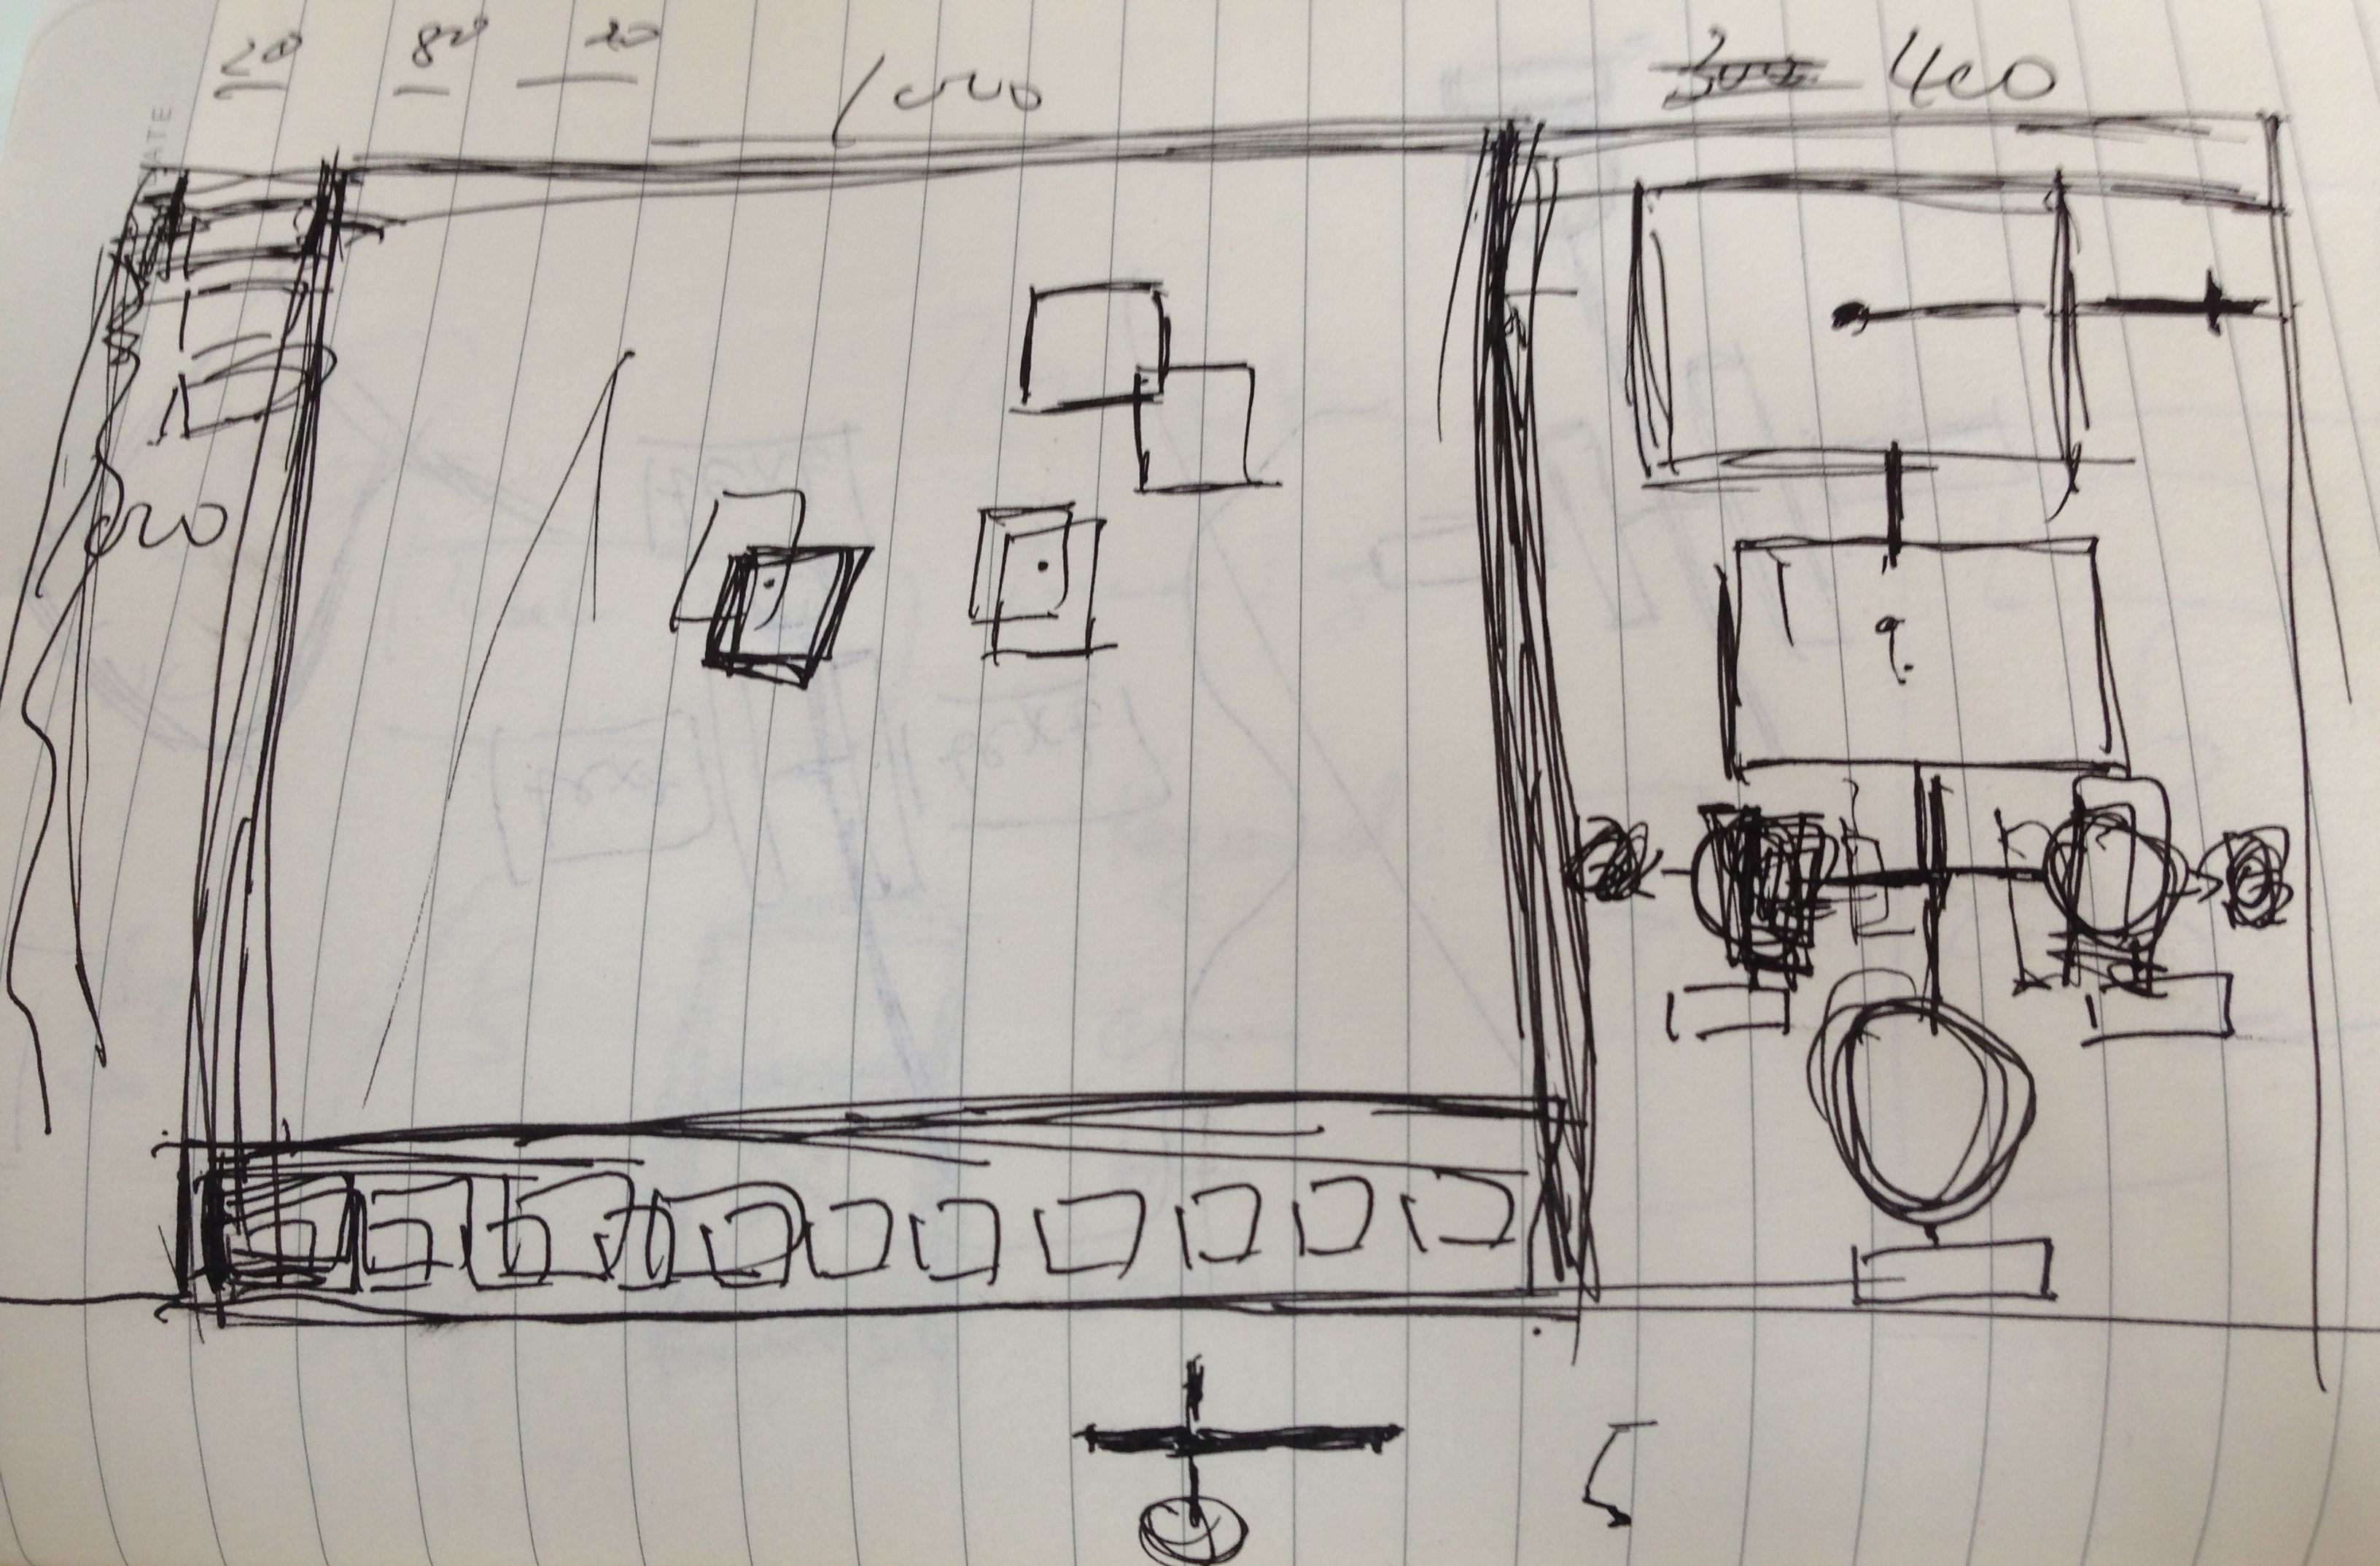
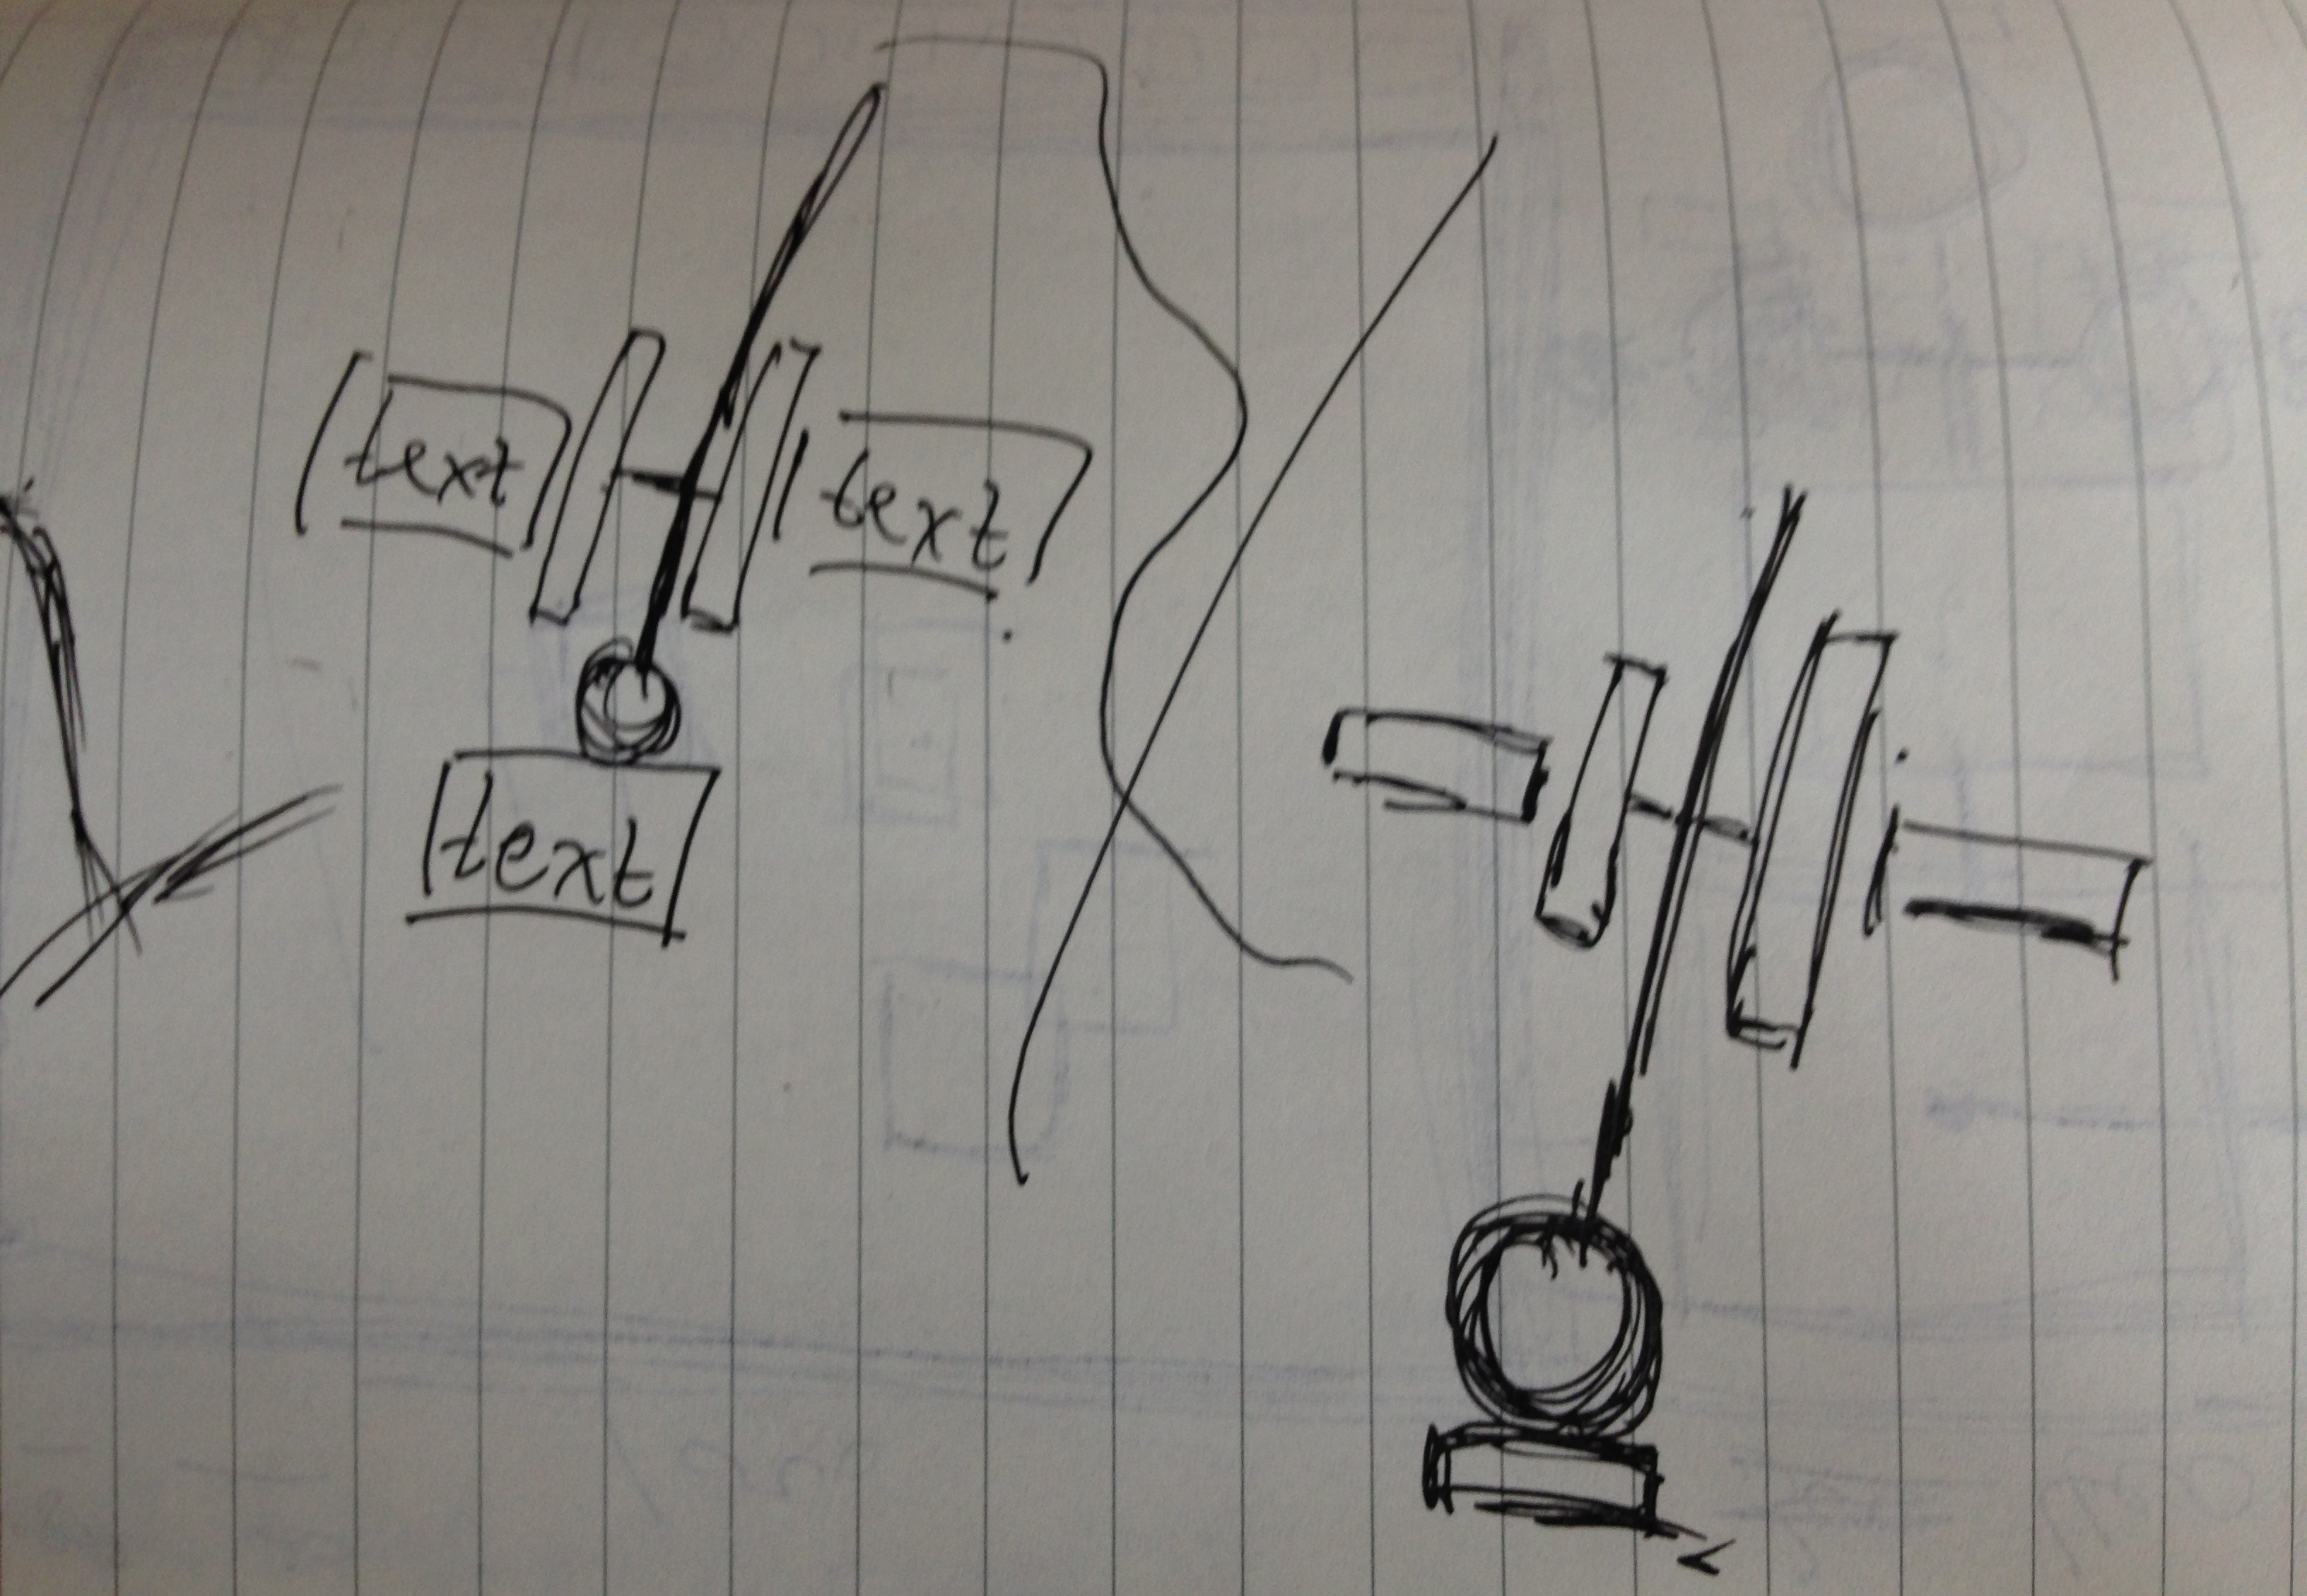
With all the tags of all the images, we can sort those tags according to their popularity by applying TagCount APIs, so it will tell what they were really talking about while they were talking about China or any other keywords. Also, with User API, we will get user information, such as the amount of posts, follows, and numbers of being followed.
Process
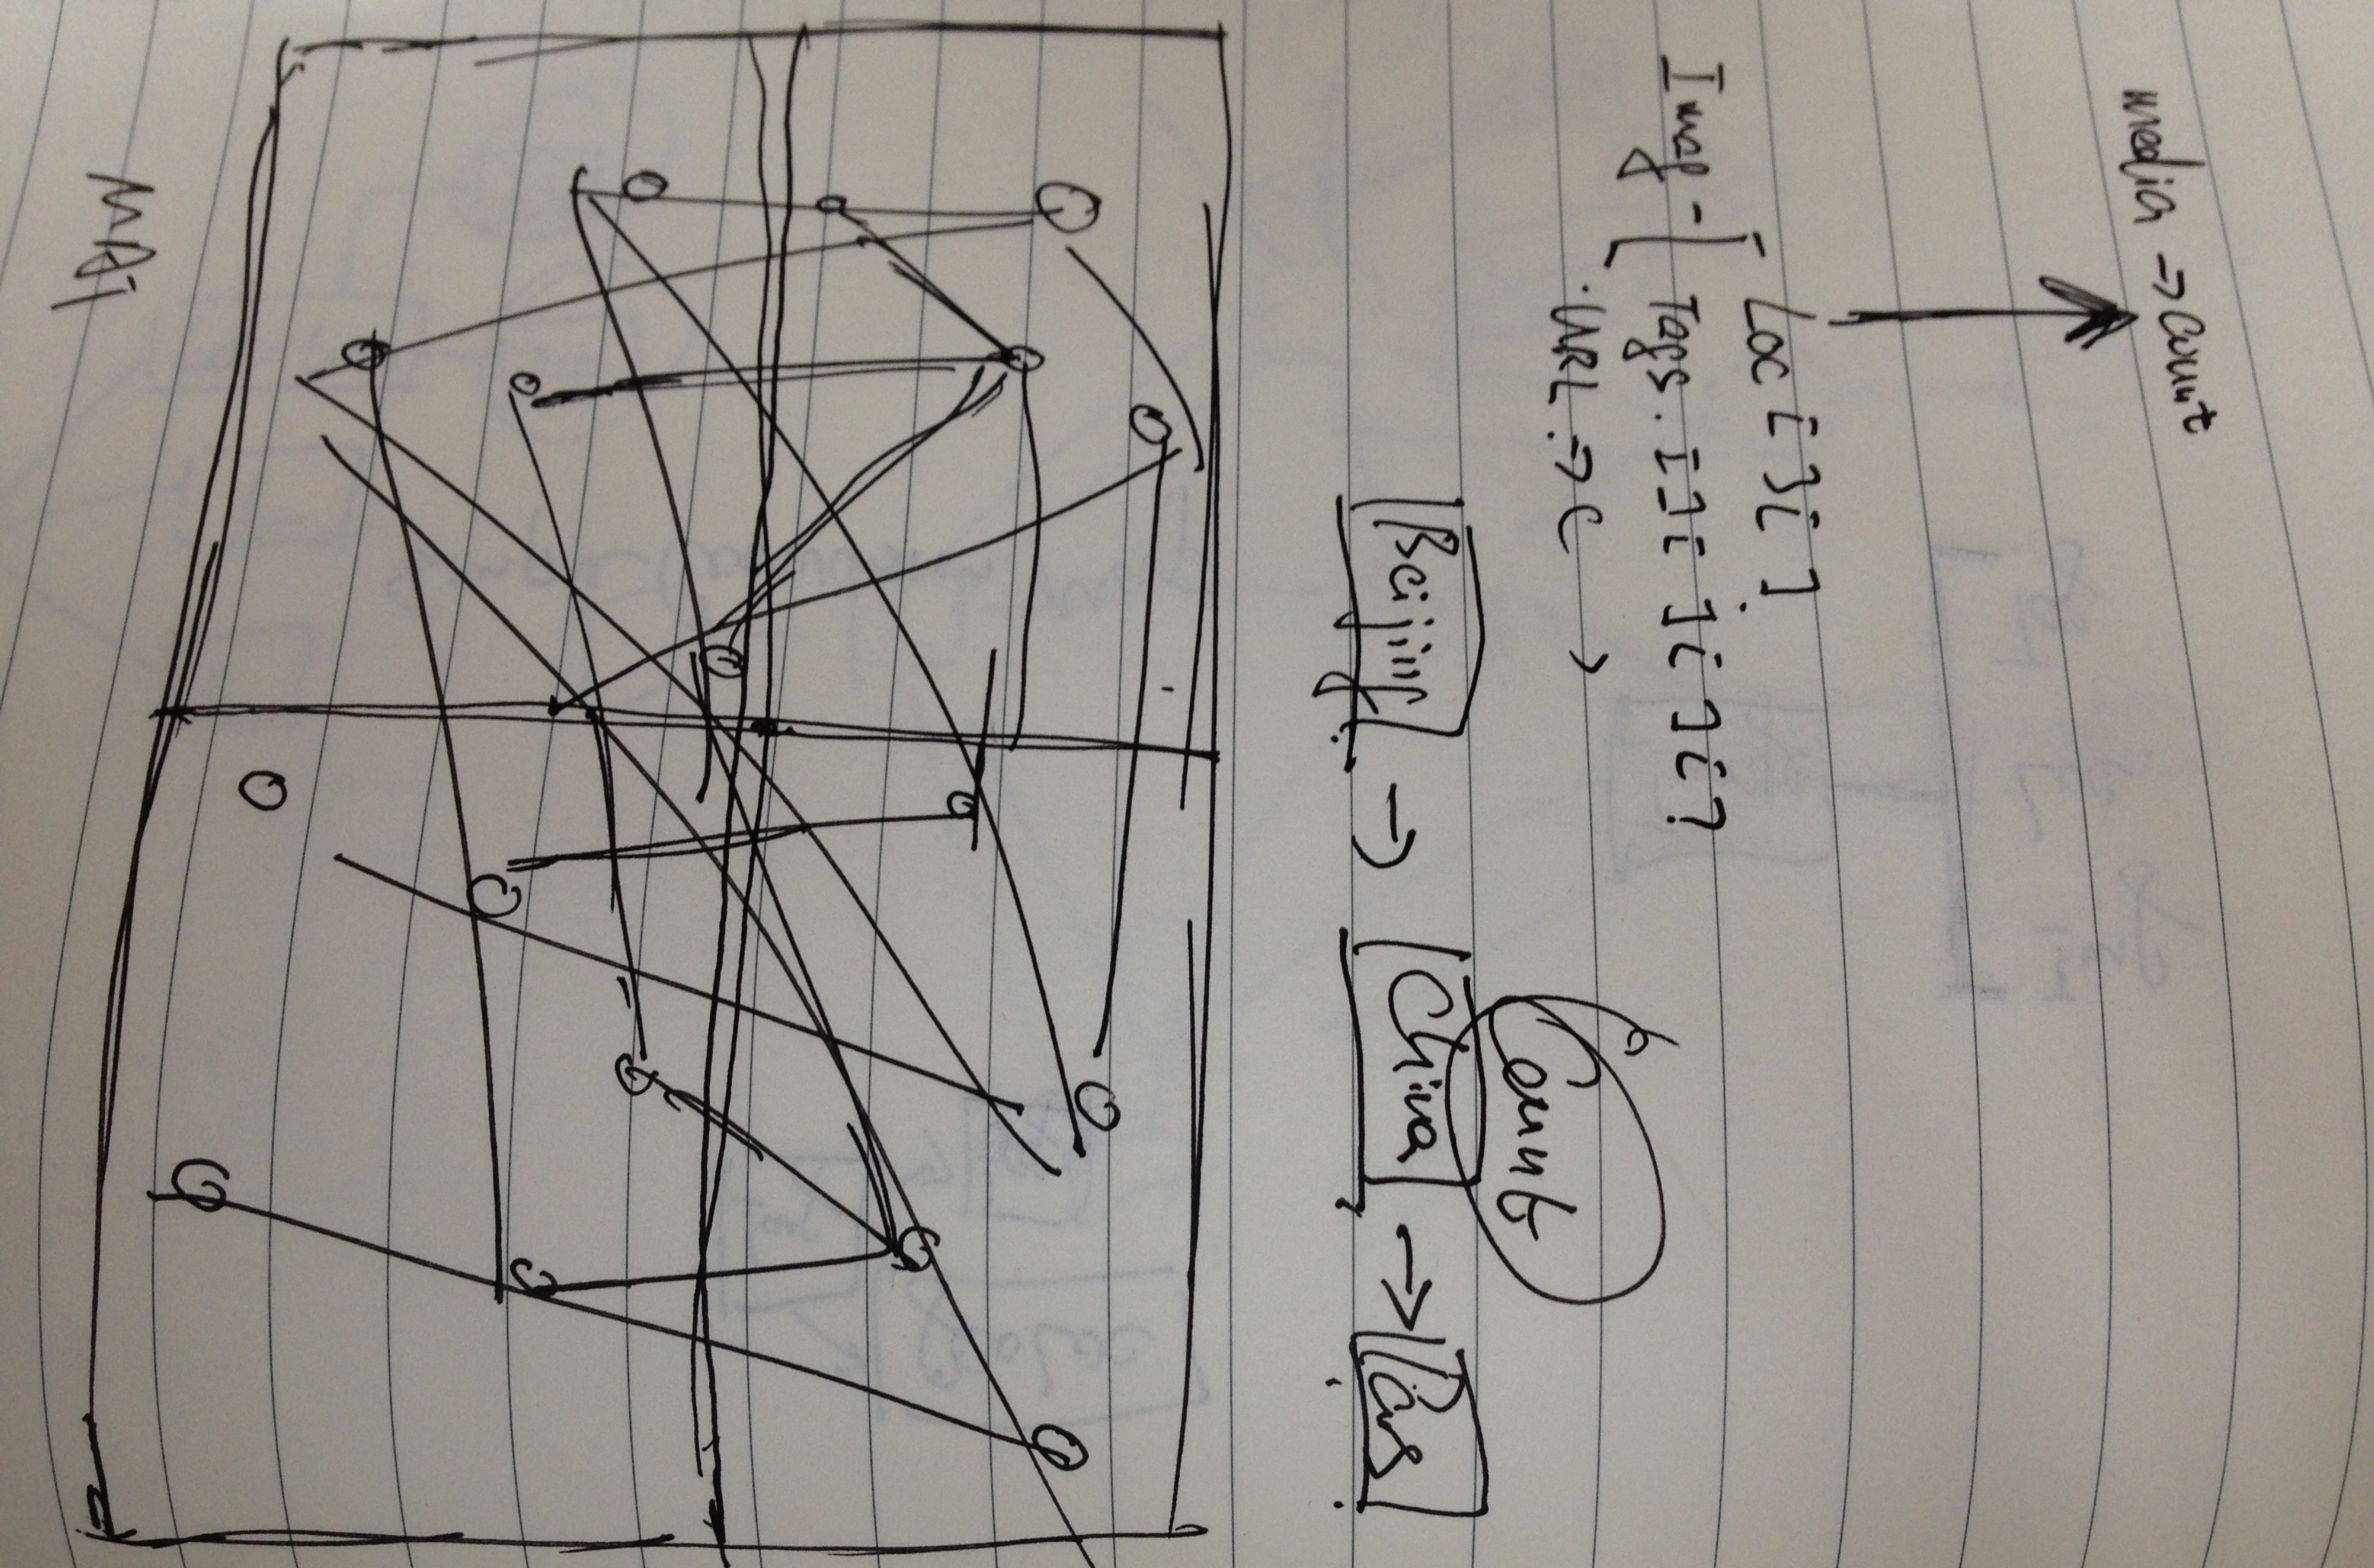
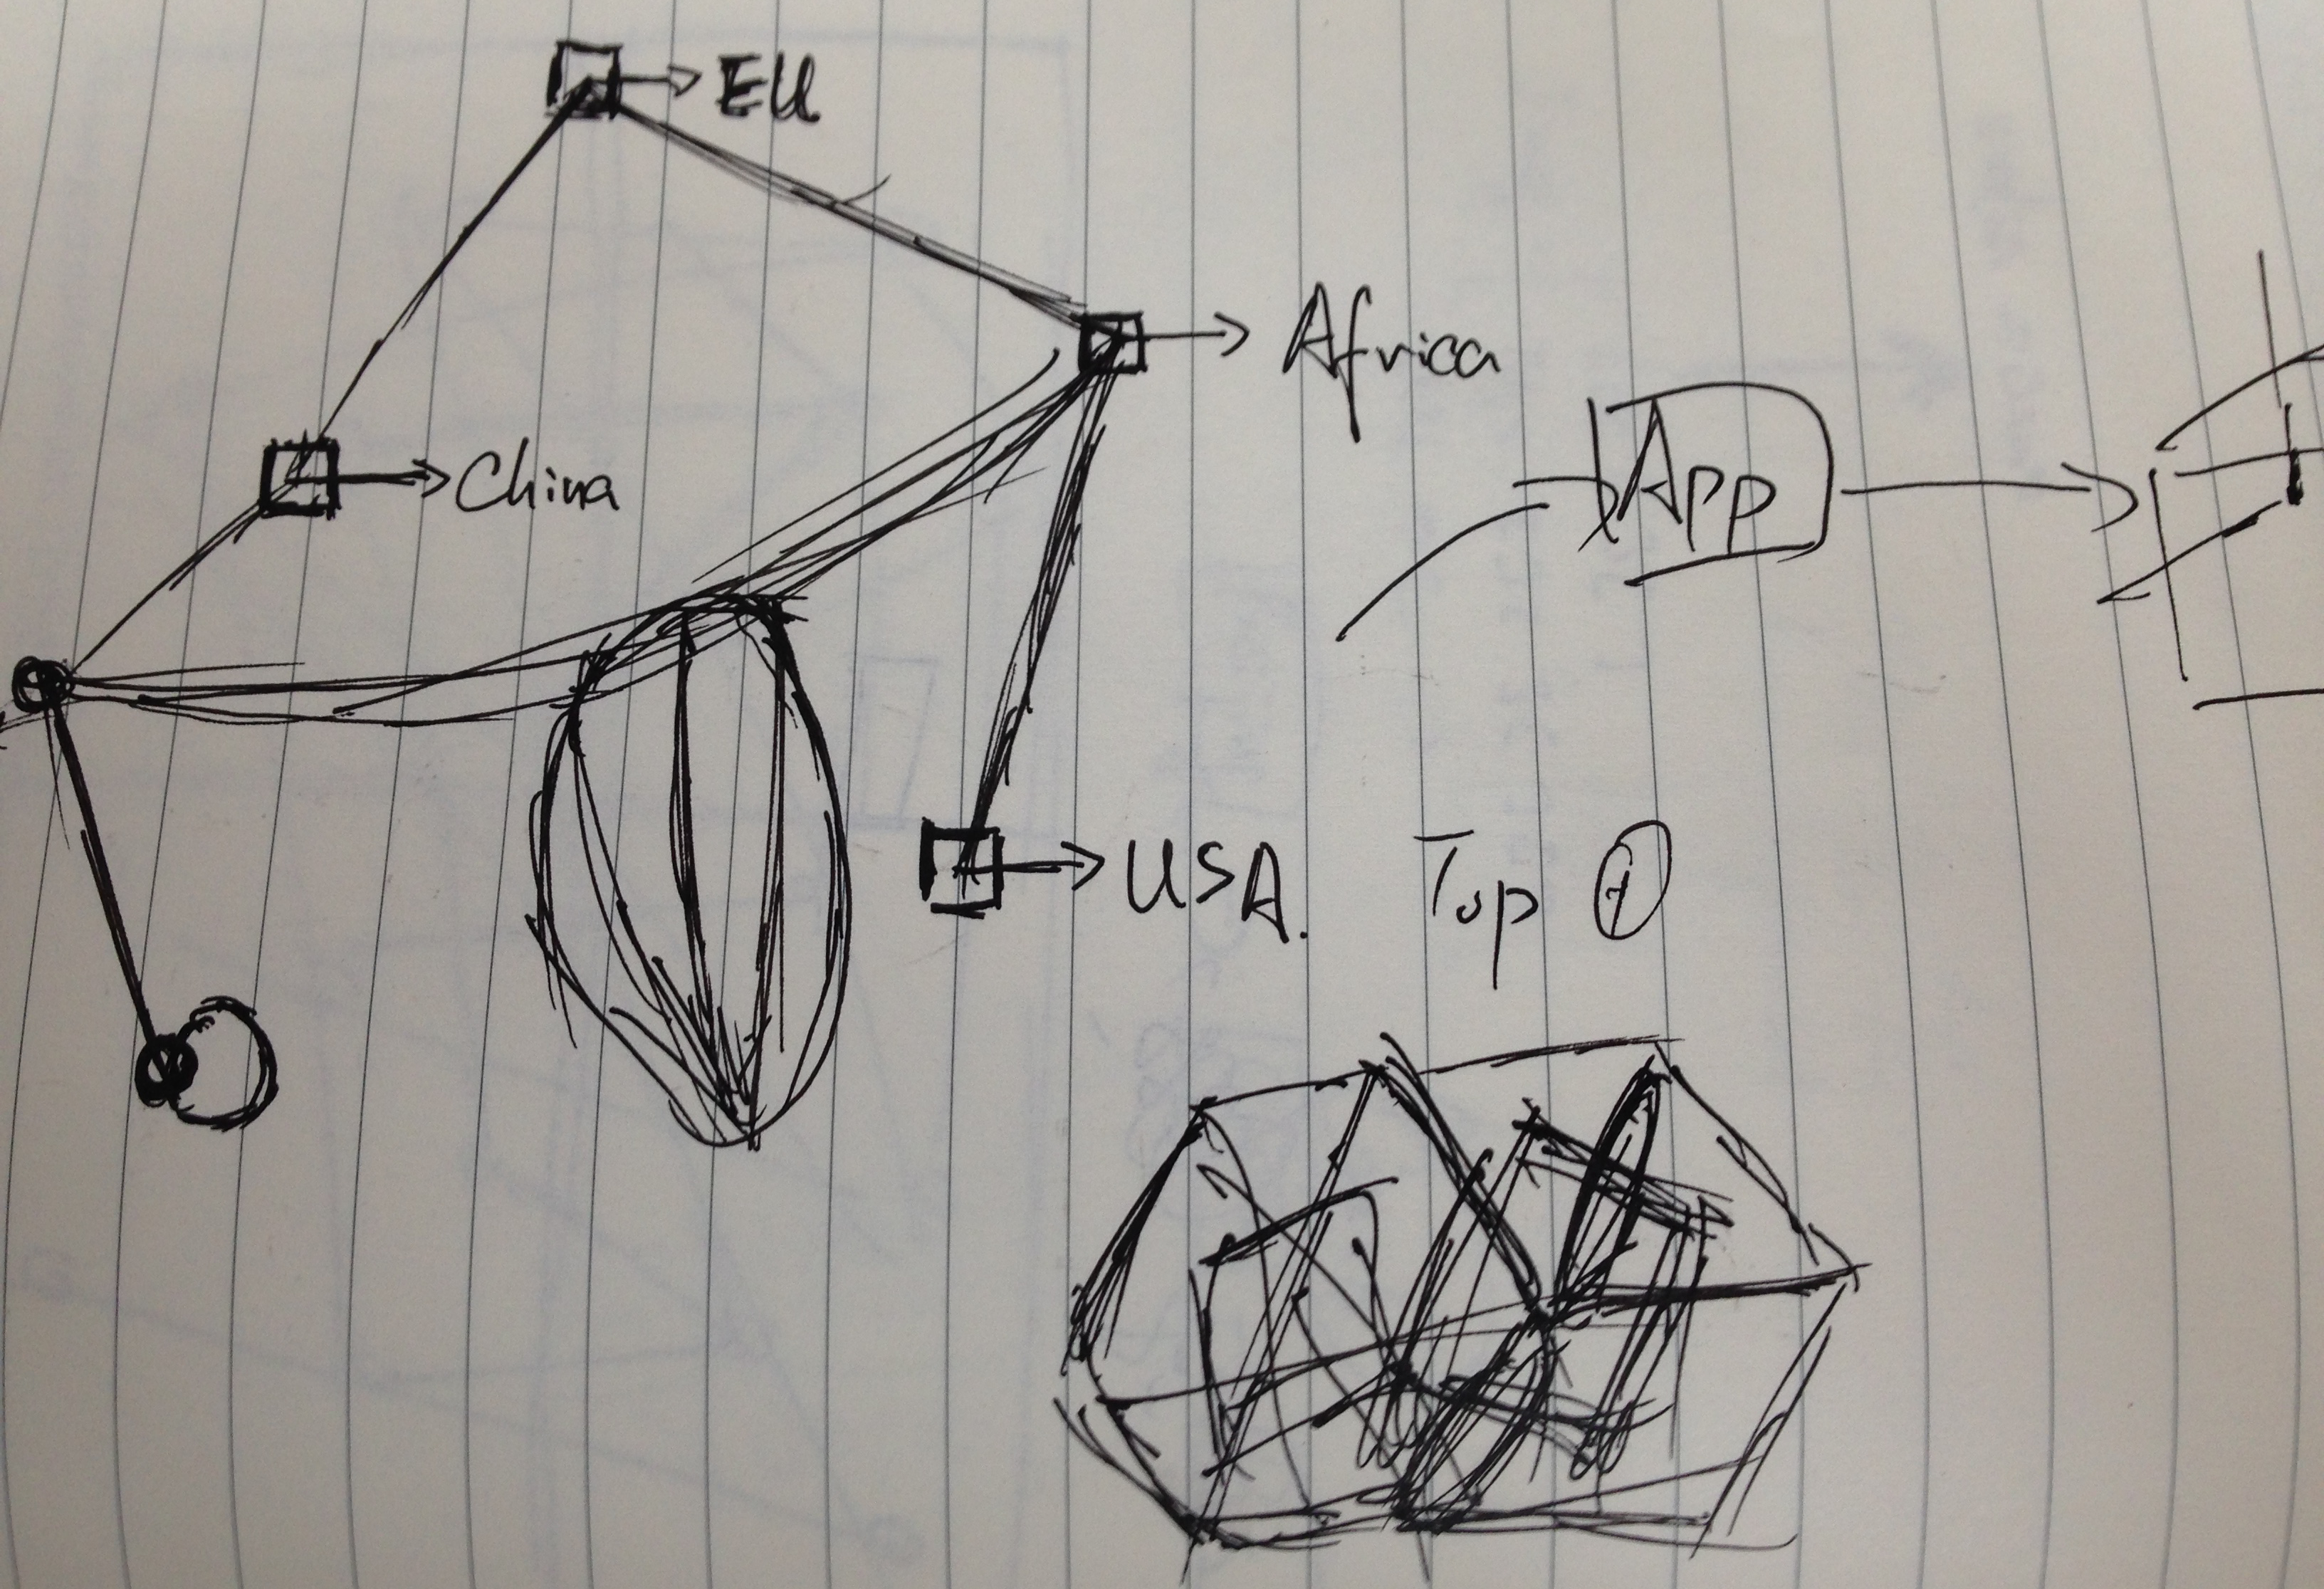
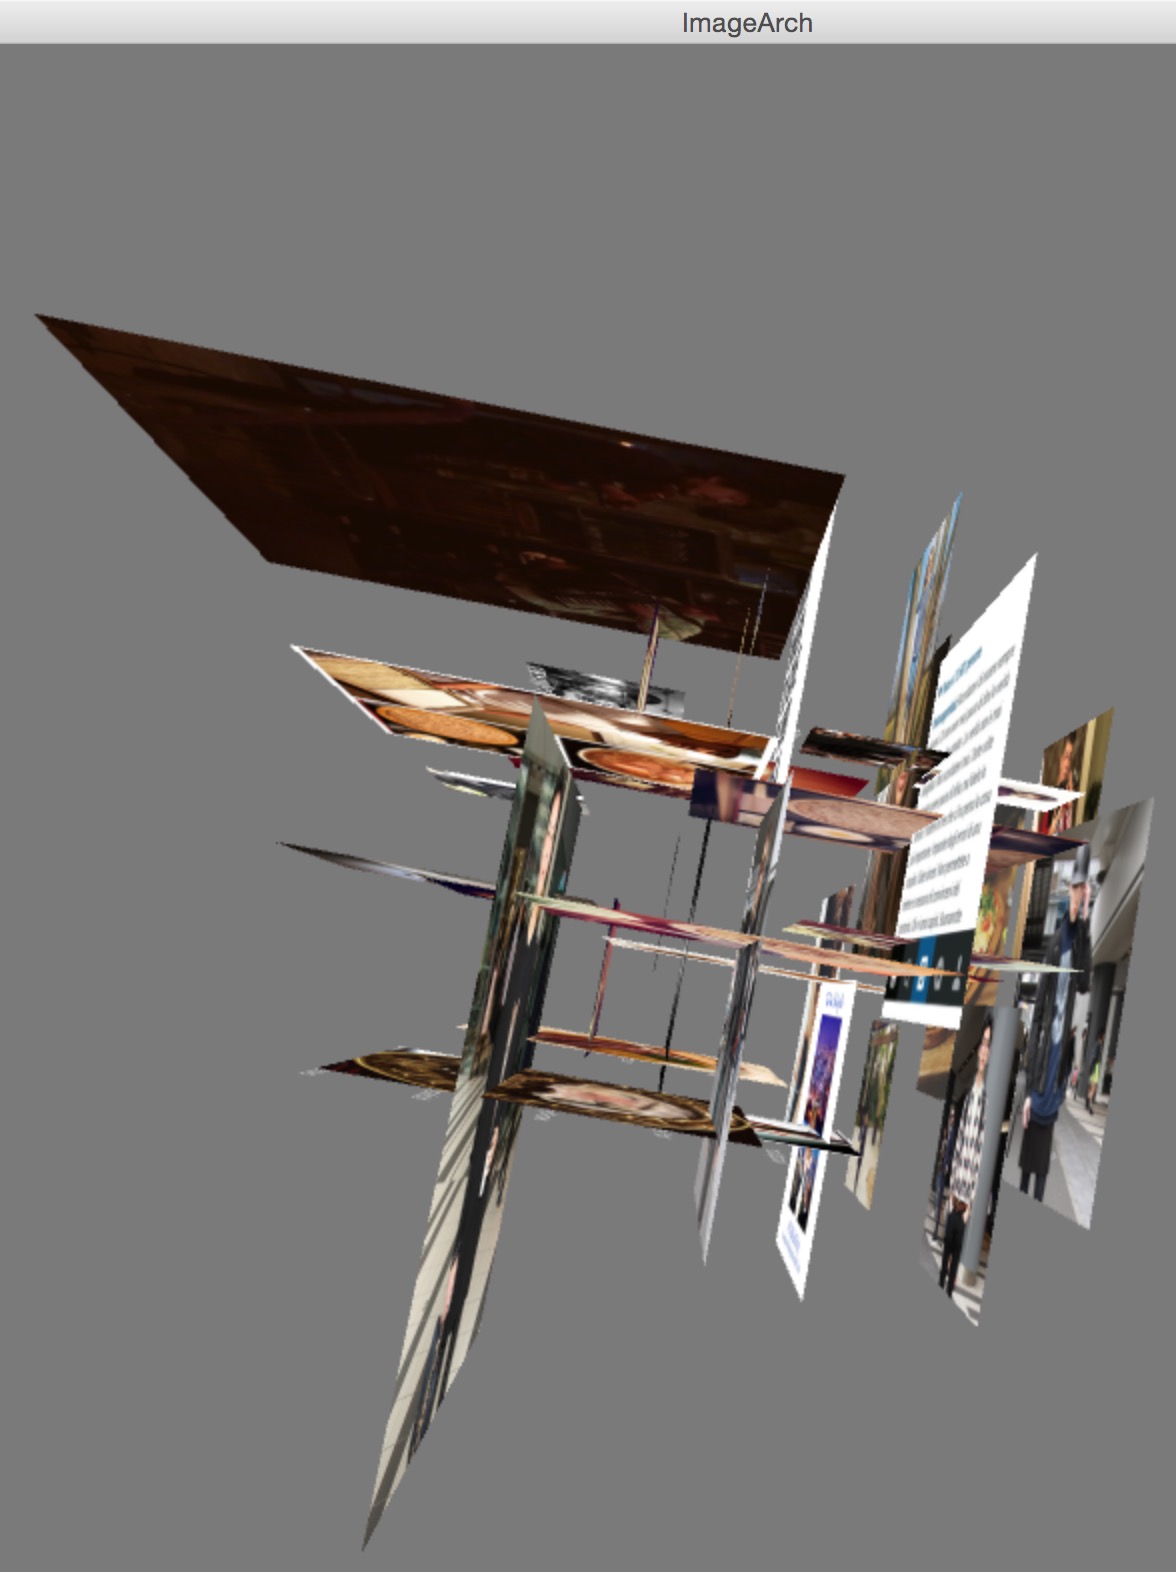
The initial idea of the project was to explore user behavior by correlating with Geolocation API and Tag API, however the visual part, shown as two images below, was too arbitrary and didn’t appeal like a data visualization work.
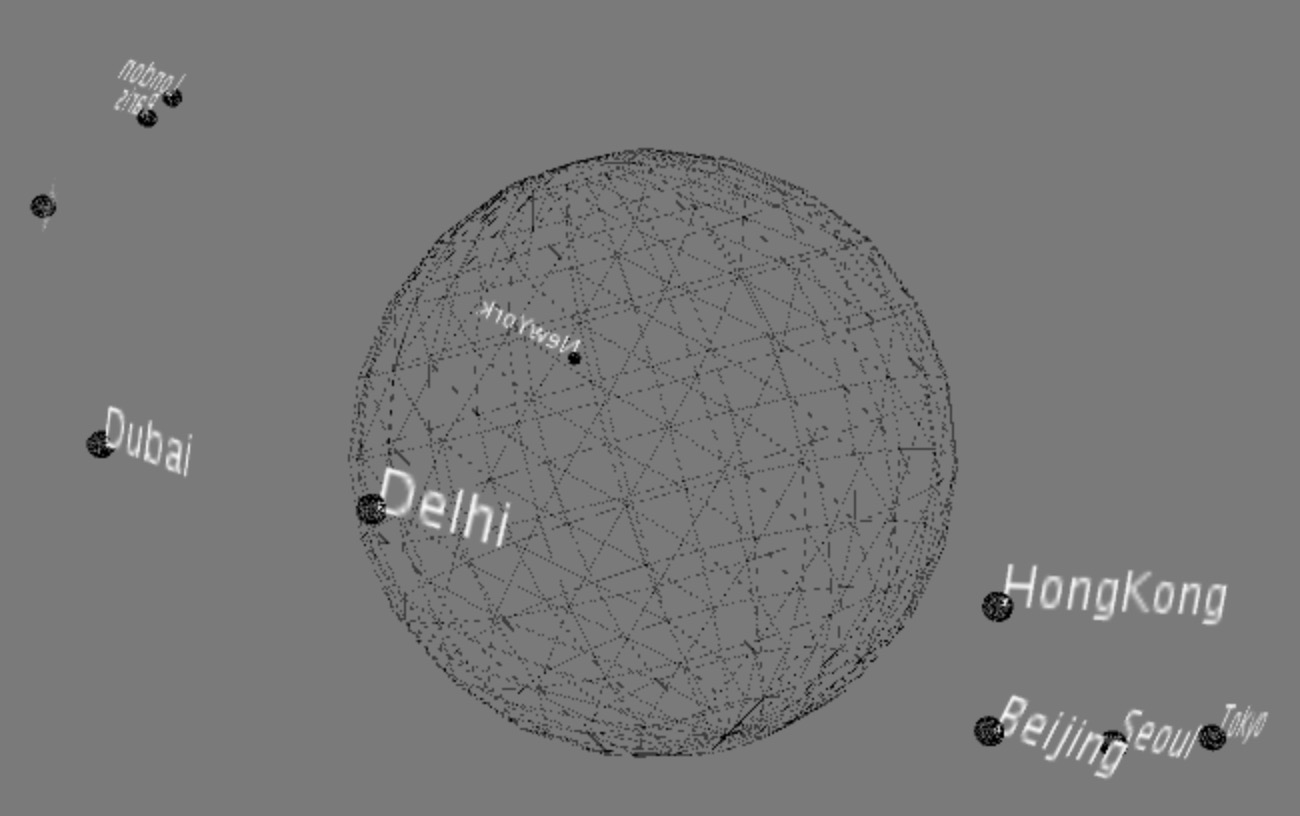
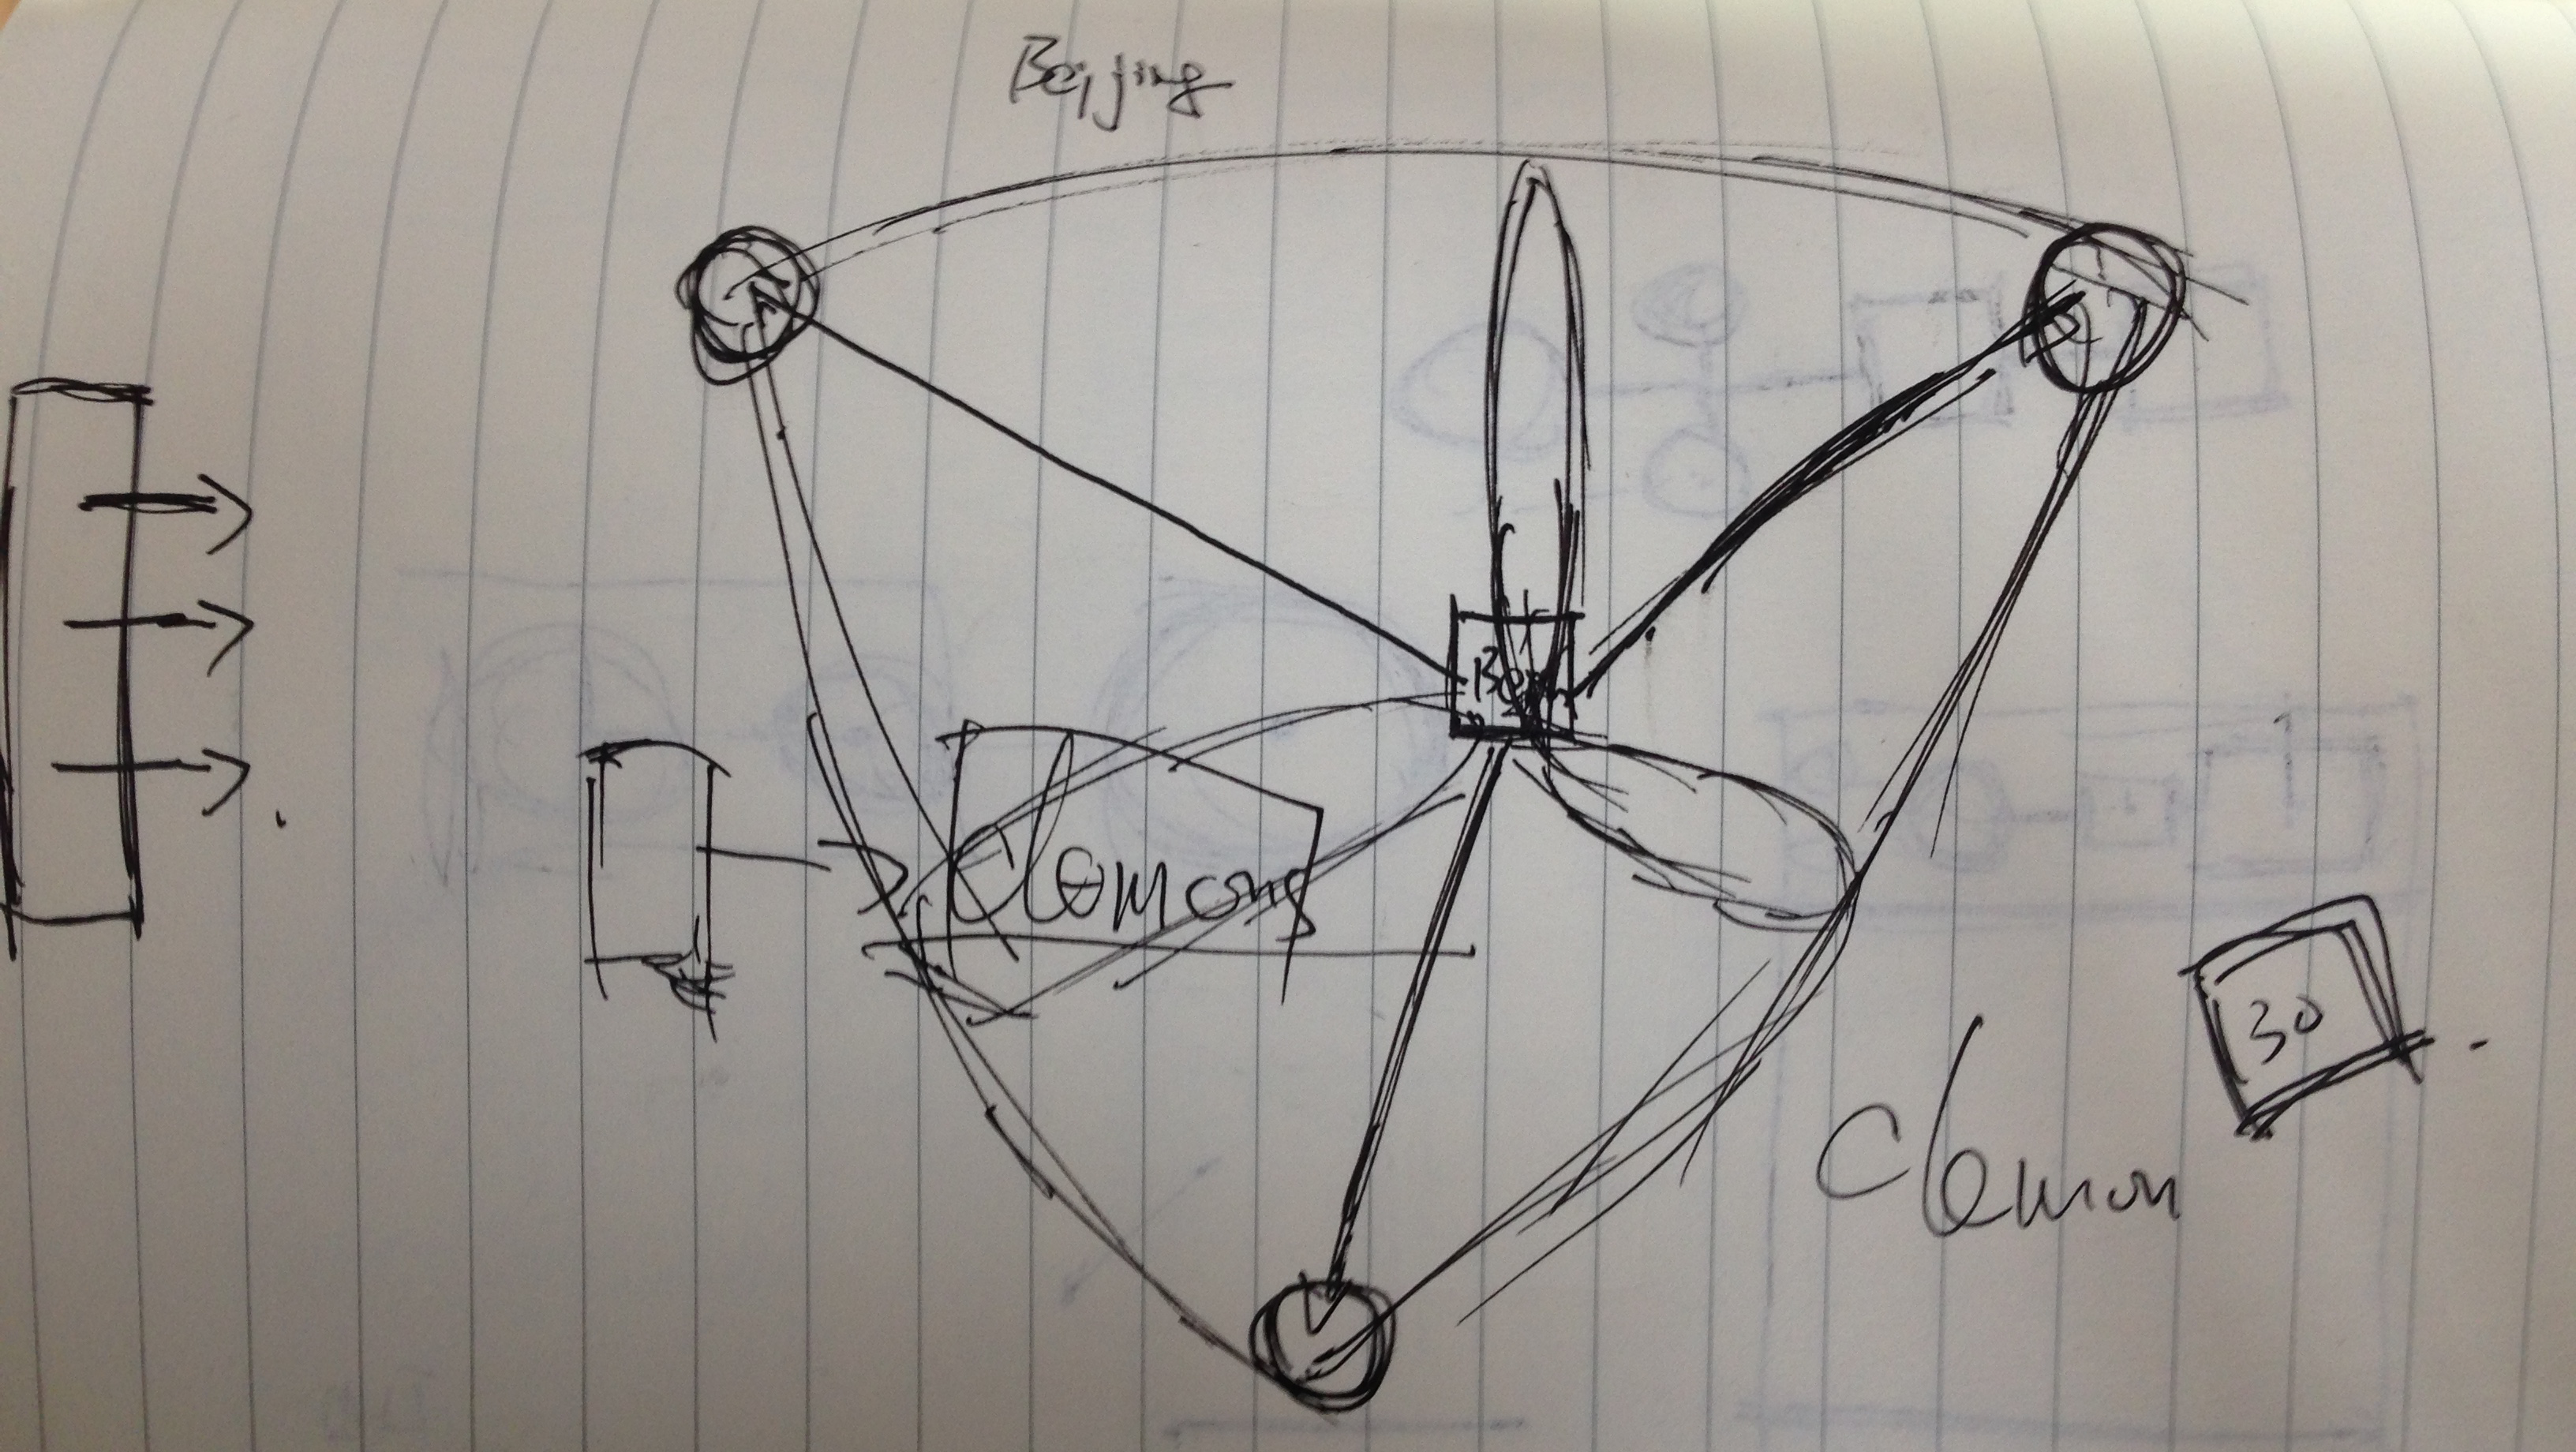
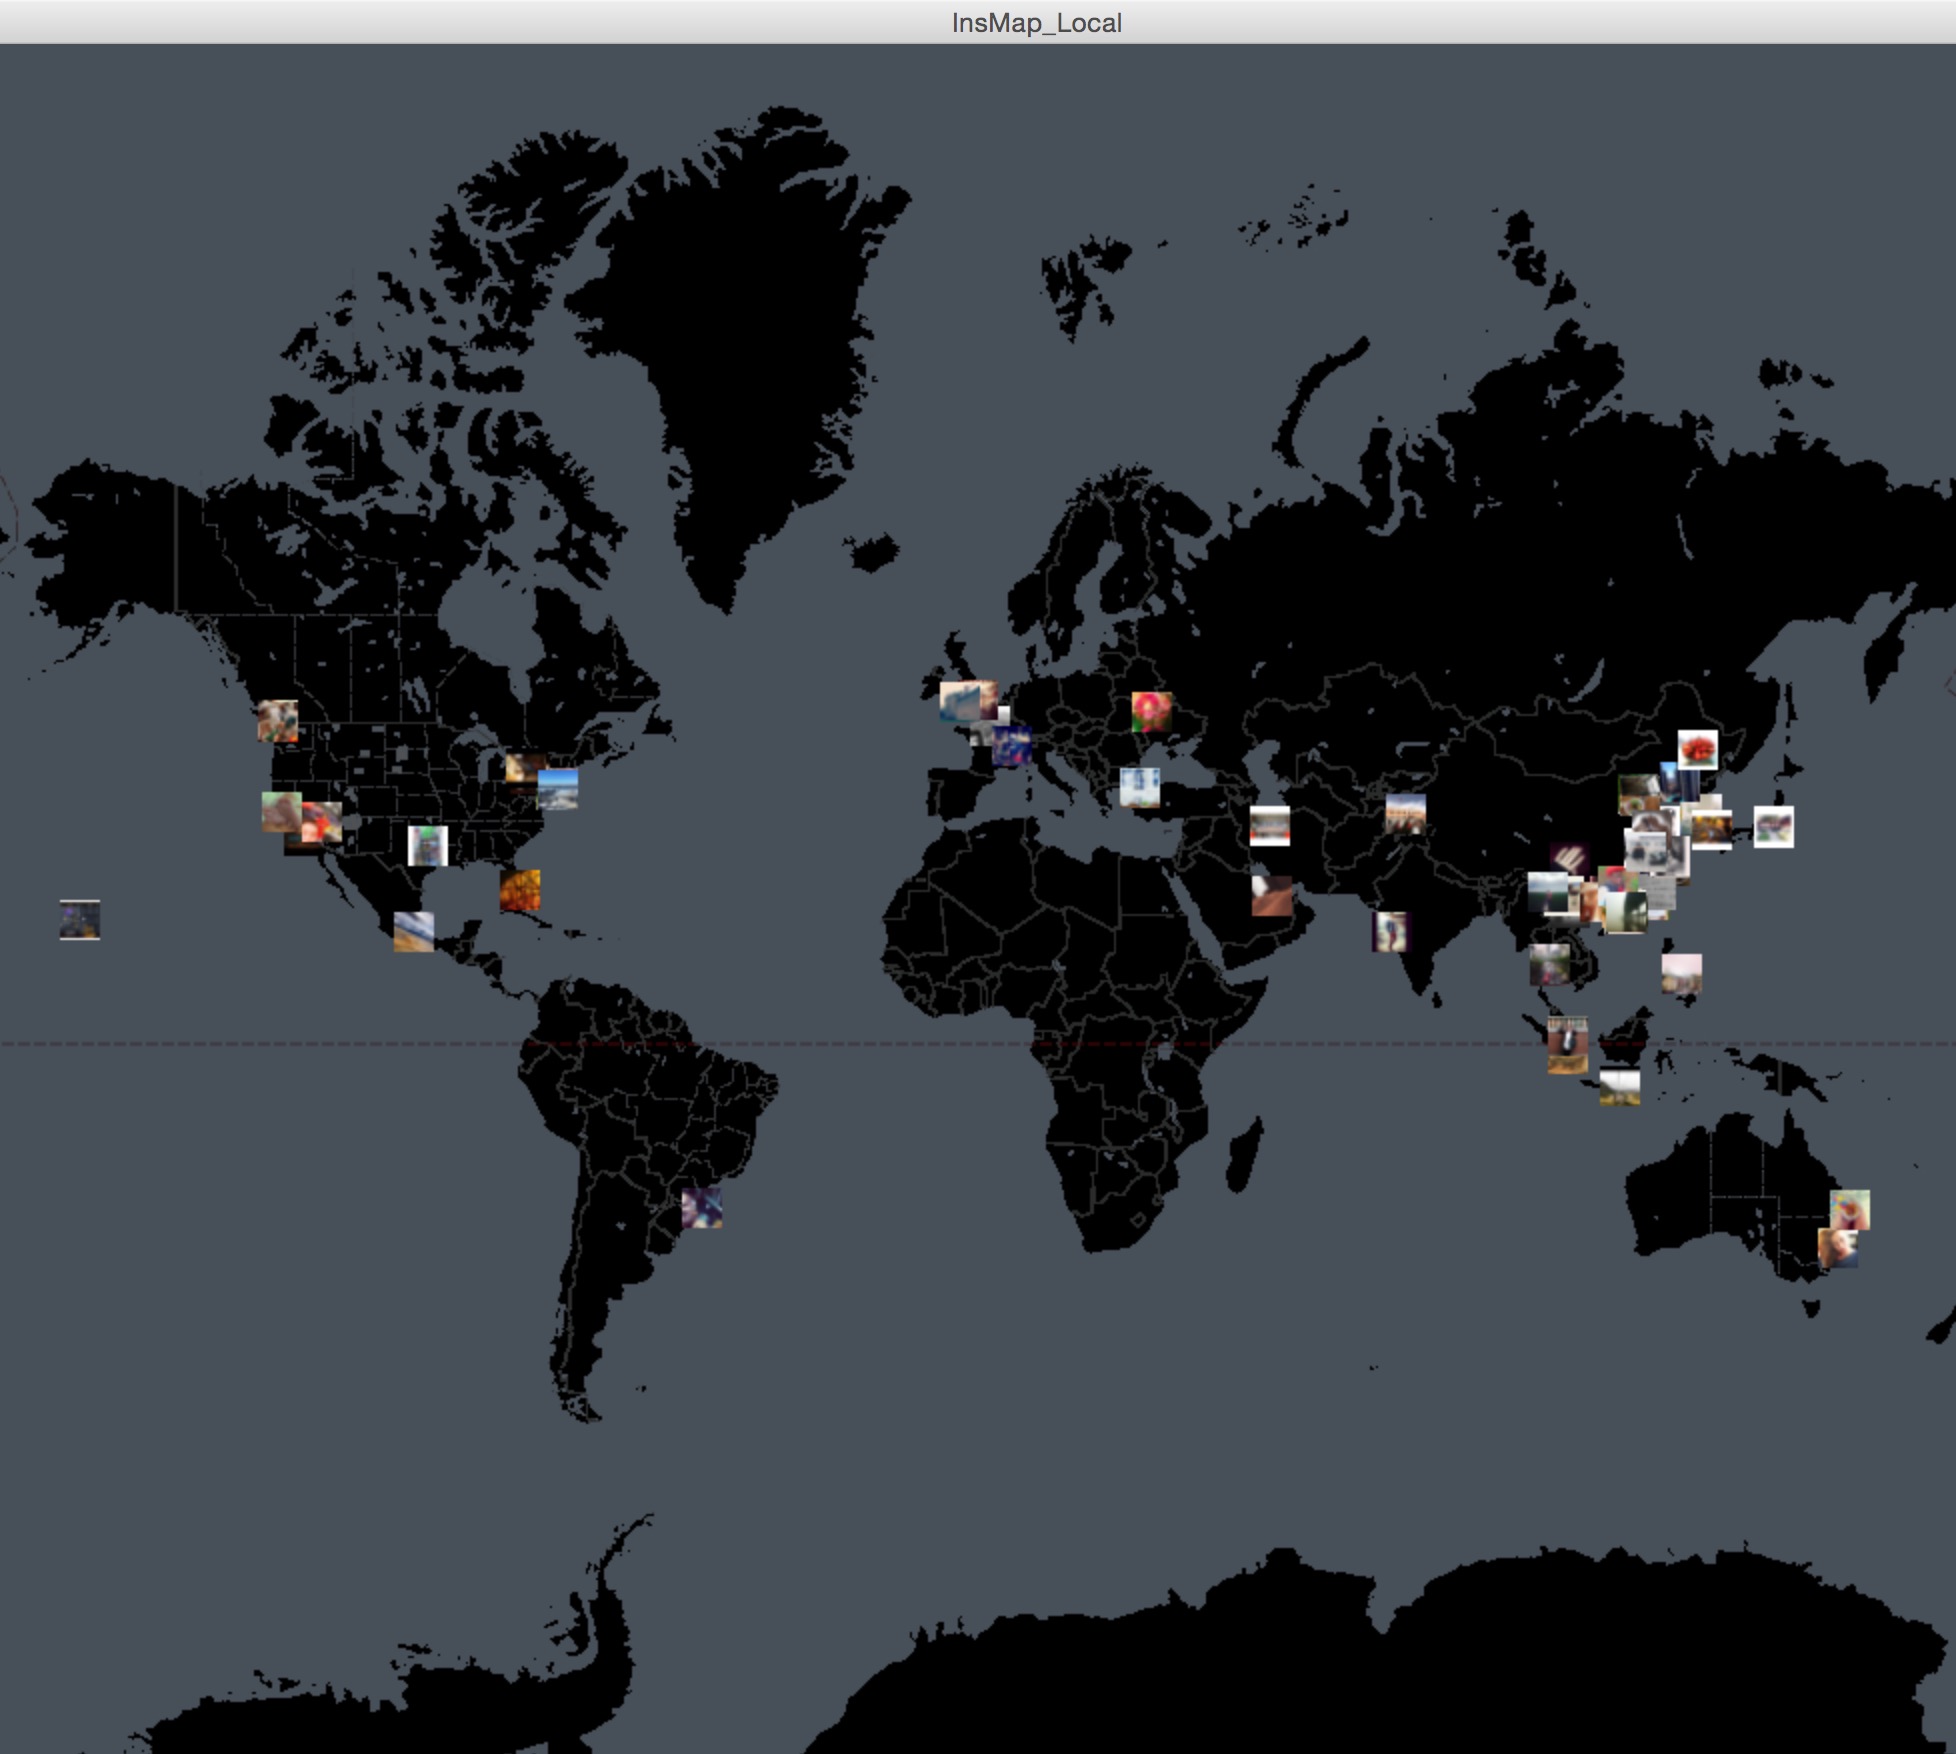
With the new idea, I started to put images on the map based on their geolocations.
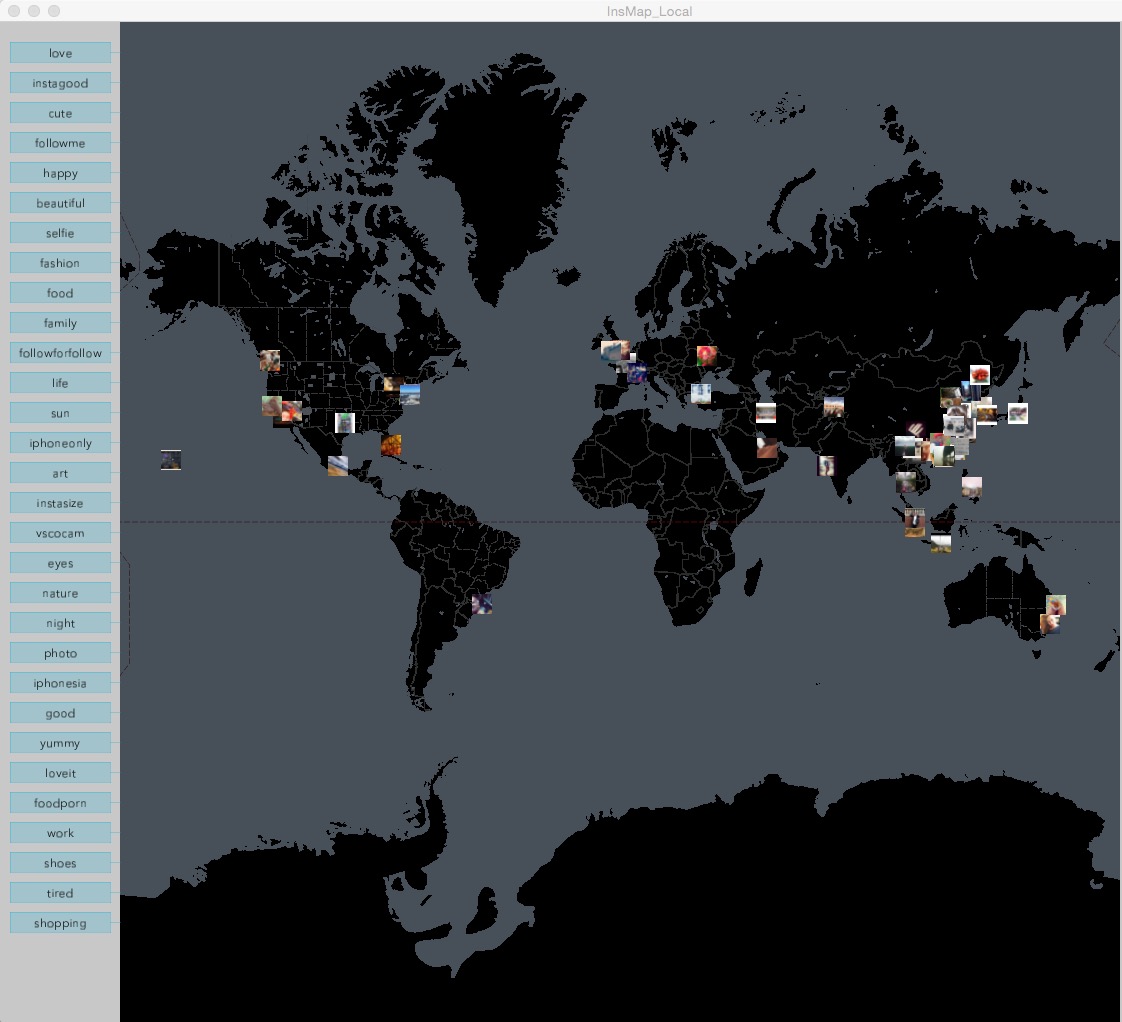
Digging out popular keywords from images.
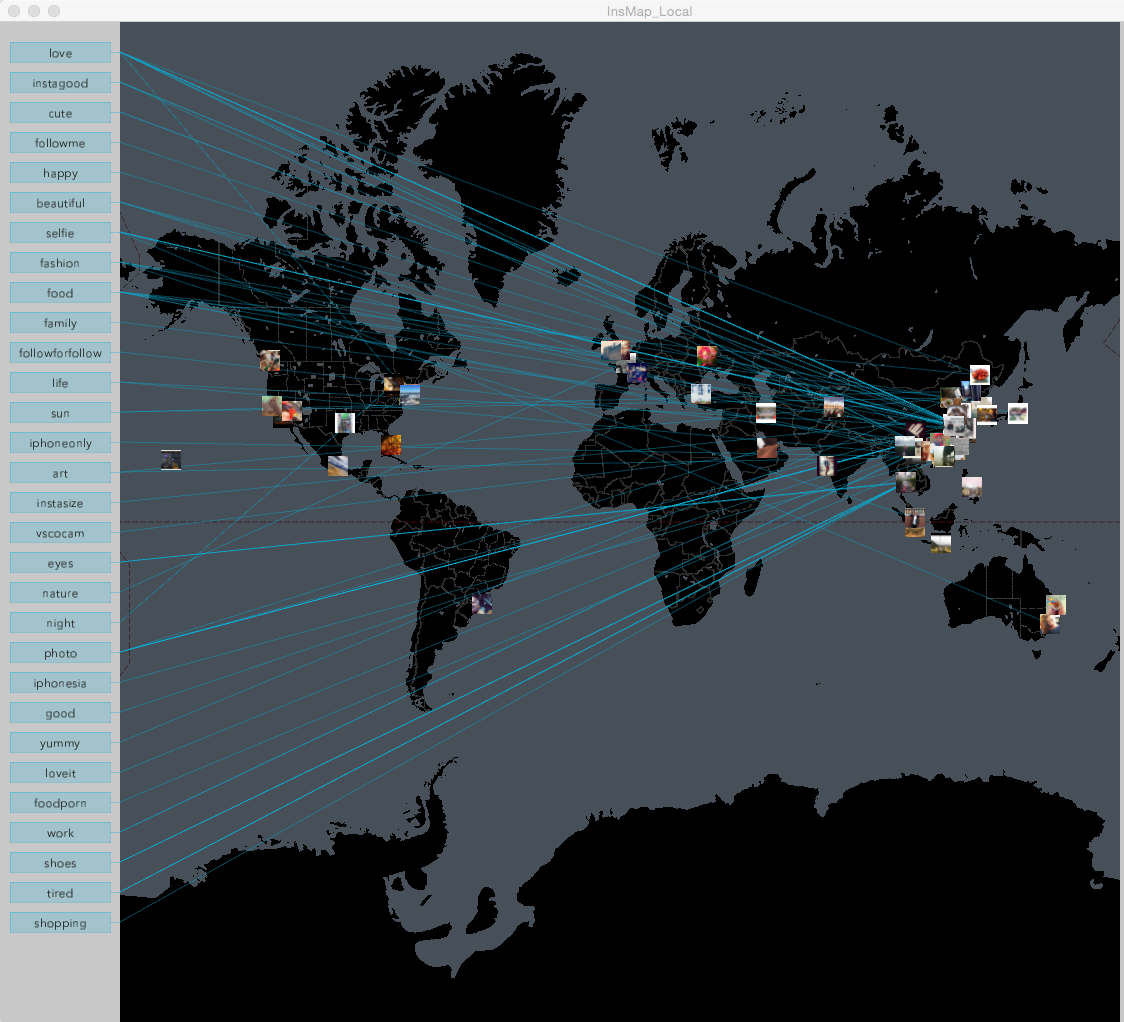
Making connections.
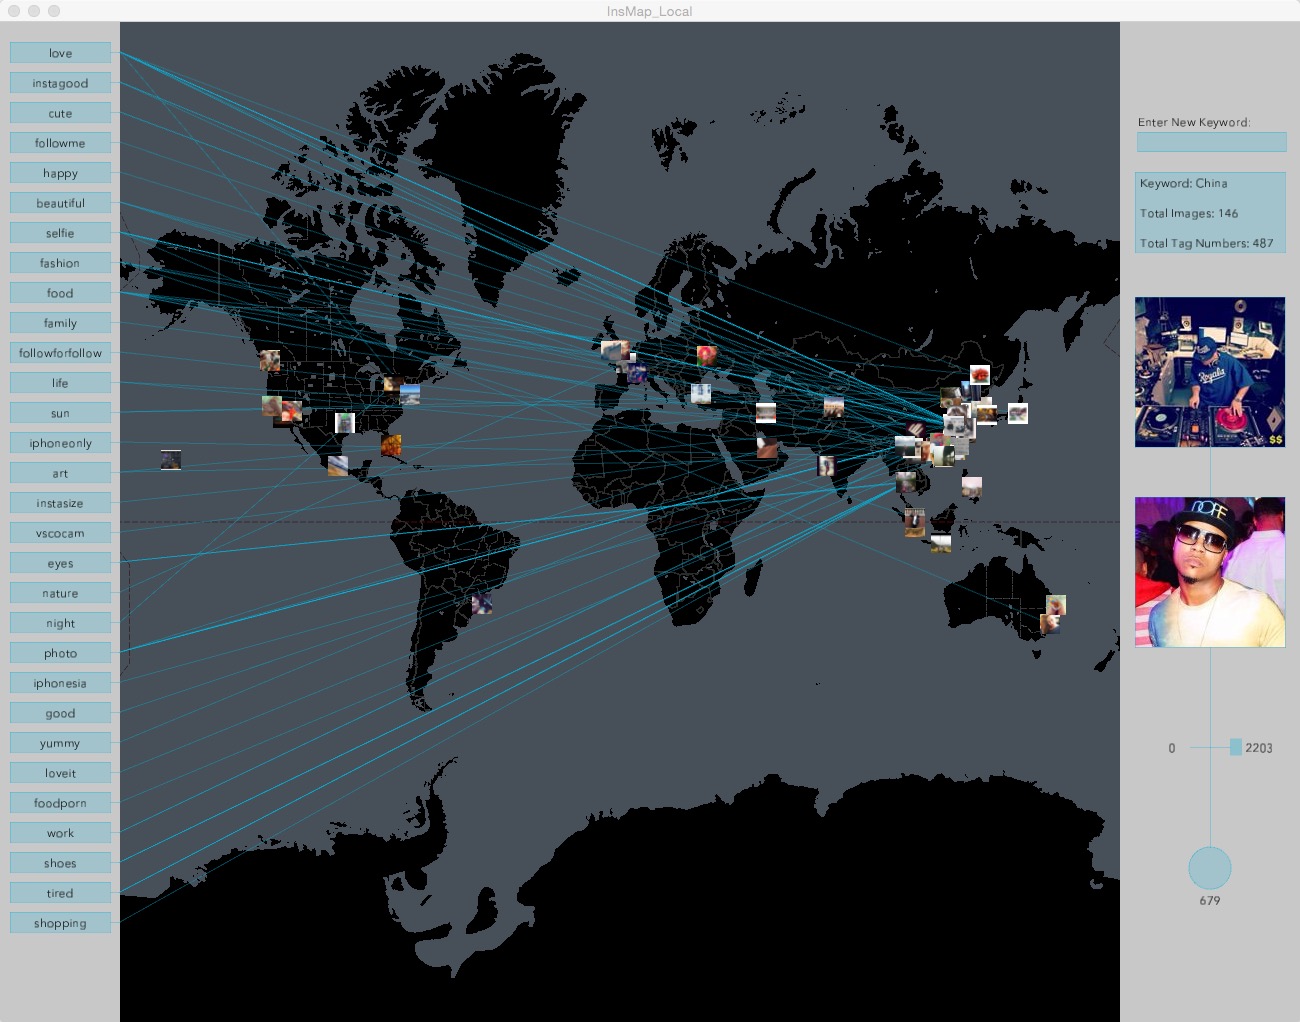
Adding details on the right side when mouse hovers on the small images.
With the new idea, I started to put images on the map based on their geolocations.
Digging out popular keywords from images.
Making connections.
Adding details on the right side when mouse hovers on the small images.
Final result
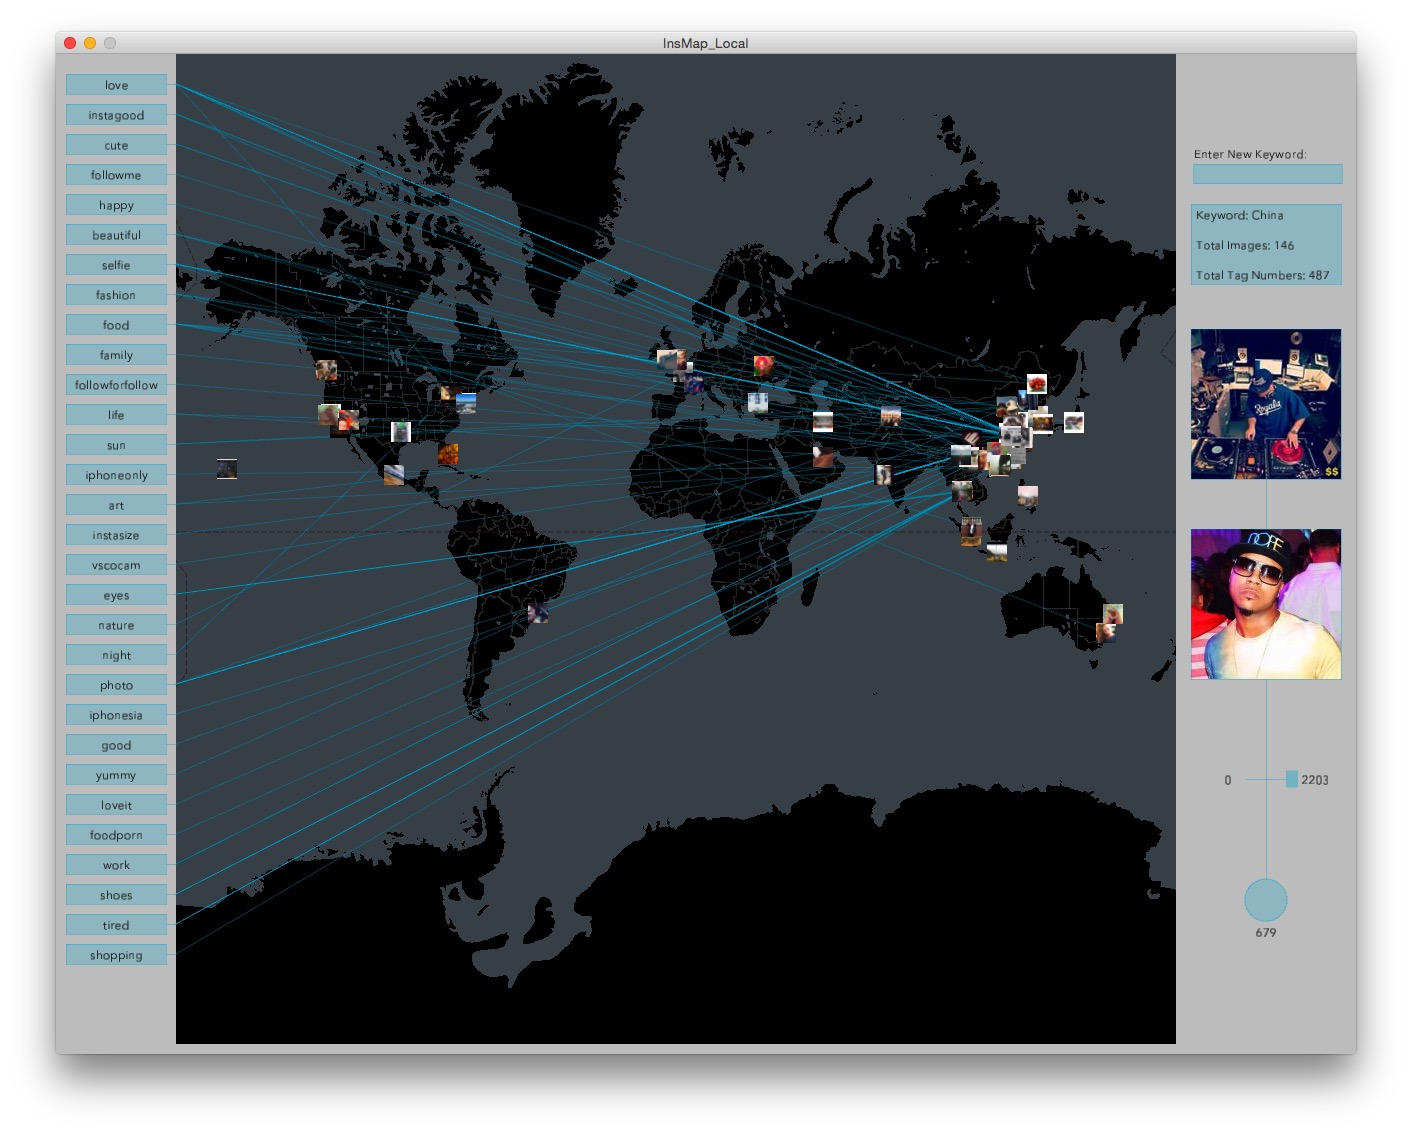
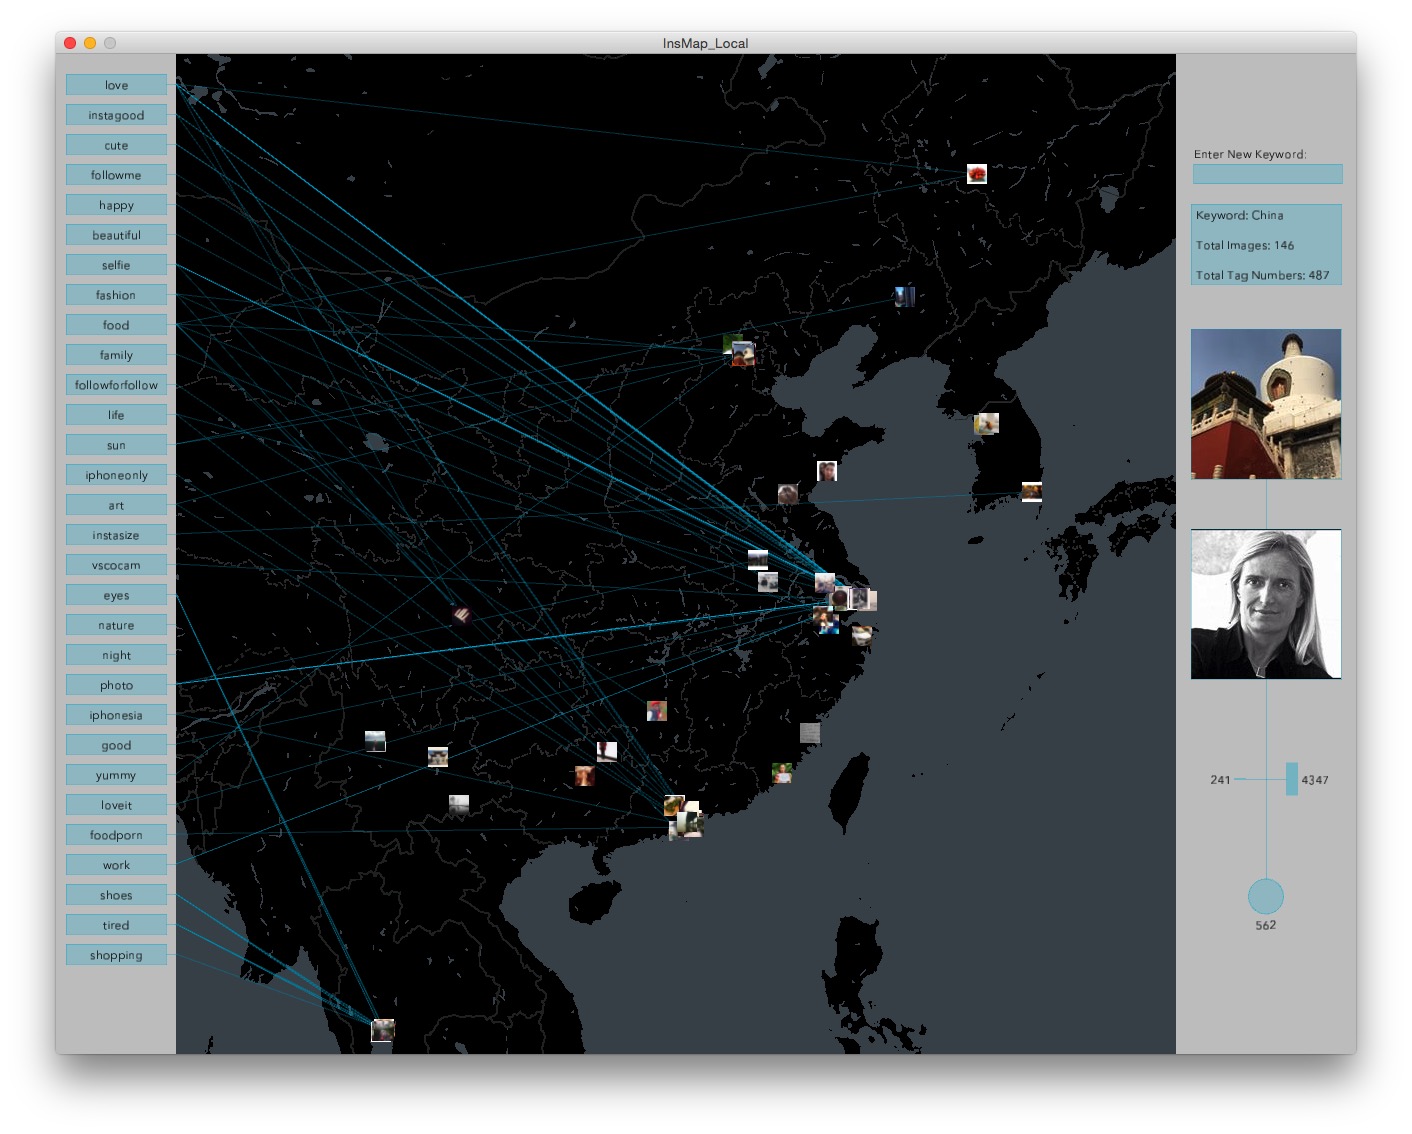
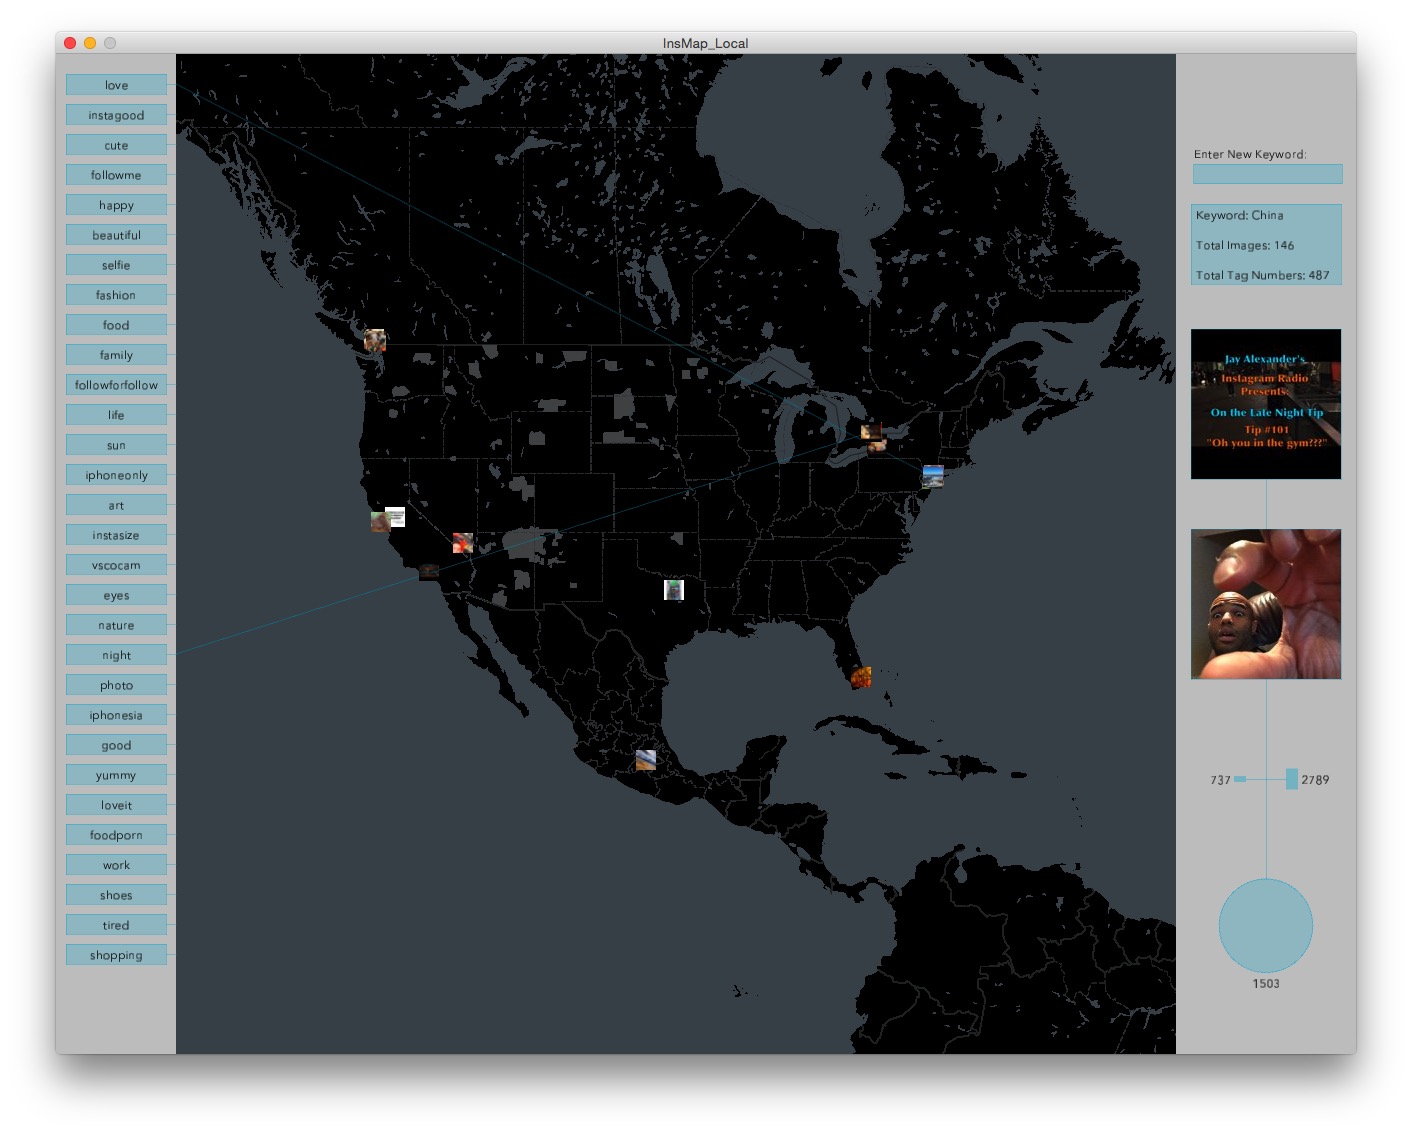
The final layout looks like above images. All the images including the beginning searching keyword are placed on the map with their geolocations. The most 30 popular keywords among all the images are placed on the left side, and connects with the images if they have the keywords. On the right side, it tells user information when mouse moves on an image. The two rectangular shapes indicated the number of followers of the user (right), and the number of people the user follows (left). The circular shape tells how many posts the user has already posted. For the two images, the one above is the large version of the image on the map, while another image is the profile image of the user. Also, you can zoom in the map to see more details of one particular area, and start a new search by entering a new keyword. It's always the live data.
Code
The project is developed within Processing
Move the mouse on each image on the map to see the detials on the right side.
Double click on the map to zoom in that area. Space to zoom out.
Source Code + Data
Move the mouse on each image on the map to see the detials on the right side.
Double click on the map to zoom in that area. Space to zoom out.
Source Code + Data