Forgotten Books - 2D Matrix
MAT 259, 2015
Rodger (Jieliang) Luo
Concept
The Seattle Public Library has more than 100,000 books being checked out at Jan 1st 1970, and being returned from 2006 to 2014. I am really curious of the hidden information behind this group of books as they are 1) sharing the same strange checking out data; 2) somehow they got returned after 36 years. This data visualization intended to explore the data with the goal of figuring out what the types of these books are.
Query
SELECT
FLOOR(deweyClass / 100) * 100 AS Dewey,
SUM(CASE
WHEN itemtype LIKE '%cdrom' THEN 1
ELSE 0
END) AS CD_ROM,
SUM(CASE
WHEN itemtype LIKE '%vhs' THEN 1
ELSE 0
END) AS Video_VHS,
SUM(CASE
WHEN itemtype LIKE '%bk' THEN 1
ELSE 0
END) AS Book,
SUM(CASE
WHEN itemtype LIKE '%cd' THEN 1
ELSE 0
END) AS CD,
SUM(CASE
WHEN itemtype LIKE '%mus' THEN 1
ELSE 0
END) AS Music_Score,
SUM(CASE
WHEN itemtype LIKE '%dvd' THEN 1
ELSE 0
END) AS DVD,
SUM(CASE
WHEN itemtype LIKE '%disk' THEN 1
ELSE 0
END) AS Diskette,
SUM(CASE
WHEN itemtype LIKE '%kit' THEN 1
ELSE 0
END) AS Kit,
SUM(CASE
WHEN itemtype LIKE '%vid' THEN 1
ELSE 0
END) AS Video,
SUM(CASE
WHEN itemtype LIKE '%cas' THEN 1
ELSE 0
END) AS Audio_Tape,
SUM(CASE
WHEN itemtype = 'aceq' OR itemtype = 'ucunkn' THEN 1
ELSE 0
END) AS Uncataloged
FROM
spl2.inraw
WHERE
cout = '1970-01-01' AND deweyClass > 0
GROUP BY FLOOR(deweyClass / 100) * 100
ORDER BY Dewey DESC
Preliminary sketches
The initial idea of this project was to explore a different presentation of 2D matrix instead of the traditional x-y 2D matrix. In comparison of typical 2D matrix, which uses x and y coordinates to locate an object, my goal is to free the restriction of the x-y coordinate in 2D matrix. As you can see from the sketch below, the previous x and y axises now locate on the left and right in vertical way, and connect each object with lines. In that way, the space between the two axises is released for adding more attributes of the object. In the mean time, the area of the object is also more flexible regarding to represent one more dimension of data.
Process
The design process of this project was very linear as I had a clear idea of the final image. So the first step was to transfer the sketch to digital version.
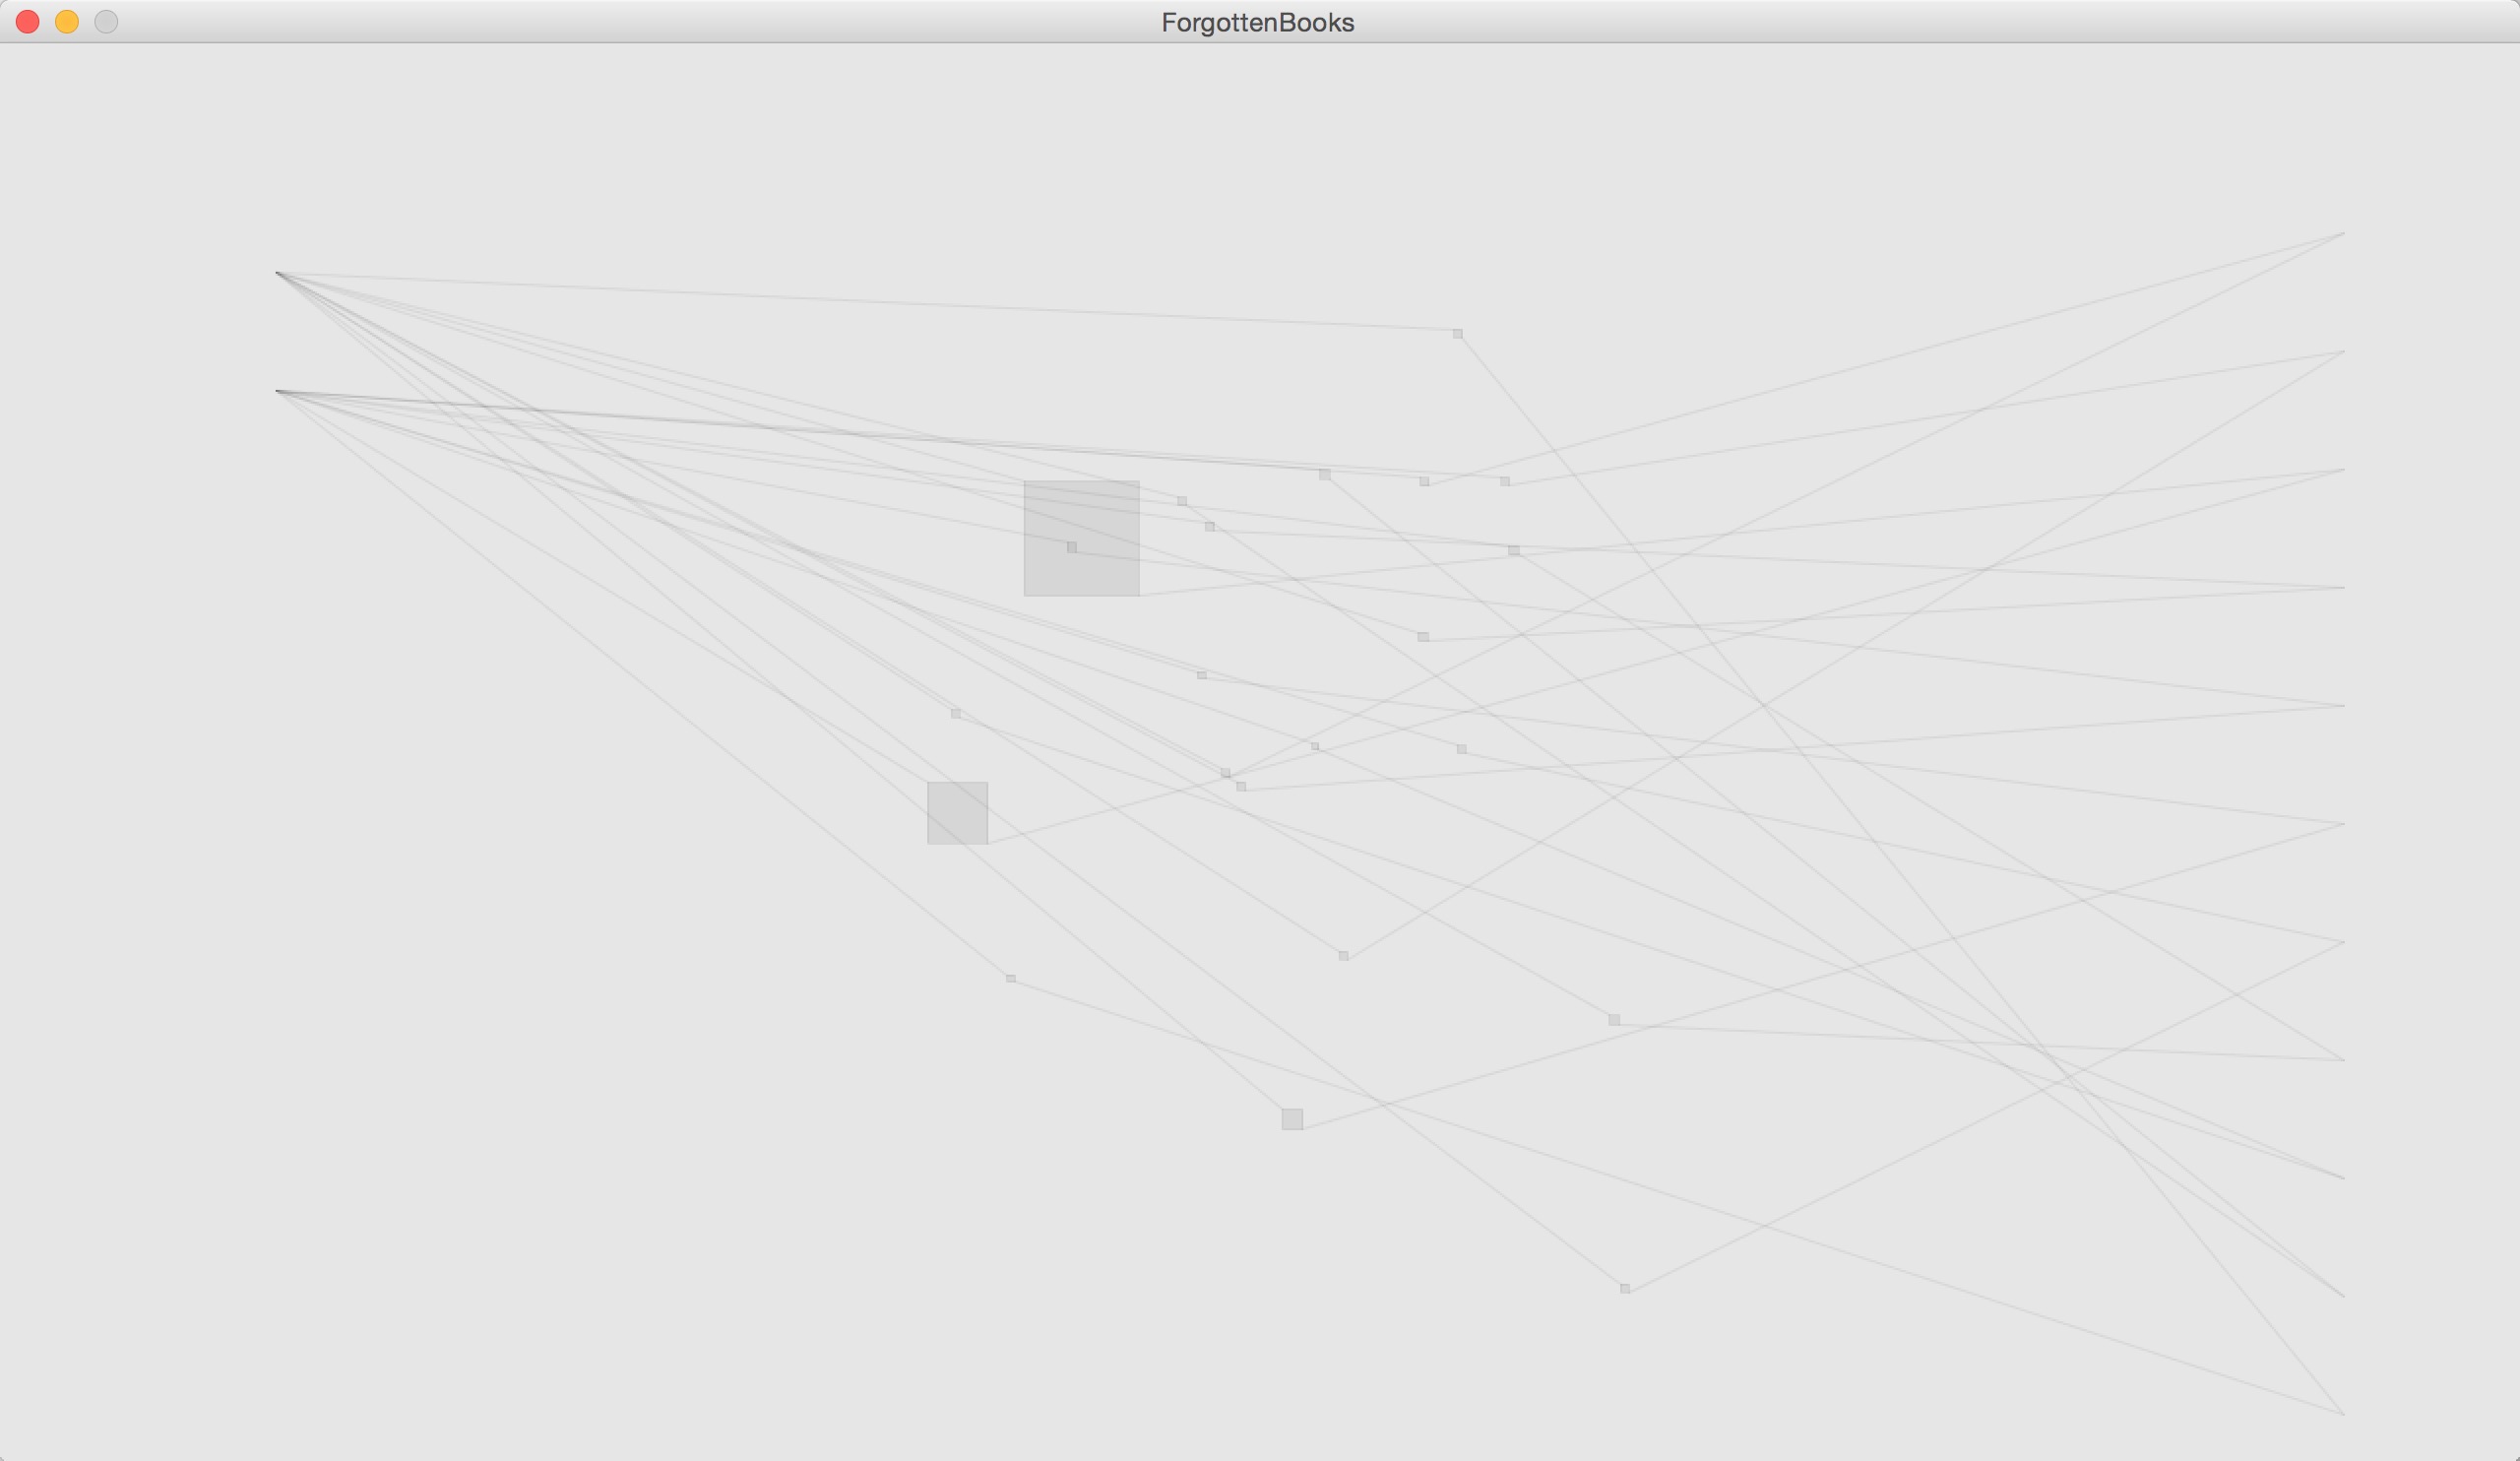
Then I was about to put all the data on the canvas.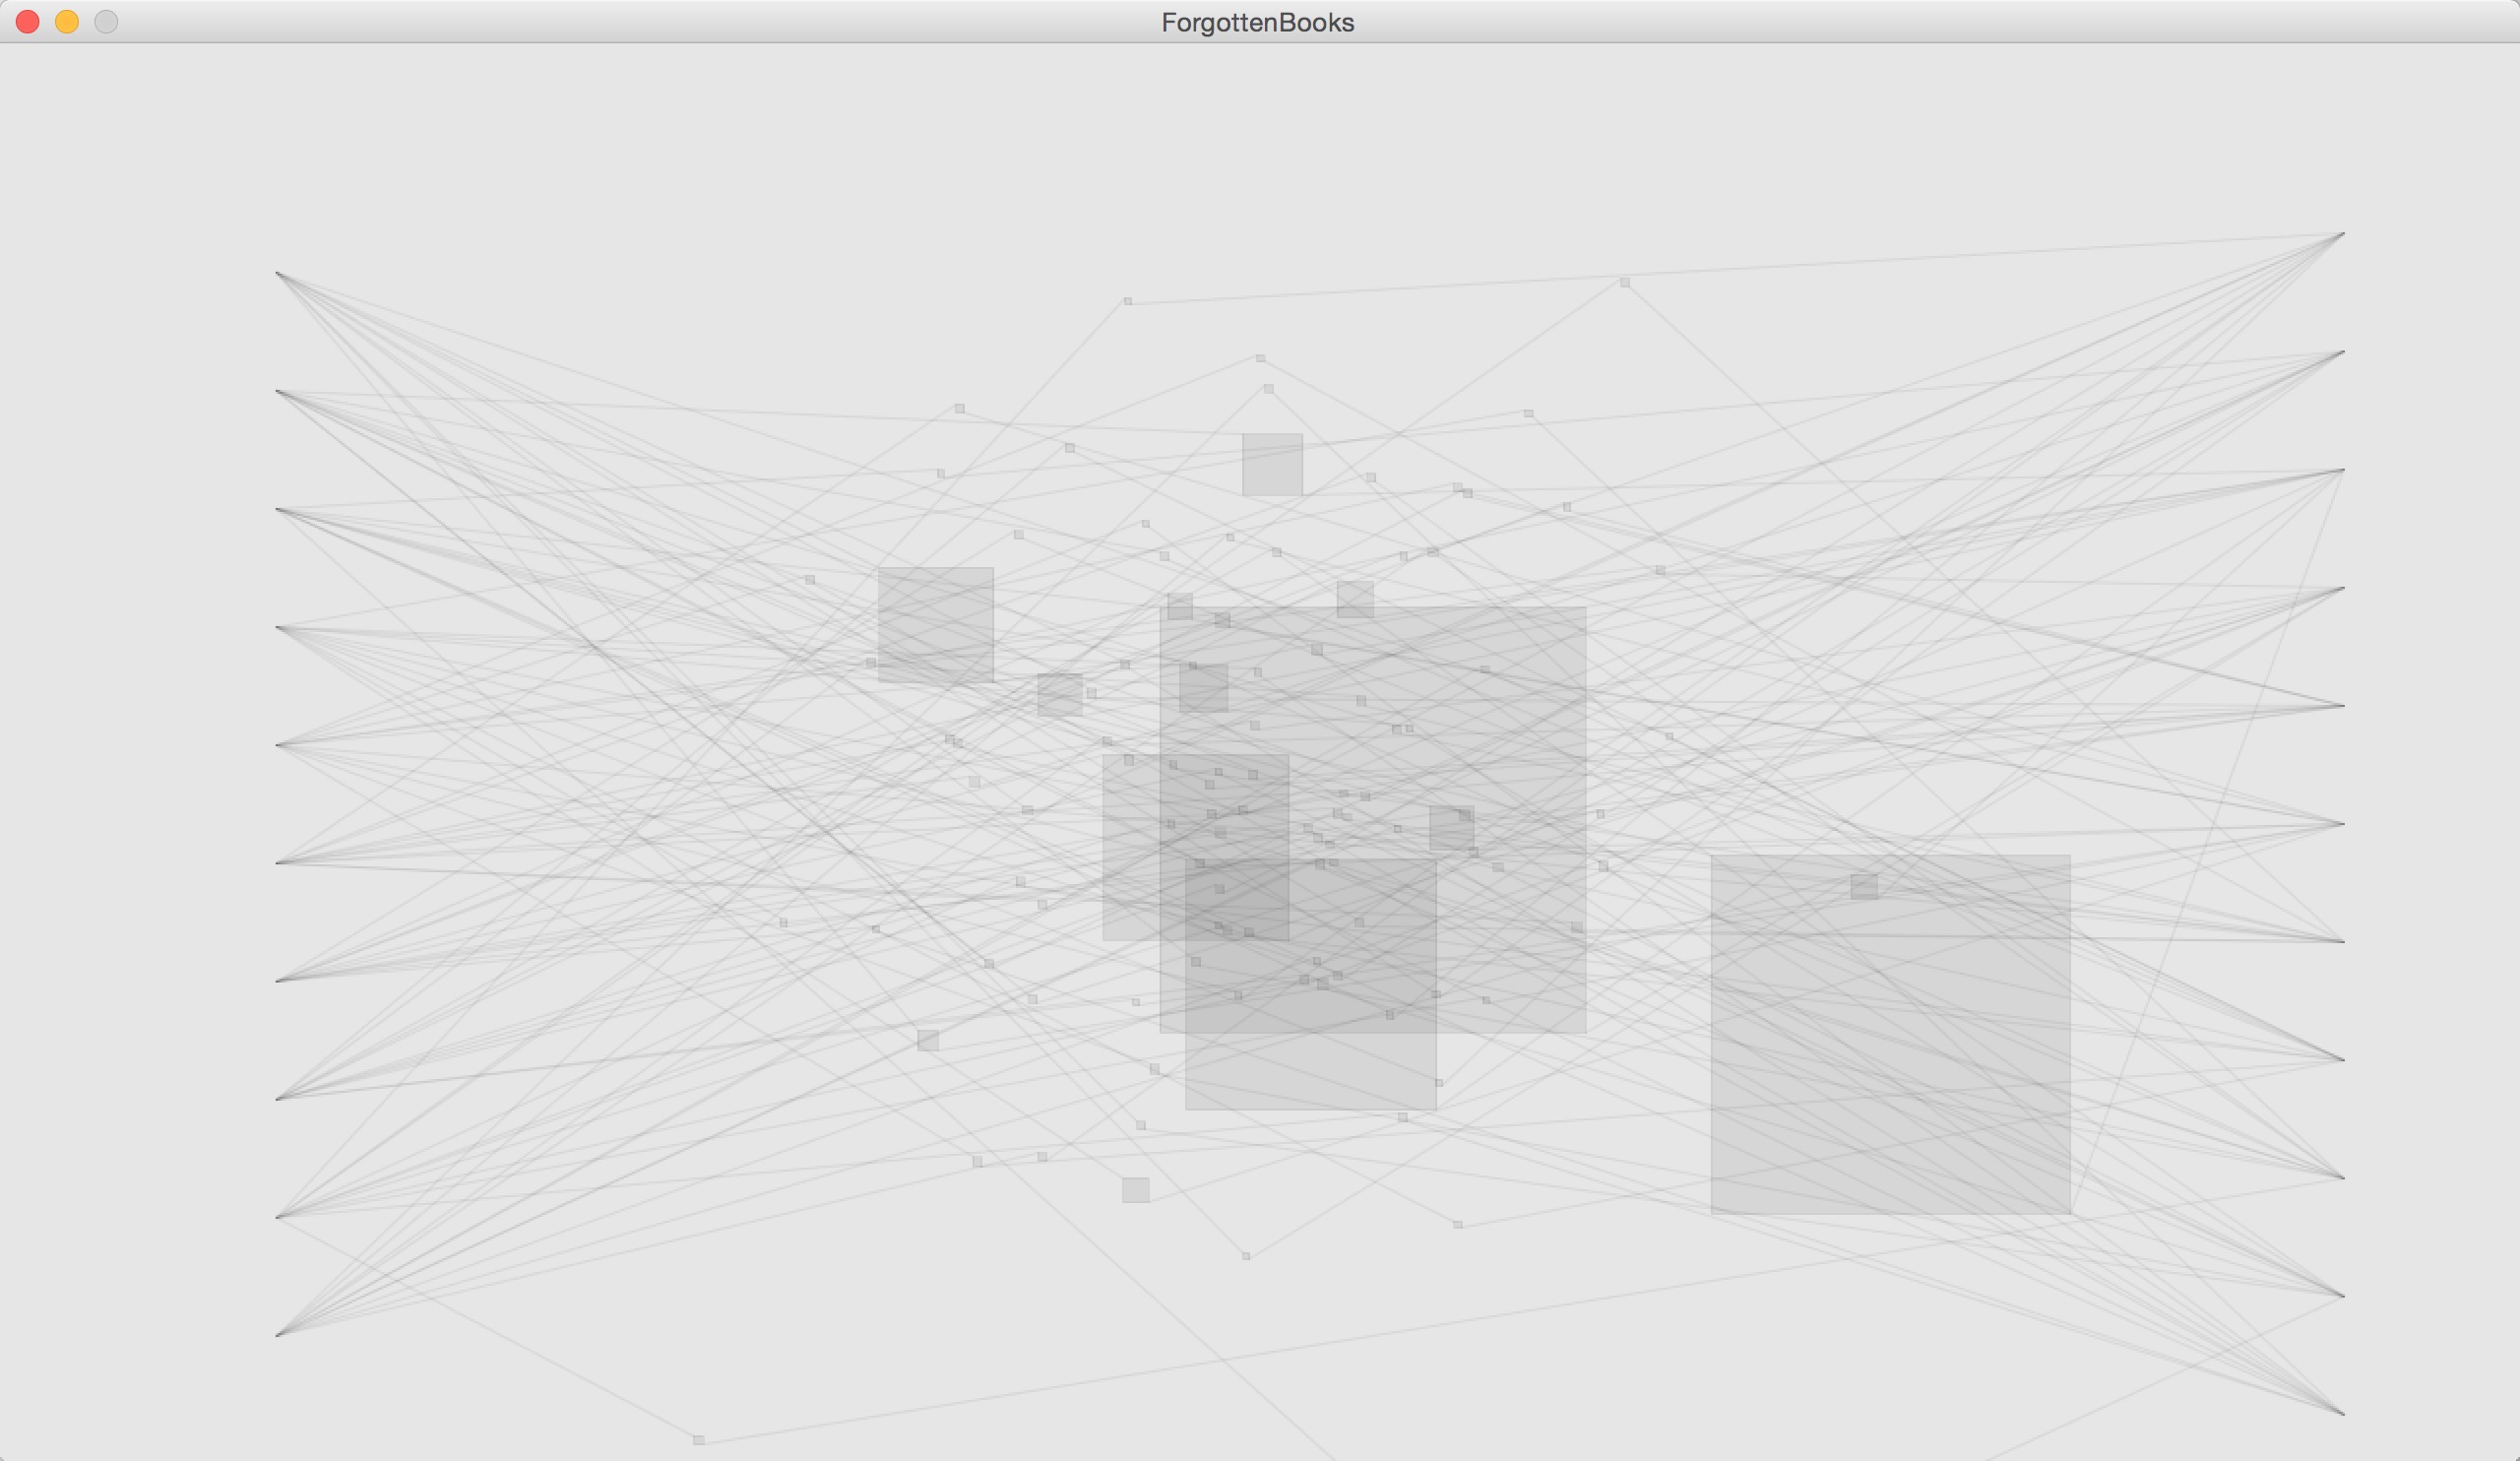
And adding texts on the two vertical axises.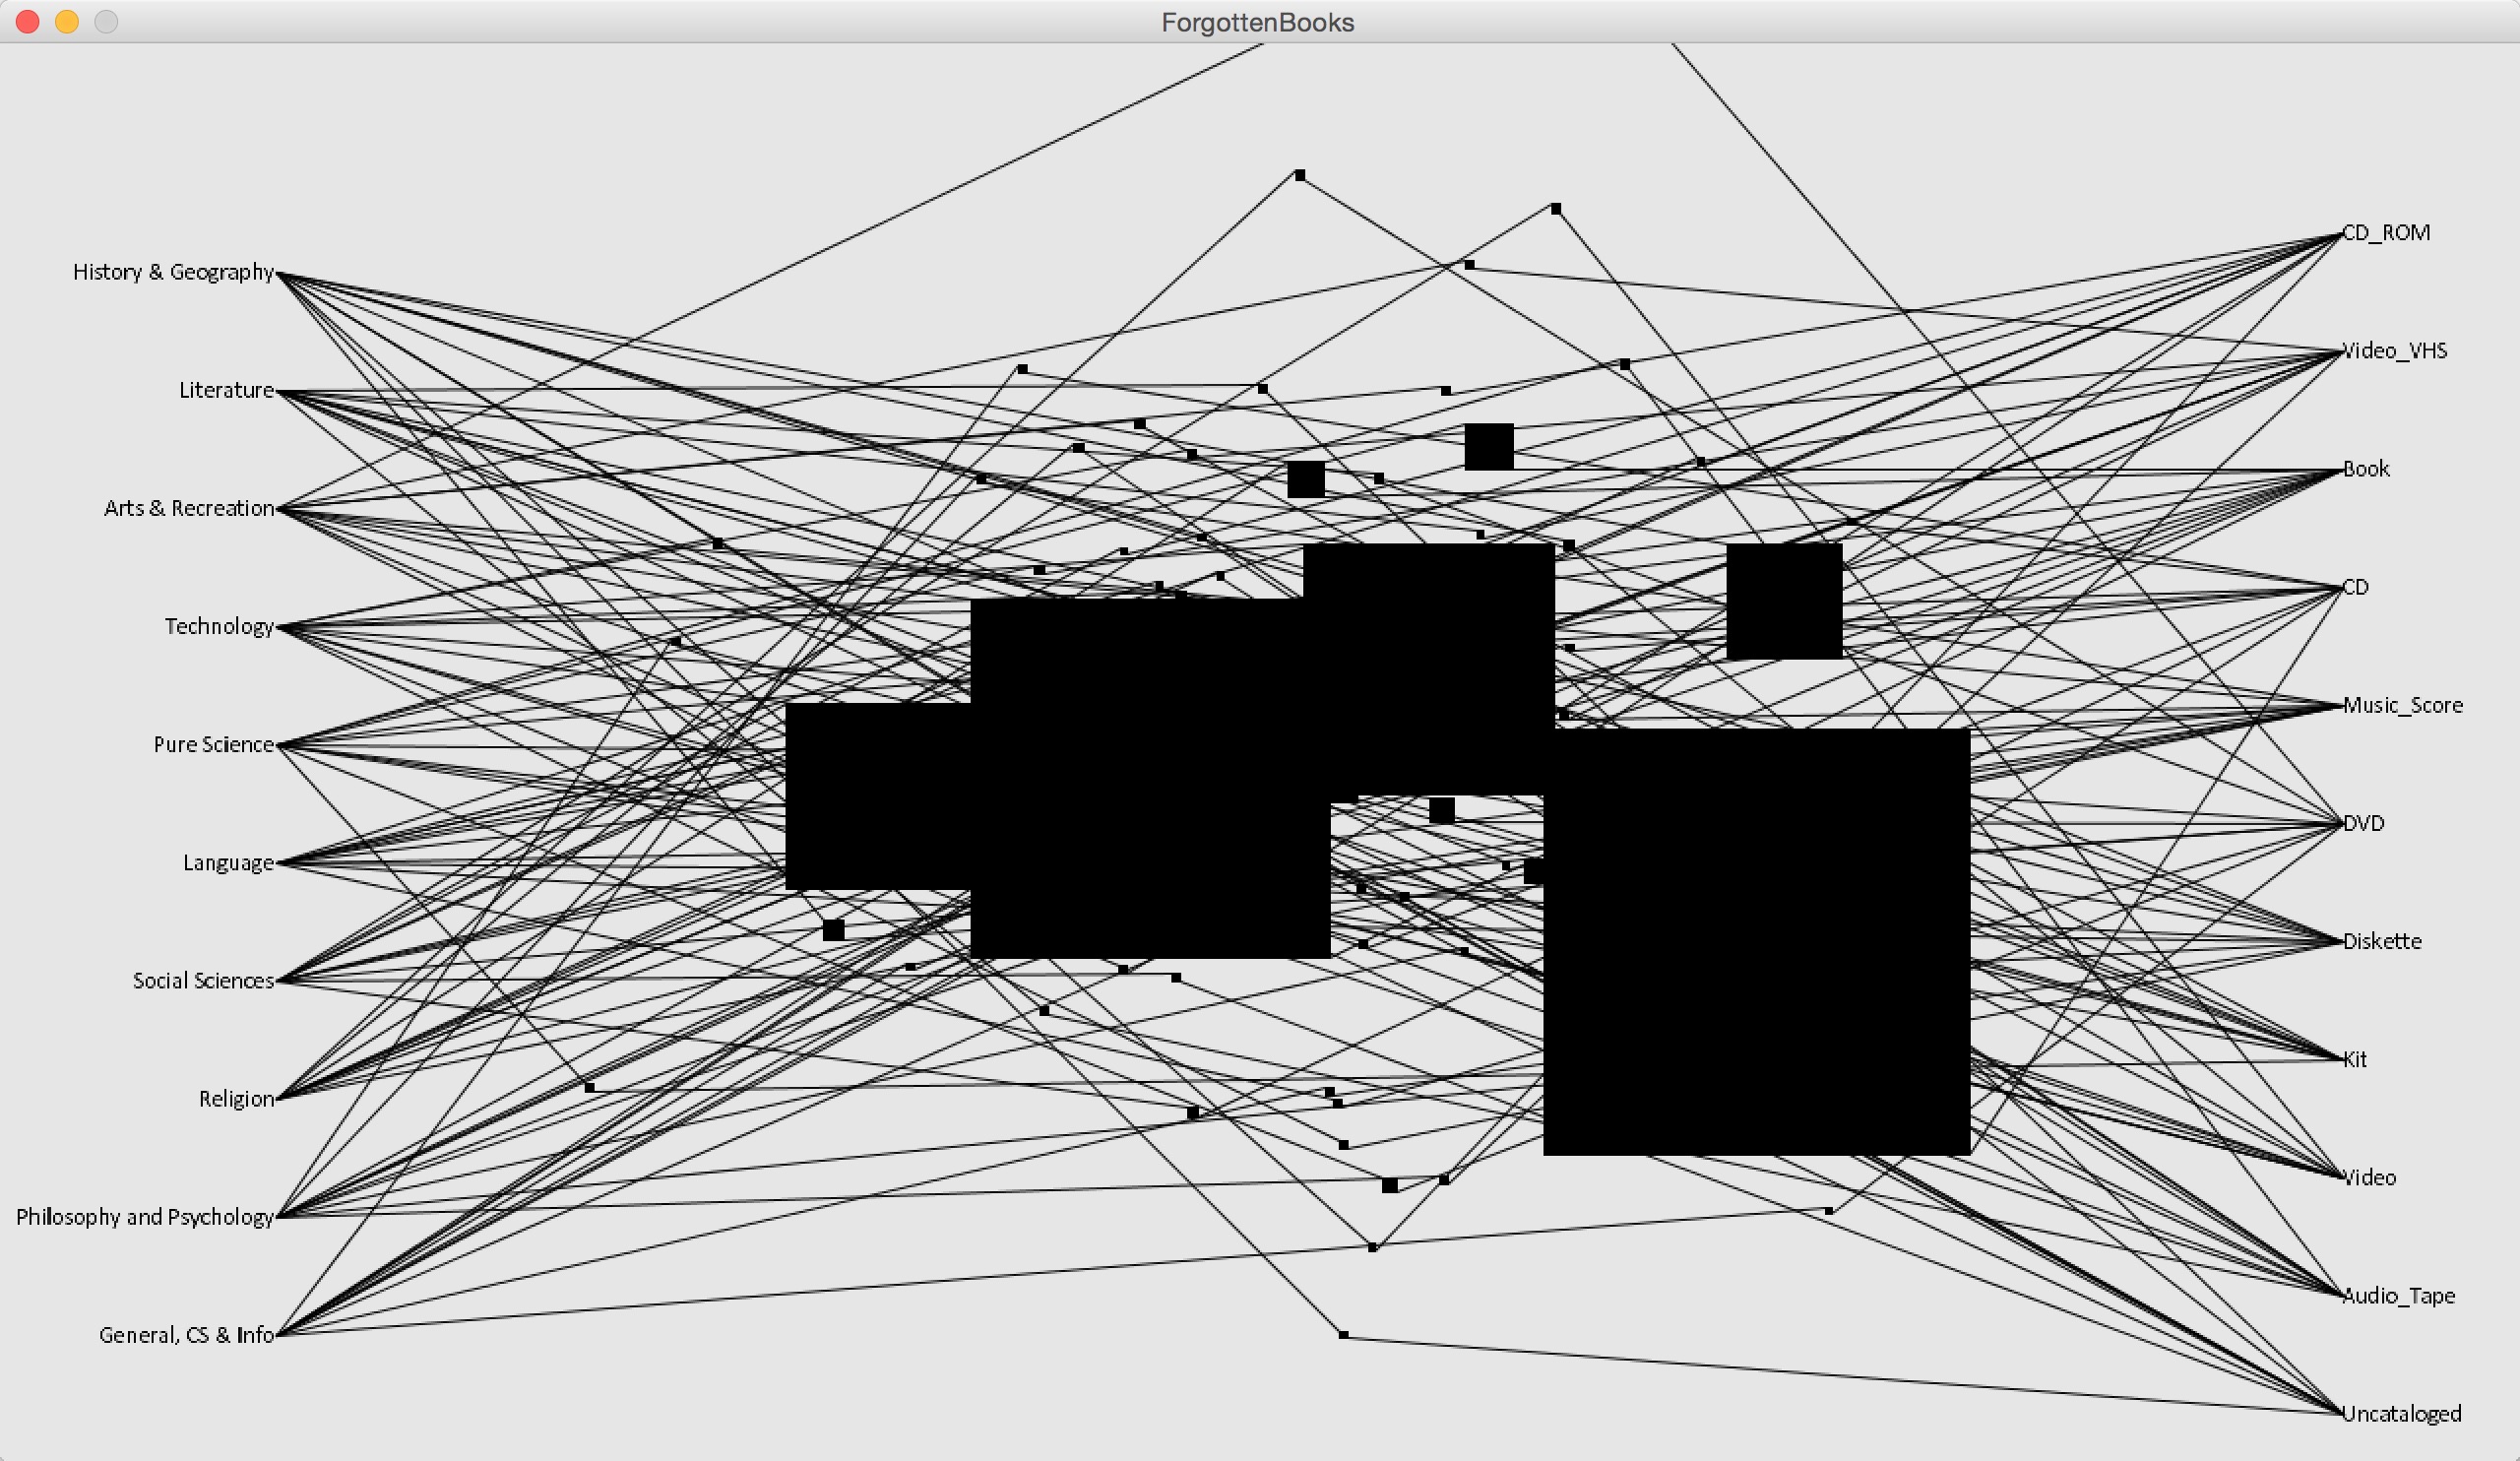
Then I was about to put all the data on the canvas.
And adding texts on the two vertical axises.
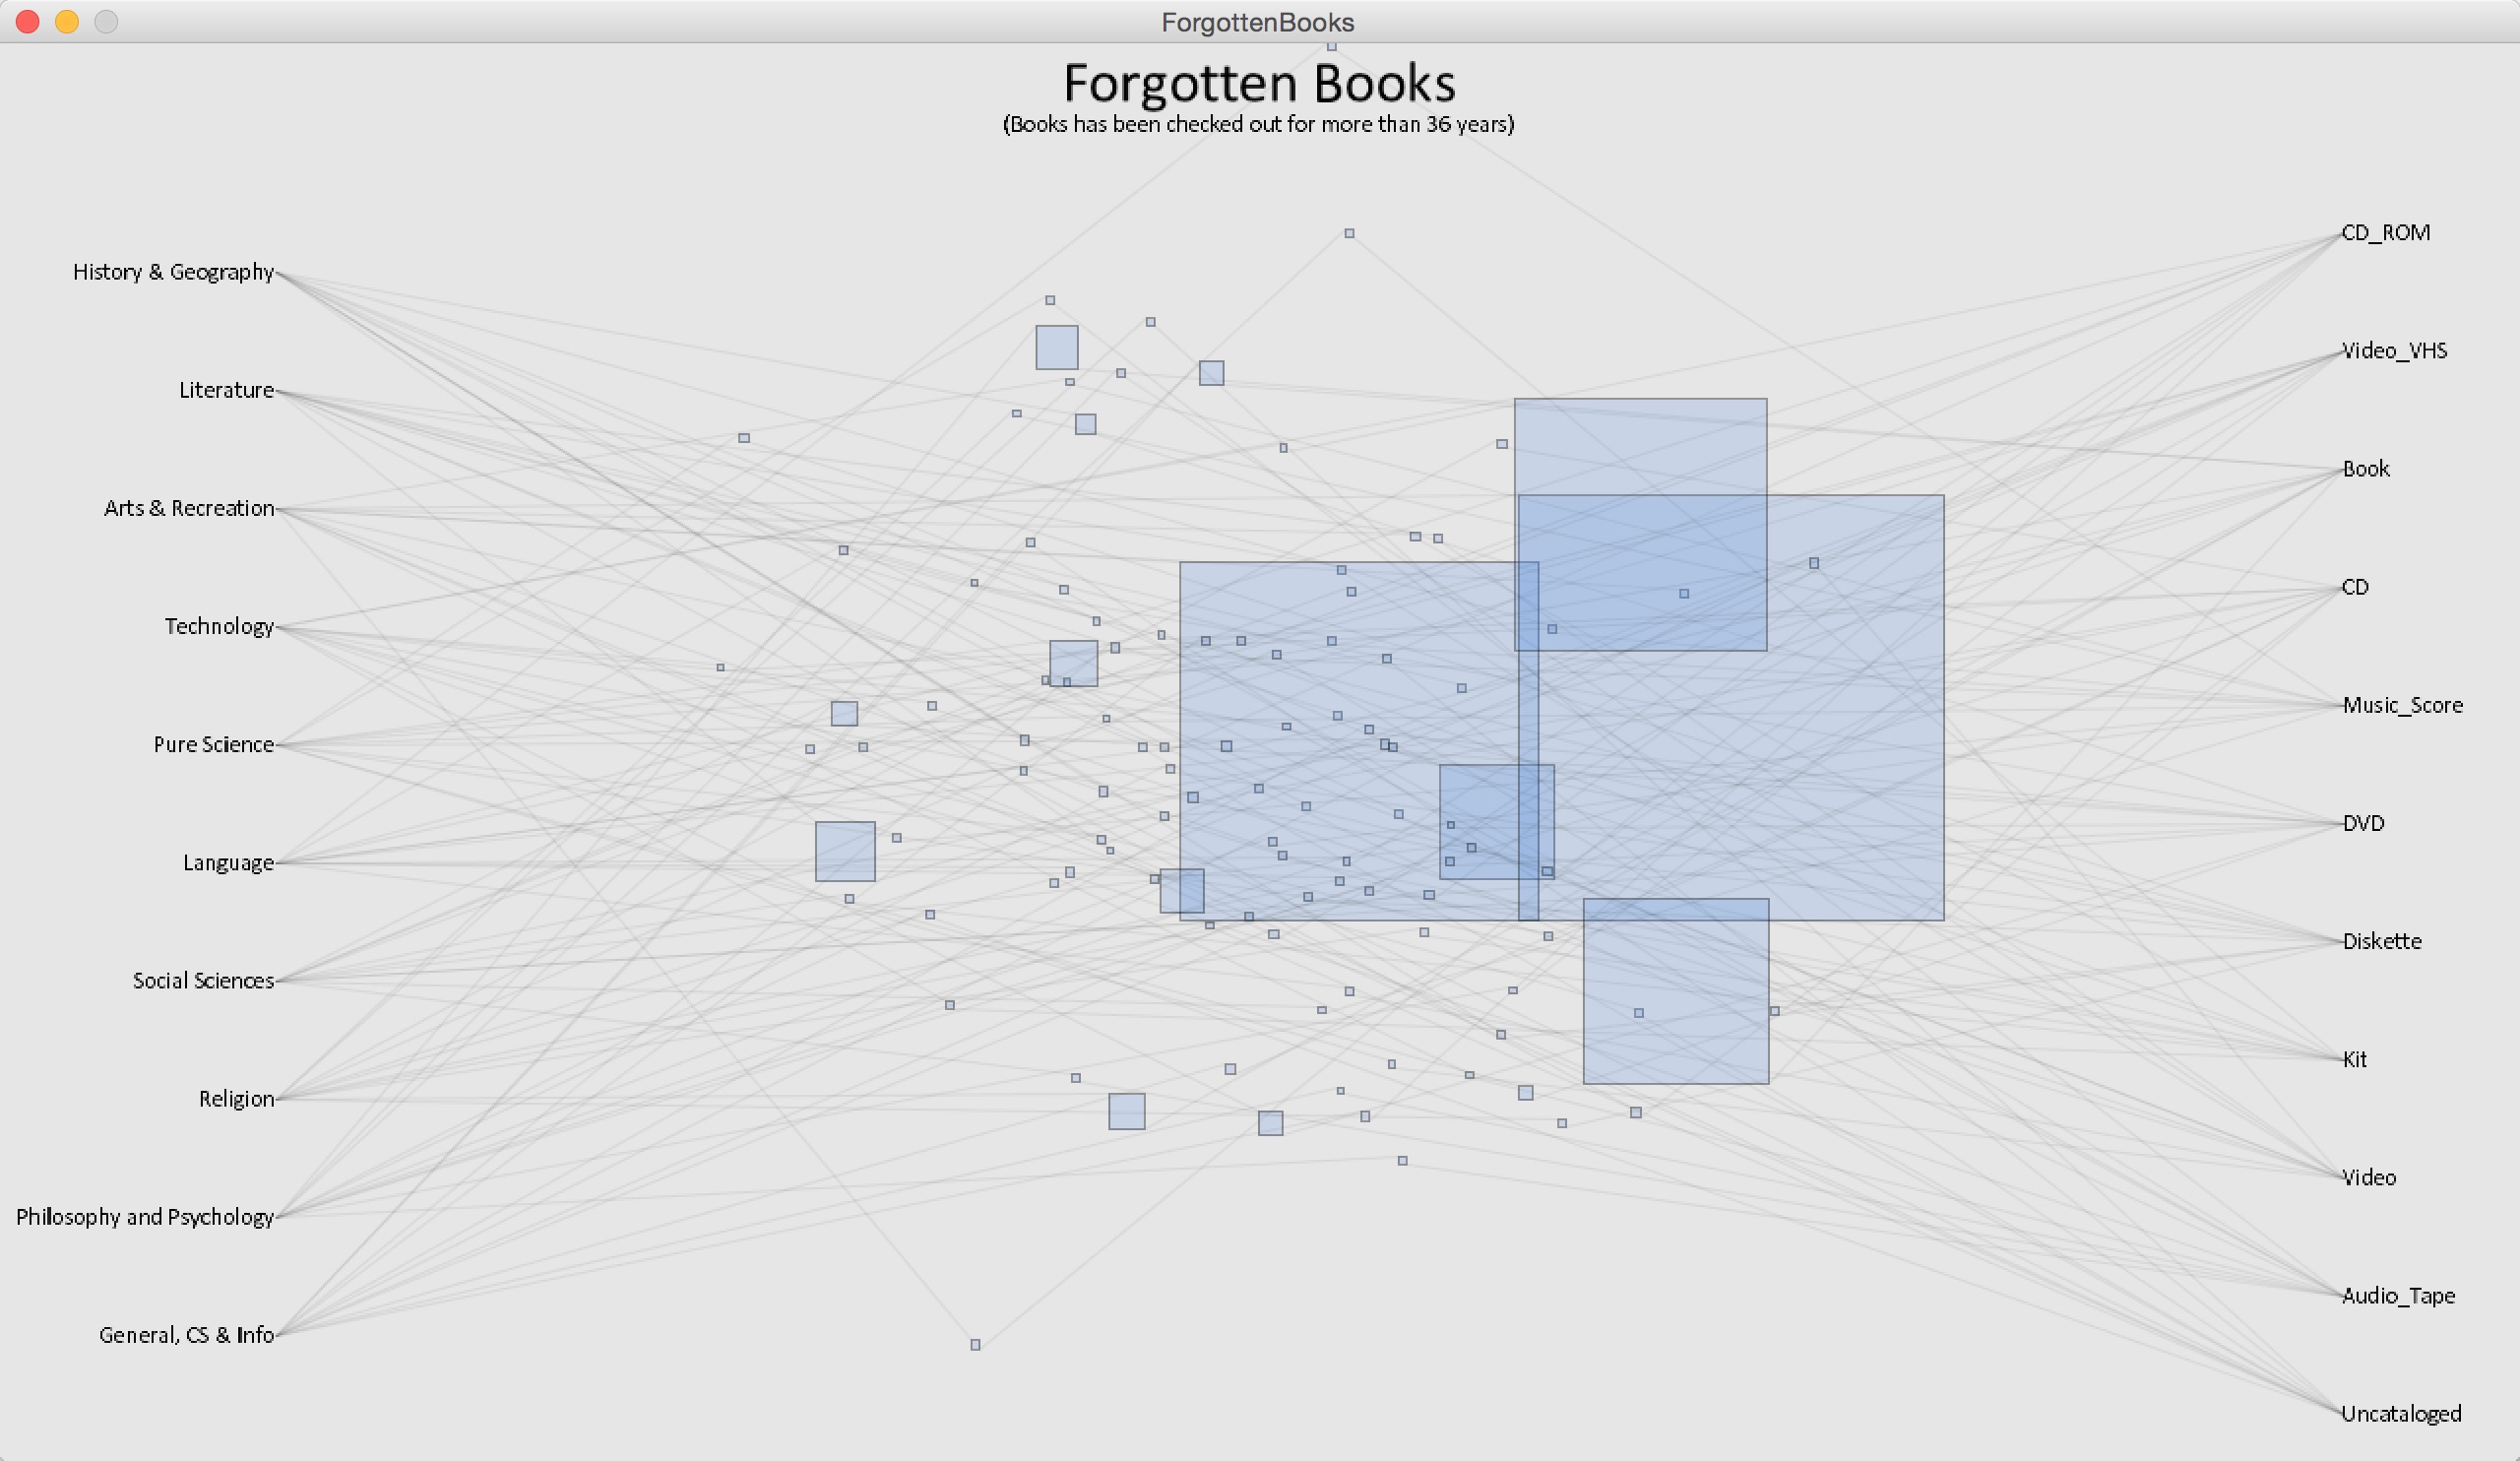
Final result
The books are grouped by Dewey Classification and item type, and each group is shaped as rectangle, which the area indicates the amounts of books in the group. The upper left corner is connected with Dewey, while the lower right is connected with item type. So from the data we can know, for example, the biggest group among the forgotten books is Arts & Recreation in CD format. The position of each rectangle is determined by noise algorithm, which represents these books are kind of noises in comparison of the whole the library.
Code