Philosophy Checkouts, vs. Month & Topic
MAT 259, 2015
Keehong Youn
Concept
What time of the year do you feel the need of philosophy?
When end of the year comes? When new year starts?
Or when the leaves start to fall?
And for that, especially what topic of philosophy?
When end of the year comes? When new year starts?
Or when the leaves start to fall?
And for that, especially what topic of philosophy?
Query
select
floor(deweyClass) as dewey,
month(checkOut) as month,
sum(timestampdiff(day, date(checkOut), date(checkIn))) as totaltime,
sum(1) as totalnum
from
spl3._rawXmlDataCheckIns
where
_rawXmlDataCheckIns.deweyClass >= 100 and
_rawXmlDataCheckIns.deweyClass < 200
and (checkOut is not null and checkIn is not null
and timestampdiff(day, date(checkOut), date(checkIn)) >= 1
and timestampdiff(day, date(checkOut), date(checkIn)) <= 100)
and (year(checkOut) >= 2013 and year(checkOut) < 2014)
group by
floor(deweyClass),
month(checkOut);
Preliminary sketches
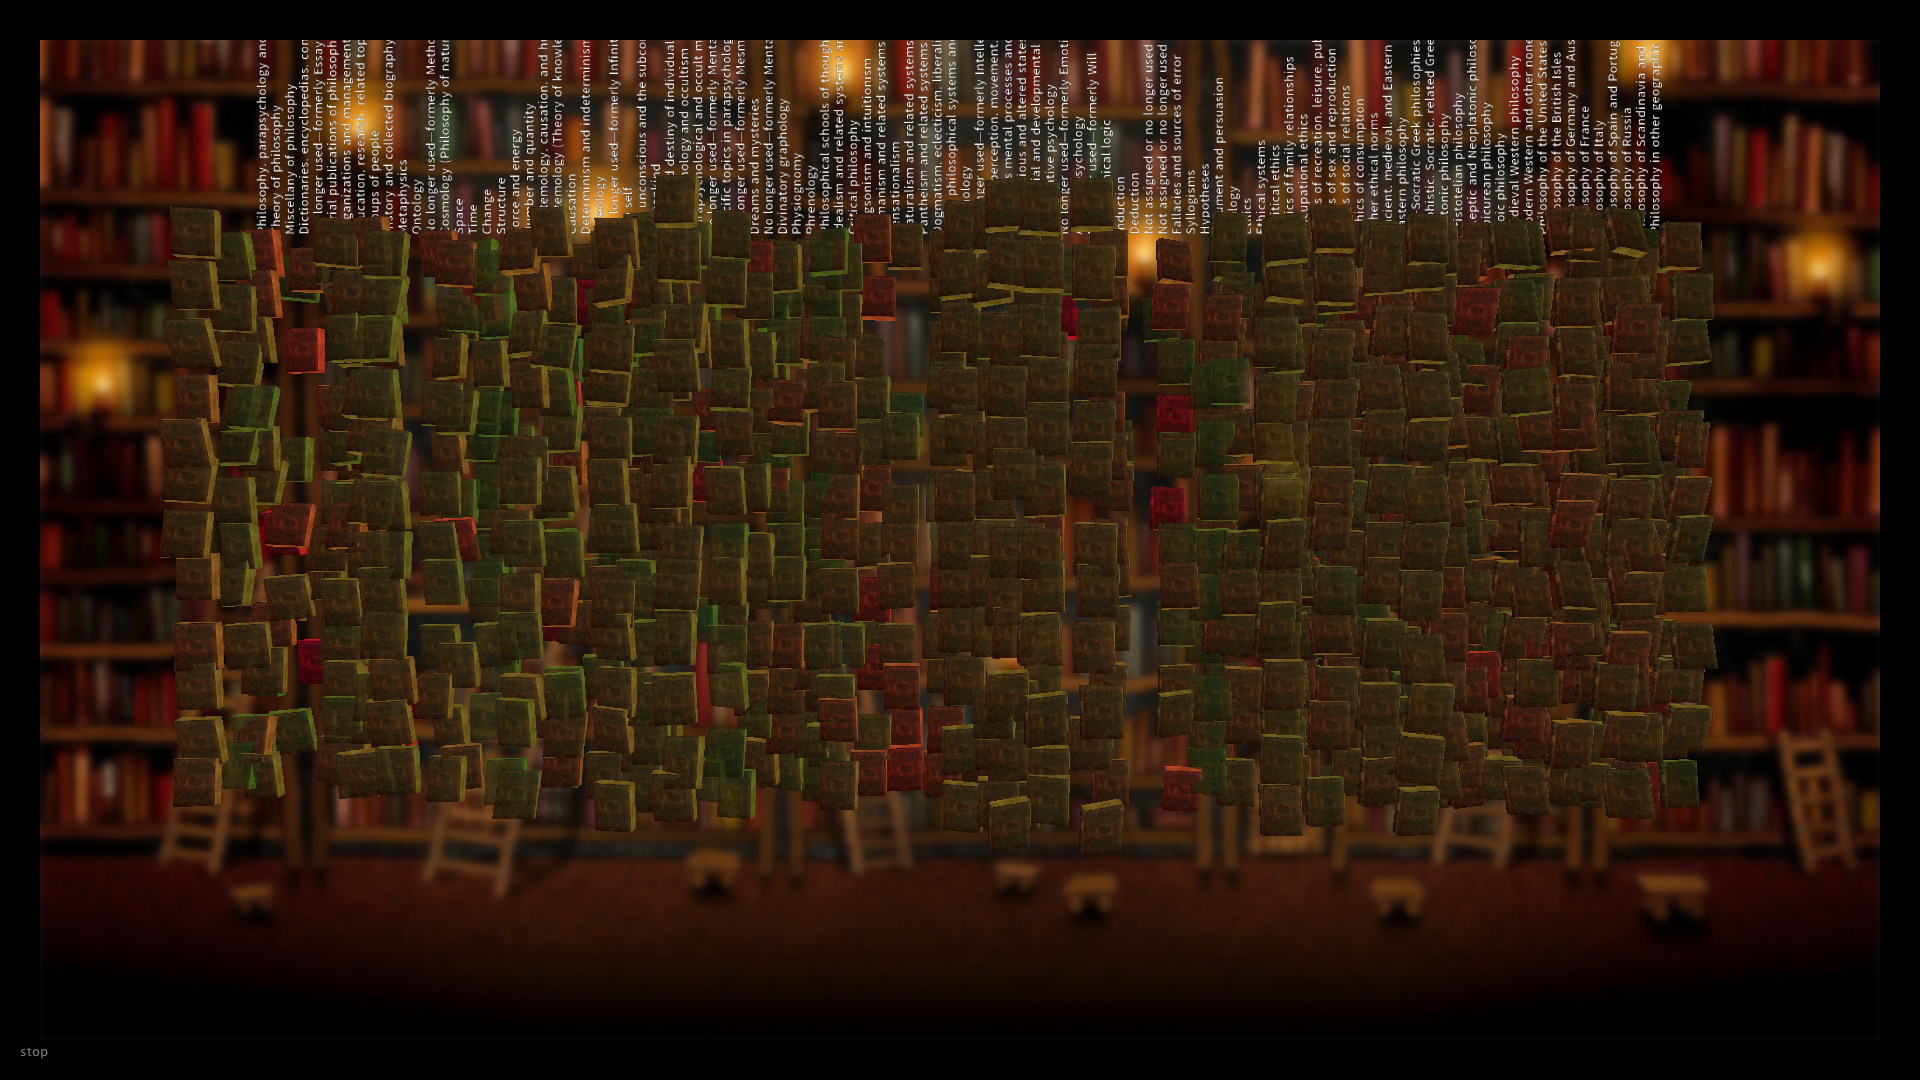
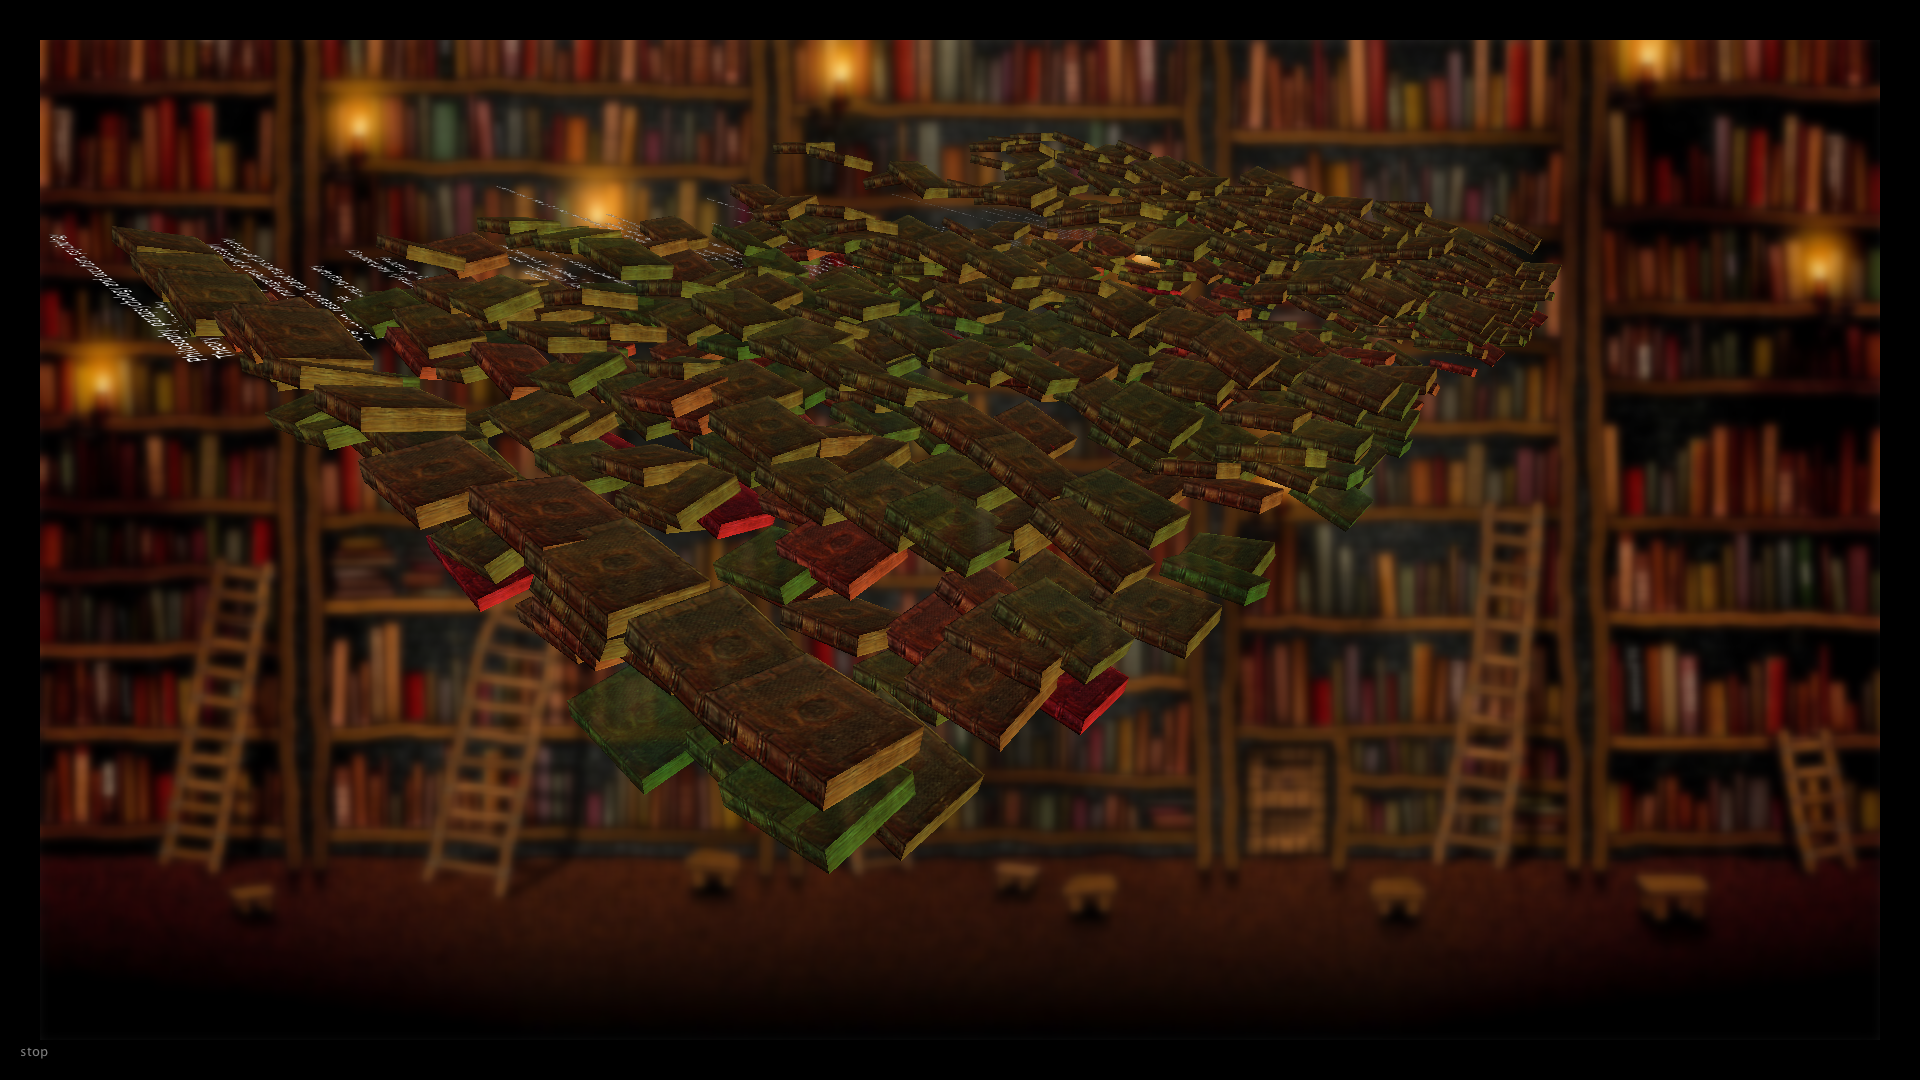
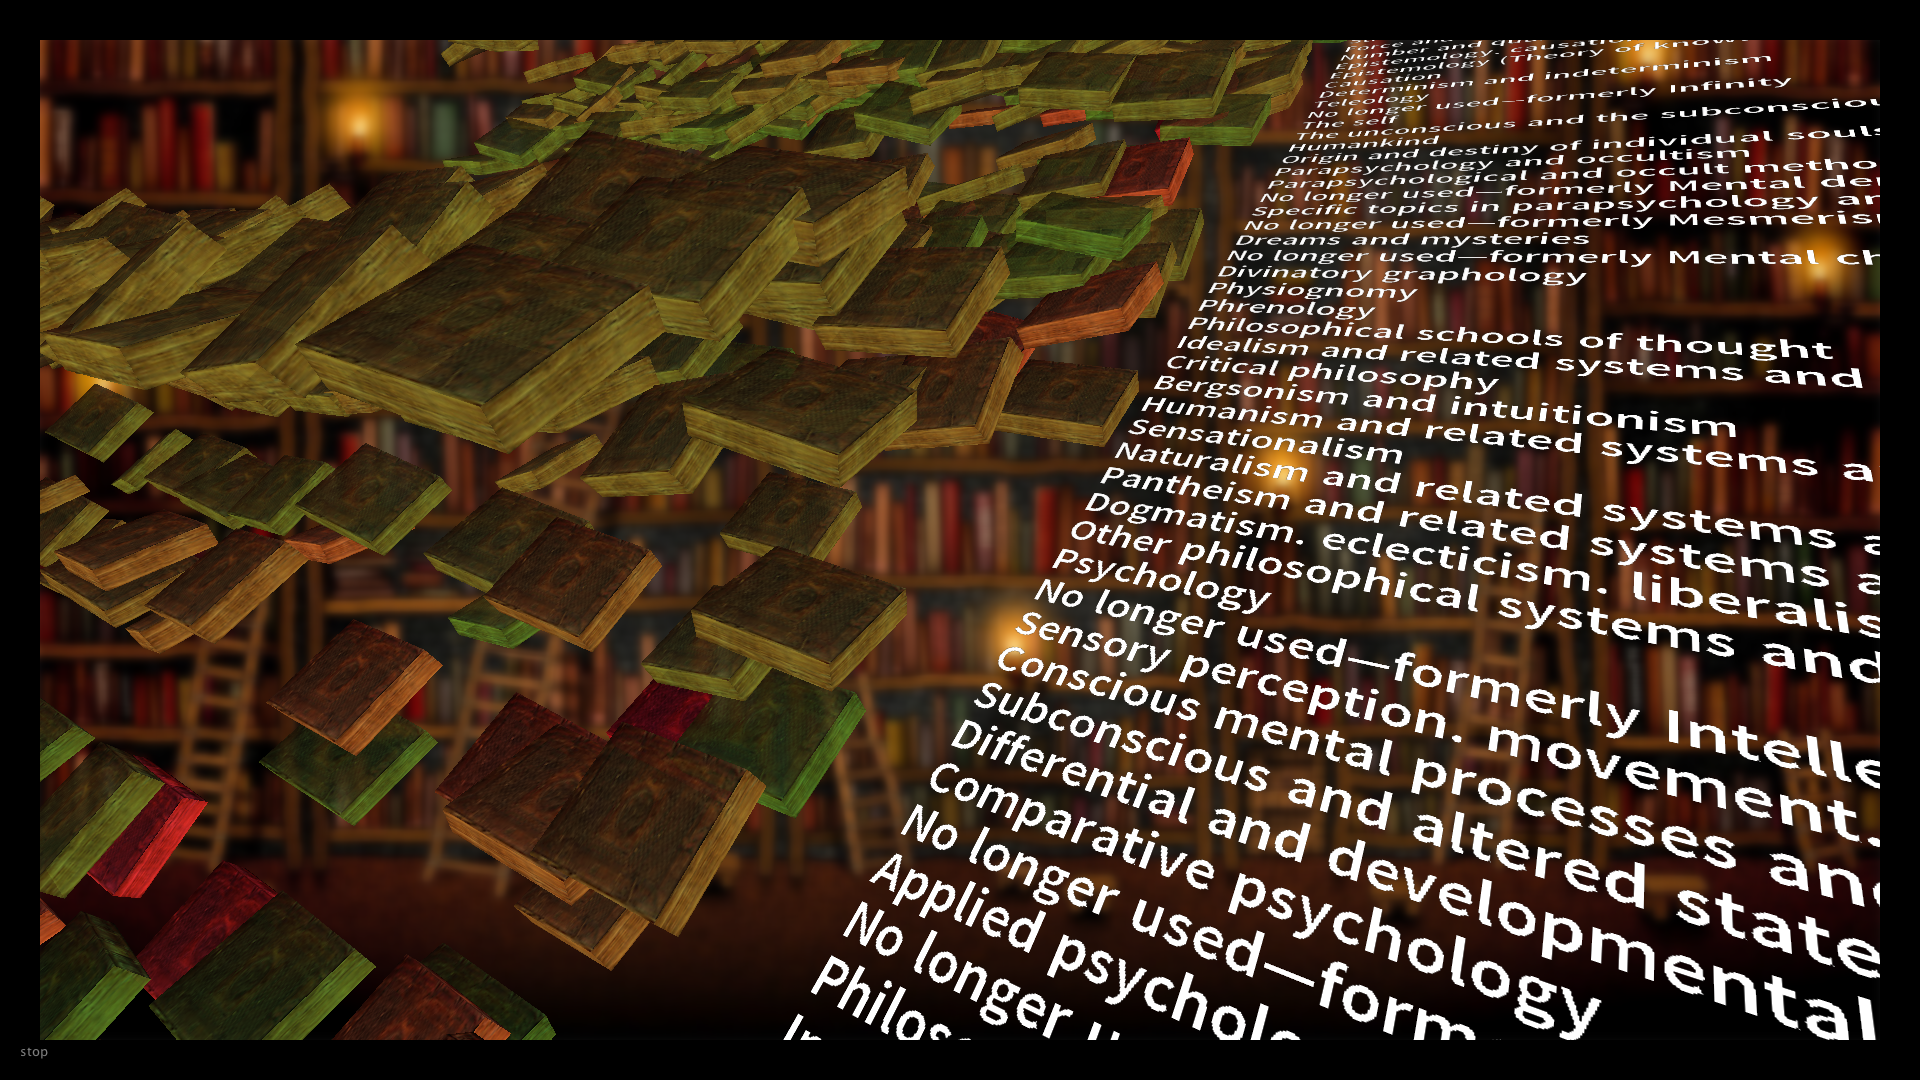
This visualization will show number of times loaned on z axis, w.r.t. the specific subject within category of philosophy and month in year. Also, longer the items loaned they will be more red-tinted.
Process
Interesting fact found is that while there's no significant change throughout the year, loan rate throughout the topics vary very much. For example, while induction & deduction related books were not loaned almost at all, books related to conscious&subconscious topics were very often loaned.
Final result
For the visual part, I tried to give impression of piled books, and also some of those flying herd of books like those in Harry Potter kind-of films. So I got a texture on data cube while giving a bit of misalignment. (which is not as big as to give misconception about data) Also put a background image of a bookshelf. I know the background might distract the focusing to the data, but it seems the whole scene is in good harmony.

Code