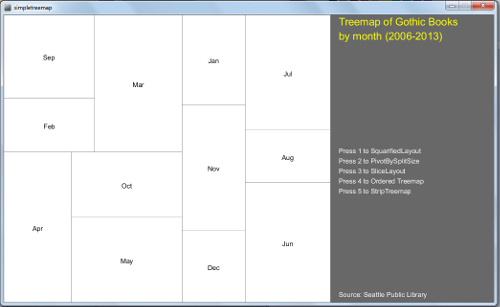
The same Matrix of Gothic Books is analyzed in a Treemap. At this time, it is possible to visualize the checkouts by month for all the Gothic Books or for each of eight books: The Hound of Baskervilles, Dracula, Frankenstein, Dr. Jekyll and Mr. Hyde, Northanger Abbey, Edgar Allan Poe and The Mysteries of Udolpho. It is also possible to try four different algorithms, providing different layout representations, changing the format from more squarified to striped versions. As a result, one can have up to 32 different visualizations of the data.
Same of the previous work, except that this time I didn't use the control group (Travels with Charlie and Into the Wield):
SELECT
MONTH(cout),
YEAR(cout),
COUNT(IF(TITLE LIKE
'%Udolpho%', 1, NULL)) AS 'Mysteries of Udolpho',
COUNT(IF(TITLE LIKE '%Baskervilles%', 1, NULL)) AS 'The Hound of the
Baskervilles',
COUNT(IF(TITLE LIKE '%Dracula%', 1, NULL)) AS
'Dracula',
COUNT(IF(TITLE LIKE '%Edgar Allan Poe%',
1,
NULL)) AS 'Edgar Allan Poe',
COUNT(IF(TITLE LIKE
'%Northanger%', 1, NULL)) AS 'Northanger Abbey',
COUNT(IF(TITLE LIKE '%Frankenstein%', 1, NULL)) AS 'Frankenstein',
COUNT(IF(TITLE LIKE '%Jekyll%', 1, NULL)) AS 'Dr. Jekyll and Mr.
Hyde',
COUNT(IF(TITLE LIKE '%Into the Wild%',
1,
NULL)) AS 'Into the Wild'
FROM
spl2.inraw
WHERE
itemtype = 'acbk'
AND DATE(cout) >= '2006-01- 01'
AND DATE(cout) <= '2013-12-31'
GROUP BY MONTH(cout) ,
YEAR(cout)
ORDER BY YEAR(cout) , MONTH(cout)
I added the covers of each book to make the identification easier; for the visualization of "All Gothic Books", I created a fake cover, using one image of the movie "Dracula". As all the covers have the black color as a common element, I also changed the background to black. This gives an impression that the covers are merging with the background, making the visual more clean and avoiding excessive use of different colors.
I colored the treemap with a variation of colors according to the width and height of each cell. As most of the books have shades of red and blue, I decided to use shades of green in the treemap. I think that was the best way to divide the areas of the treemap and the text box, avoiding confusion.
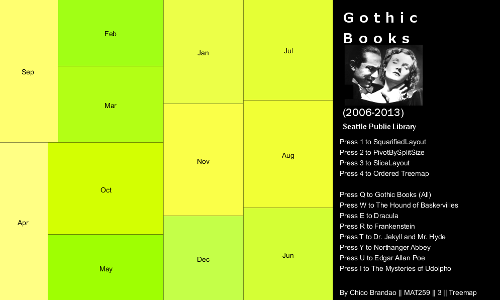
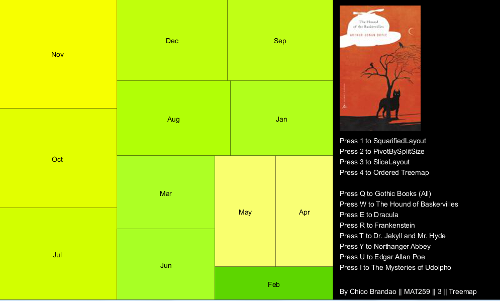
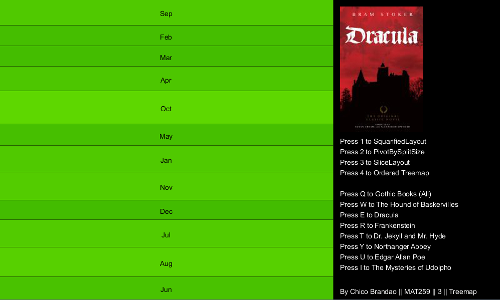
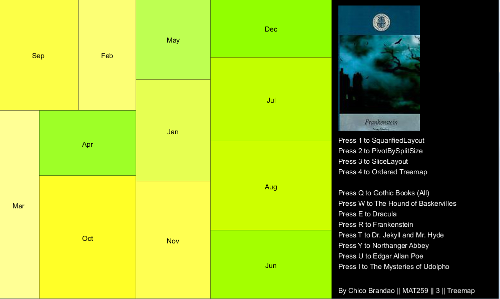
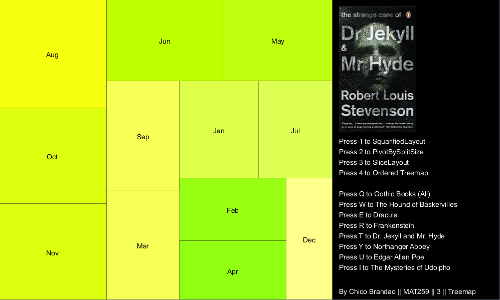
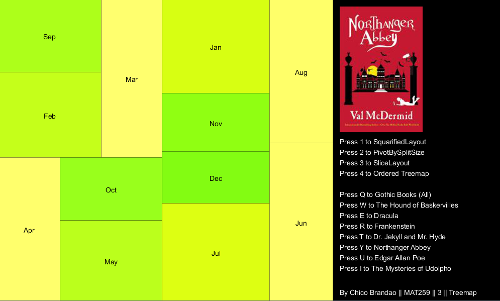
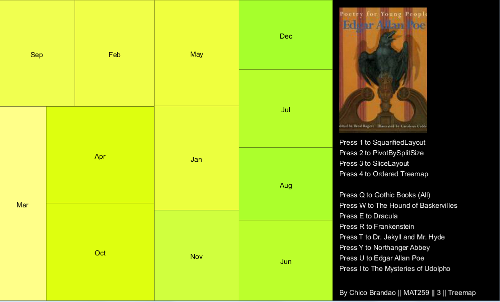
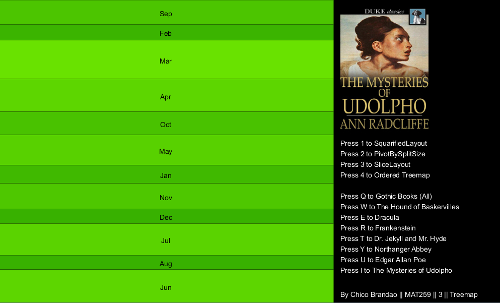
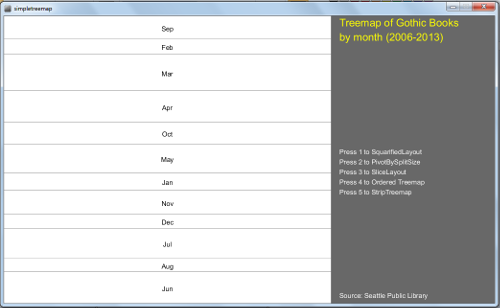
Most of the books have similar distributions by month. The variation across months and books is better perceived depending on the layout/algorithm of the distribution. As an example, the Slice Layout, with the same width for all months, didn't have much differentiation of color. But above all, I think treemaps were very useful to have a fast and categorical understanding of the data.
Library Treemap, from Ben Fry's book. Key press 1 for SquarifiedLayout; 2 for PivotBySplitSize; 3 for SliceLayout; 4 for Ordered Treemap; Press 'q' for all Gothic books; Press 'w', 'e', 'r', 't', 'y', 'u', 'i' for each of the seven books.
Source Code + Data