3D Radial Diagram
MAT 259, 2015
Anastasiya Lazareva
Concept
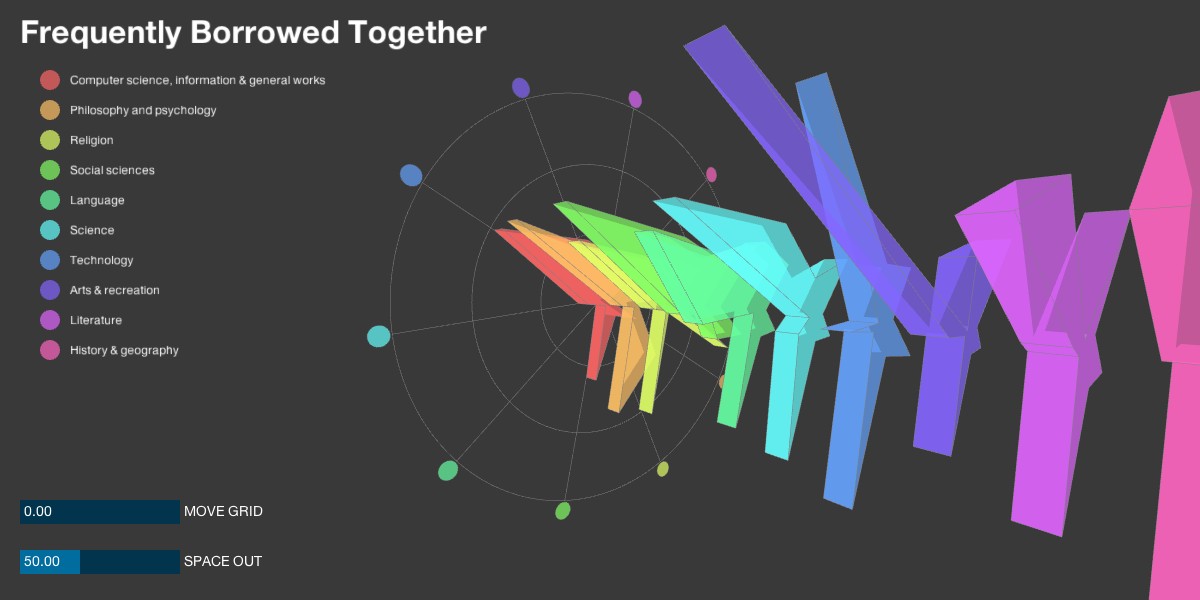
For this project I created a 3D version of a spider diagram. The dataset was more granular than in my previous visualization.
Query
select
floor(t1.deweyClass/100)*100 as dewey1,
floor(t2.deweyClass/100)*100 as dewey2
from
spl2.inraw as t1,
spl2.inraw as t2
where
t1.cout = t2.cout and t1.cin = t2.cin
and t1.itemNumber != t2.itemNumber
and t1.deweyClass != ''
and t2.deweyClass != ''
and year(t1.cout) > 2010;
Preliminary sketches
Initially I used a dataset that looked at grouped dewey categoires into 9 buckets. I later added some volume to the series items. Finally, I expaned my dataset to include 99 dewey category buckets whch made the visualization a little more interesting to explore.
Process
Final result
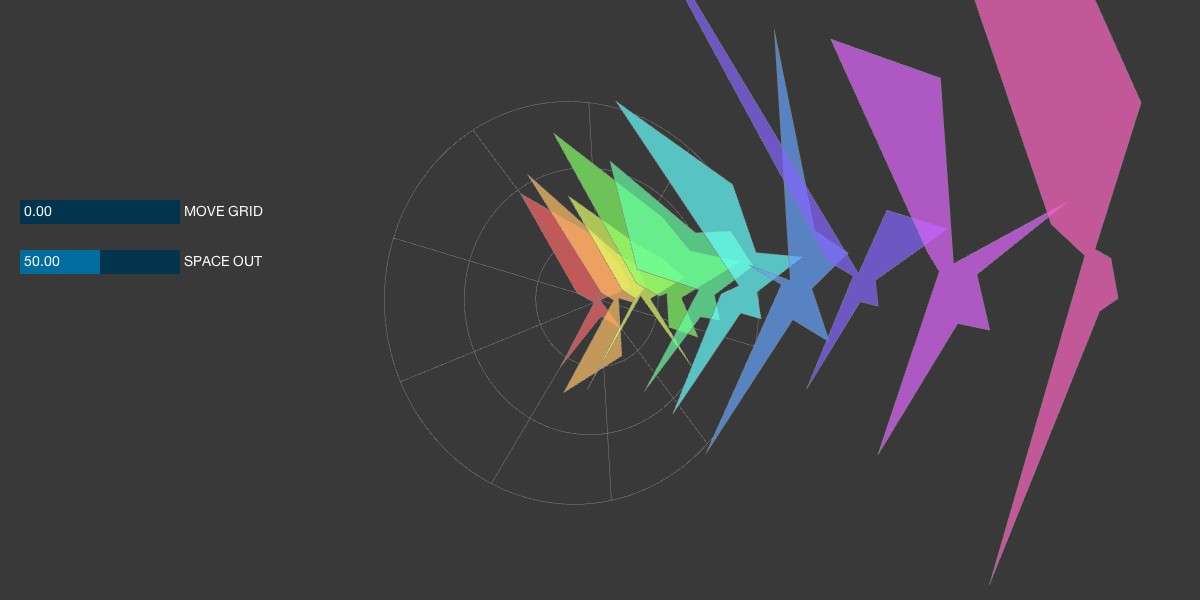
Although this visualization isn't great for giving a precise look at the data, it looks dynamic and interesting.

Code
I used Processing.
Control: The user can use the Control P5 controls to space out the diagram and to move the grid.
Source Code + Data
Control: The user can use the Control P5 controls to space out the diagram and to move the grid.
Source Code + Data