Borrowed Together Co-occurrence matrix
MAT 259, 2015
Anastasiya Lazareva
Concept
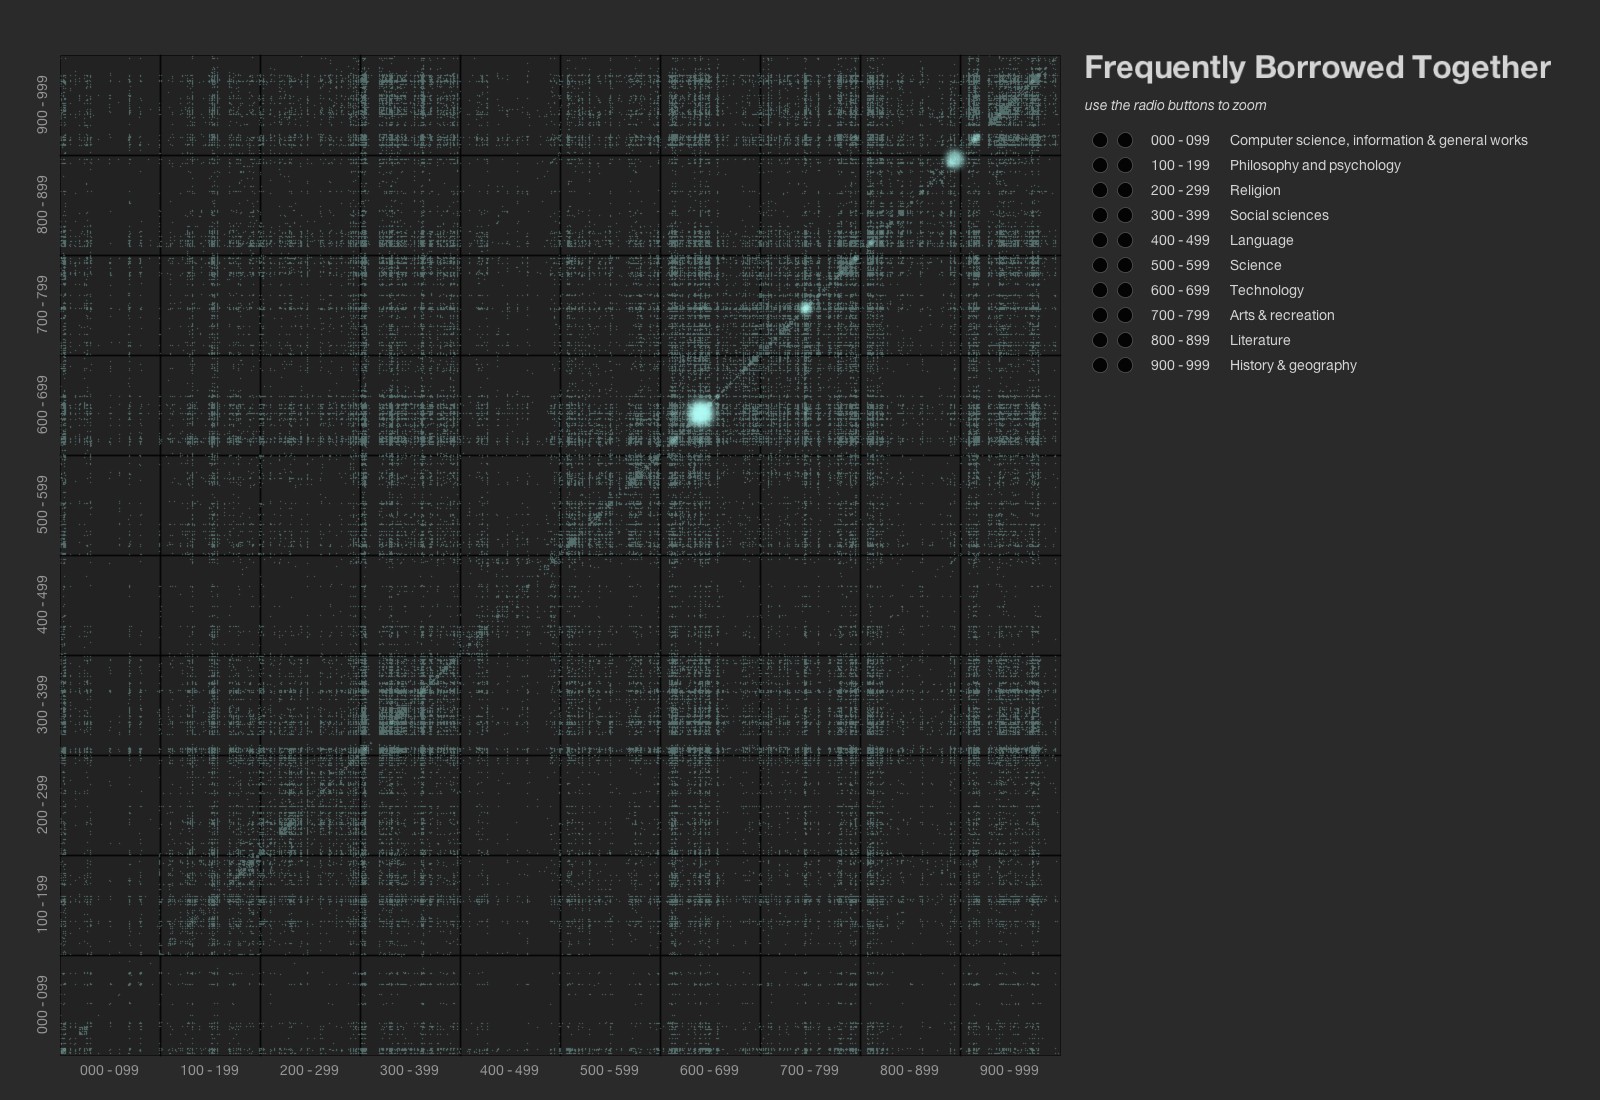
I wanted to create a high-level view of my co-occurrence dataset, but also give the user the ability to zoom in for a granular view. I wanted to create something that looked like a satellite image of the earth at night where you can see developed areas as brighter clusters of lights. For this I used transparency and image size to encode frequency information. More frequently co-occurring classes show up brighter and bigger. I used an 'orb' image from Reza's OpenGL demo.
Query
select
floor(t1.deweyClass) as dewey1,
floor(t2.deweyClass) as dewey2
from
spl2.inraw as t1,
spl2.inraw as t2
where
t1.cout = t2.cout and t1.cin = t2.cin
and t1.itemNumber != t2.itemNumber
and t1.deweyClass != ''
and t2.deweyClass != ''
and year(t1.cout) > 2010;
Preliminary sketches
There were no initial scketches for this project.
Process
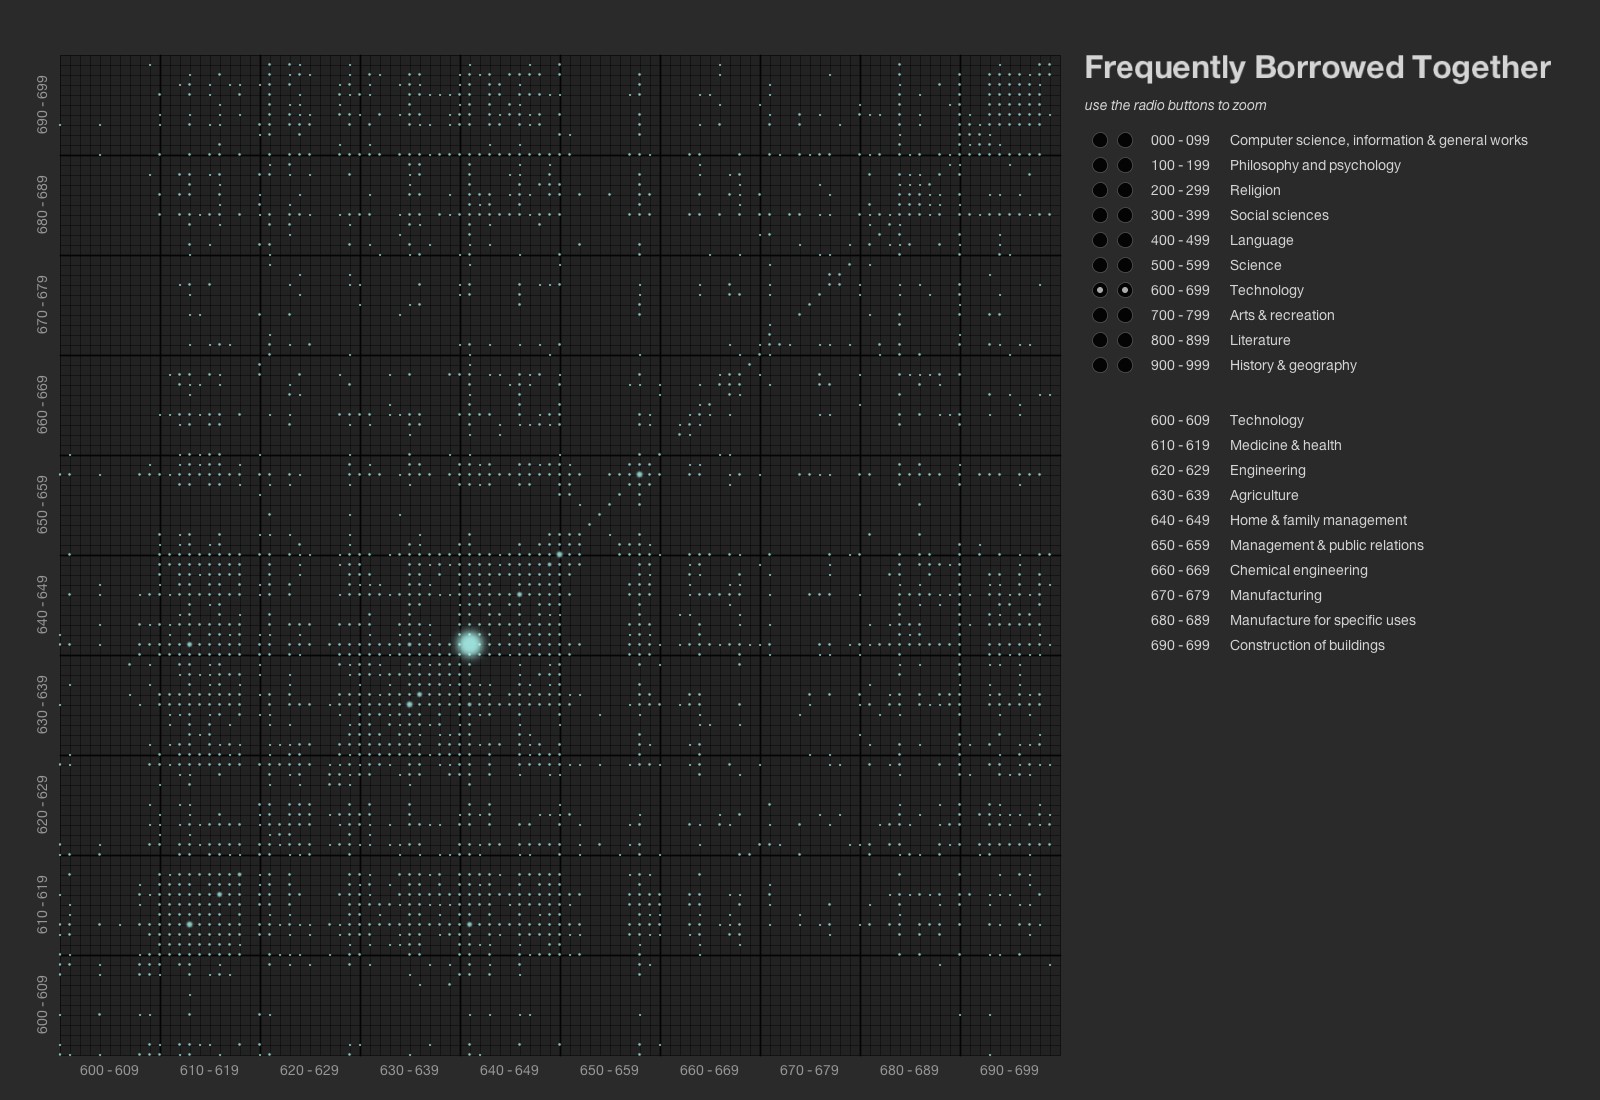
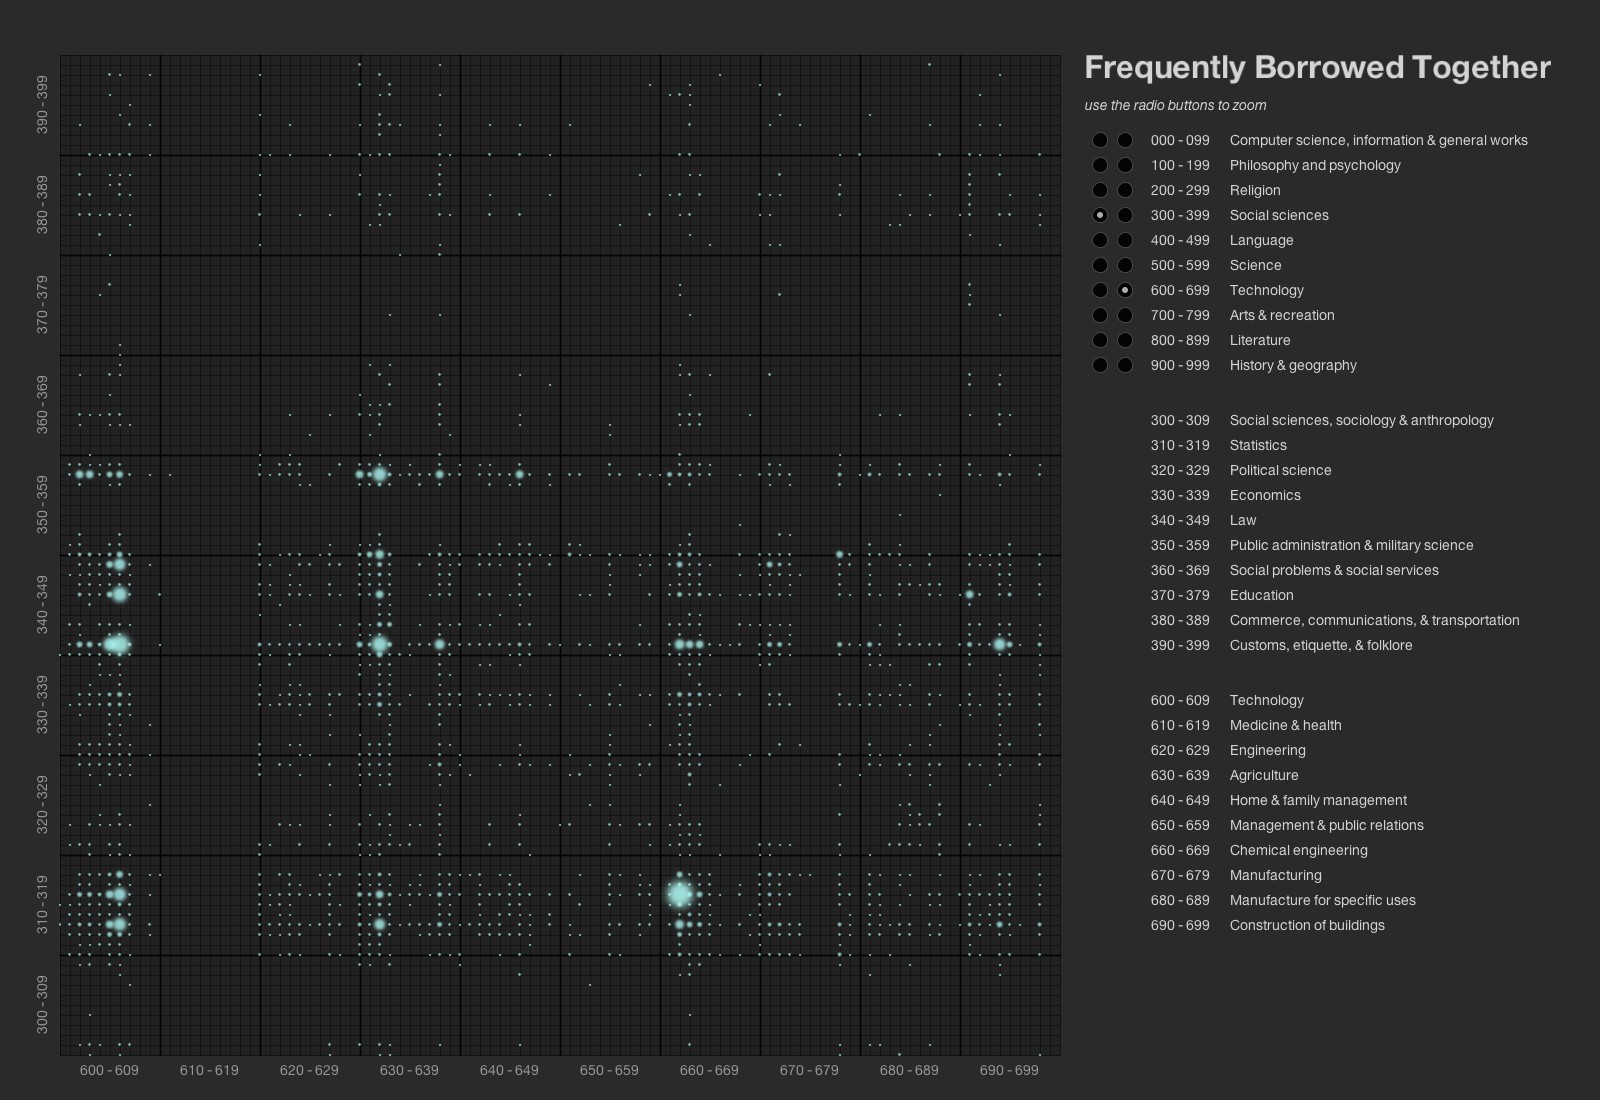
I used brightness and size to encode the co-occurance of checkouts. I also wanted to give the user the ability to zoom in on each individual grid item to see more detail so I added radio buttons that let the user select dewey categories to zoom into.
Final result
This query returned 1,363,686 records and a max co-occurrence of 180,695. Interestingly a large fraction of them were comic books that had been borrowed together (Dewey 741). In my code, I give the option to include the comic book data, which dominates the high level visualization. Removing the comic books results in a dataset of 968,566 and a max co-occurrence of 28,971. Visualizing the data reveals the fact that most books that are checked out together are within the same dewey category.
Code
I used Processing.
Control: the controls appear in the interface, they are radio buttons that allow the user to select dewey categories
Source Code + Data
Control: the controls appear in the interface, they are radio buttons that allow the user to select dewey categories
Source Code + Data