Project 4: 3D Interactive Visualization
MAT 259, 2014
Song Gao, Department of Geography
Concept
For this project, I am interested in exploring the temporal check-out patterns of all dewey classes and classify all 1000 sessions into different clustered groups/dispersed outliers based on their temporal signature similarities and investigating how to effectively visualize temporal patterns and classification results together in an interactive 3D environment.
Visual Design and Color
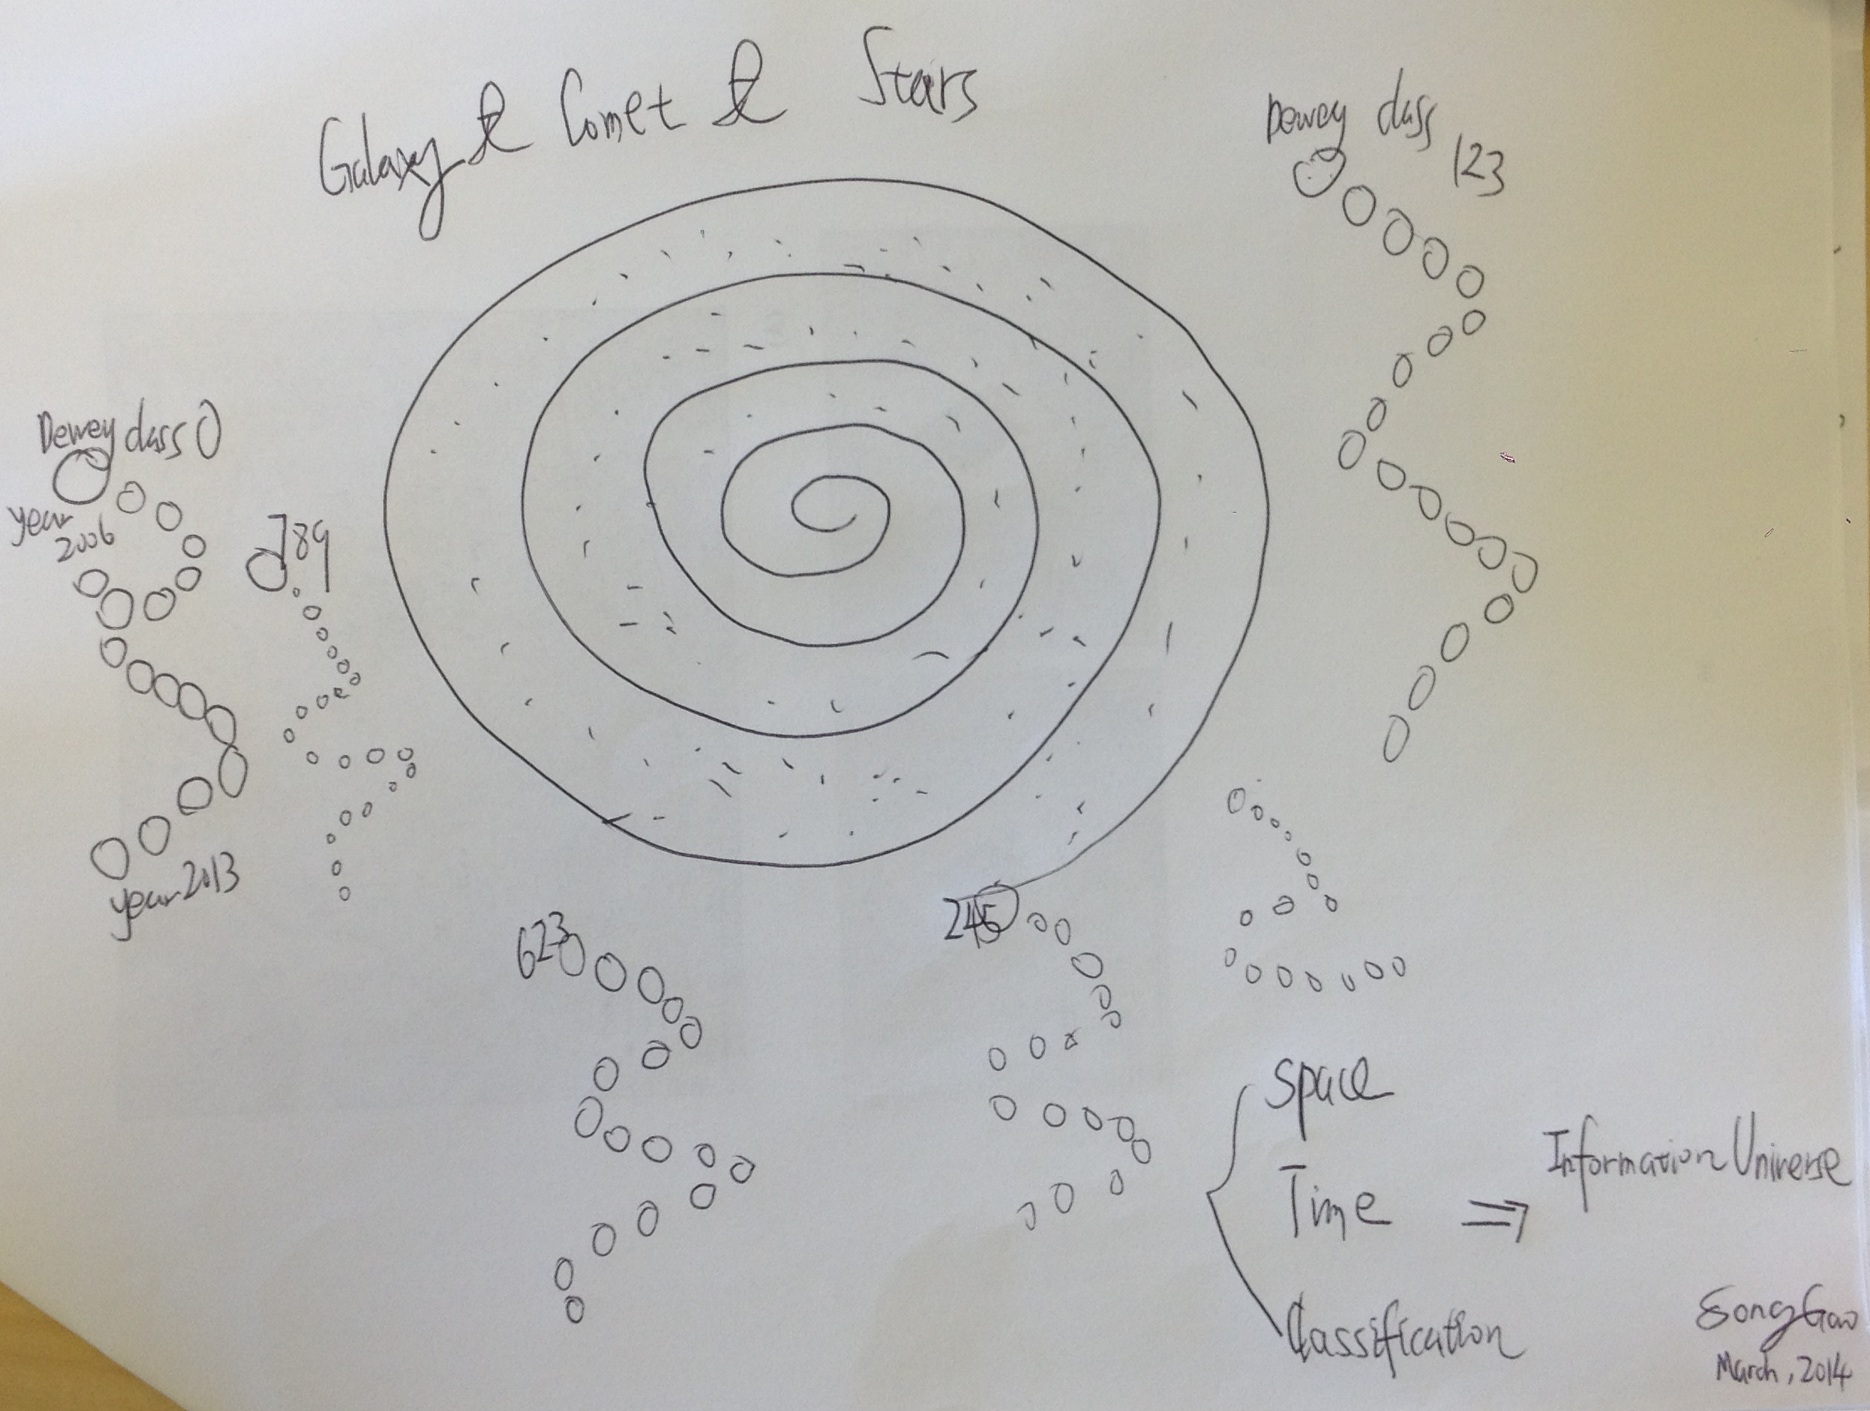
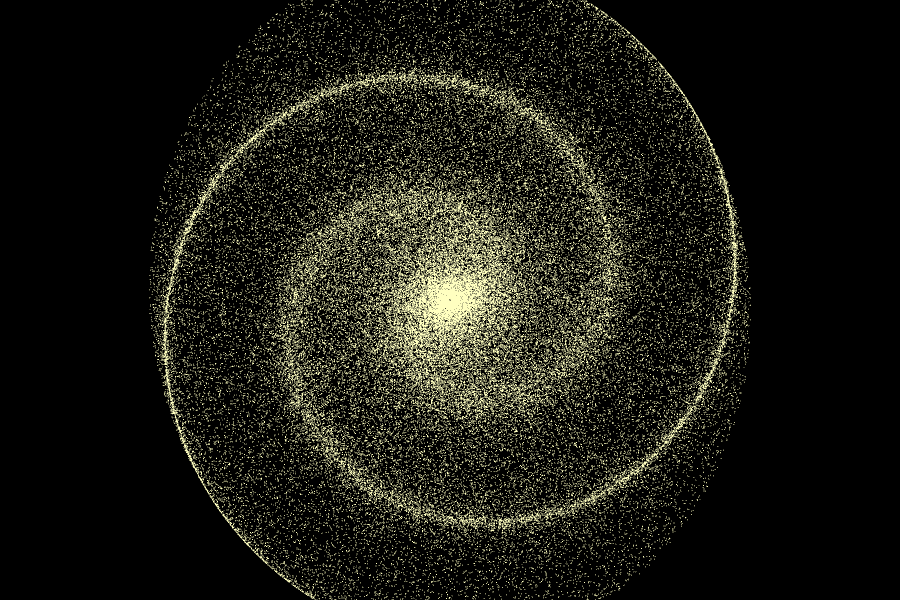
We are the astronomers of the information universe! I would like to integrate the beauty of the universe/galaxies pictures captured by space telescopes into consideration for the design of visualizing the clusters of dewey classes. The color hue schema will refer to the galaxy color and brightness analog to the sparking and glowing galaxies.


Time Schedule
(1)2014.03.01~03.04: Develop the query and collect the data from Seattle Public Library; Preprocess the raw data into appropriate data formats/structure for better visual interacton.
(2)2014.03.04~03.07: Implement the classification algorithm to classify all 1000 dewey classes based on their temporal check-out frequencies.
(3)2014.03.07~03.13: Detailed visual design and implementation in Processing; discuss with classmates and receive feedback.
(4)2014.03.14~03.18: Improve the project based on feedback and comments; Prepare for the final presentation.
Query
(1) Daily Dewey Classes Check-outs in the Year 2013
SELECT dayofyear(cout), floor(deweyClass) AS dewey, count(*) /*select the dewey decimal classes by integer dewey sessions*/
FROM inraw
WHERE deweyClass is not null AND (cout)>"2013-01-01" AND date(cout)<"2013-12-31"
GROUP BY dayofyear(cout), dewey;
Processing Time: 37.034 seconds and 142336 rows returned.
(2) Monthly Dewey Classes Check-outs between the years 2007~2013
SELECT year(cout), month(cout), floor(deweyClass) AS dewey, count(*)
FROM inraw
WHERE deweyClass is not null AND (cout)>"2006-01-01" AND date(cout)<"2013-12-31"
GROUP BY year(cout), month(cout), dewey;
Processing Time: 93.179 seconds and 72201 rows returned.
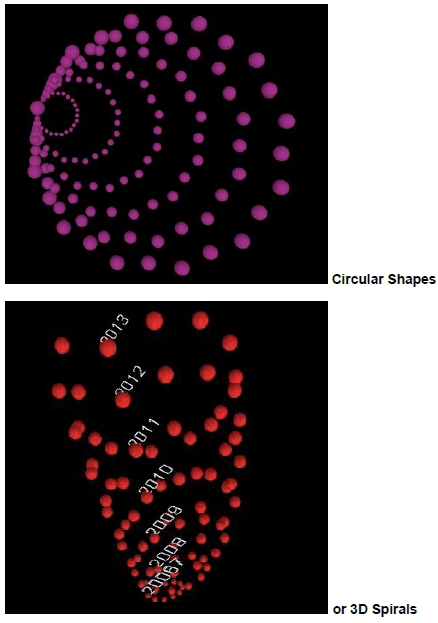
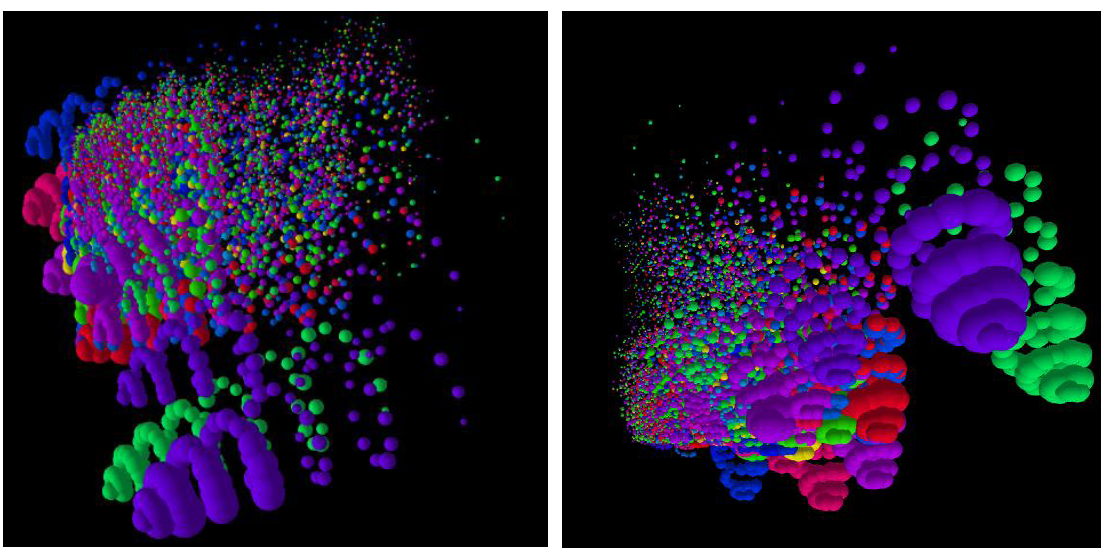
Then, it adds one dewey class of 3D spiral “comet” into the library “information universe”, which it is actually an integration of Space and Time in the data visualization.
Adding more spatio-temporal 3D spirals to present more dewey classes.
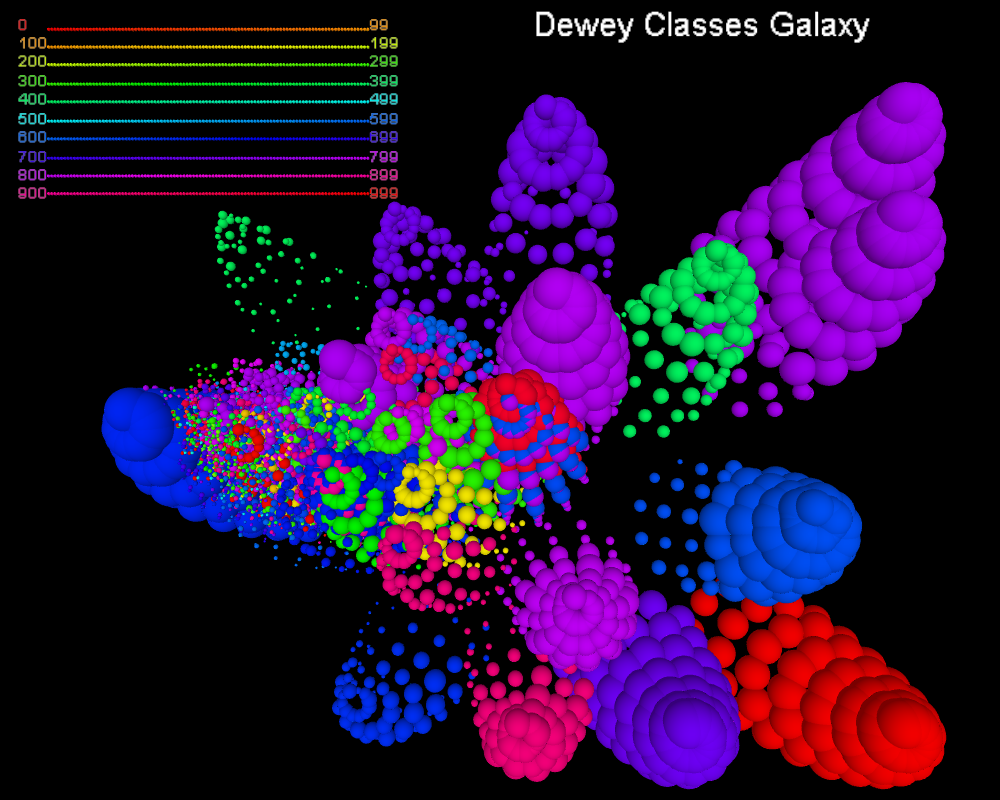
The MDS clustering layout of all dewey class spirals. The spatial closeness among the spirals indicates the similarity of these dewey classes based on their temporal check-out patterns. Note that because of the machine memory limits, it shows most of dewey classes as 3D globes whose temporal check-out probabilities are larger than a threshold value (e.g. 0.066 in the current visualization product) and one can change setting parameter in the Processing code. Other dewey classes whose temporal check-out probabilities are smaller than the threshold value, they are analogous to the sparkling star points in the galaxy.
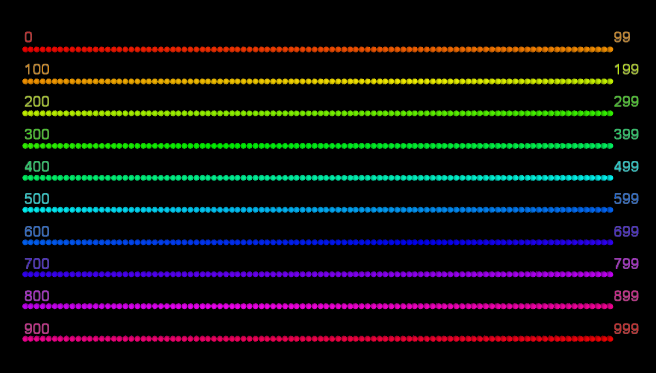
The color bar legend shows the Hue value for each dewey class and the color hue scale has been change into 0~1000 in order to fit to all dewey classes.
SELECT dayofyear(cout), floor(deweyClass) AS dewey, count(*) /*select the dewey decimal classes by integer dewey sessions*/
FROM inraw
WHERE deweyClass is not null AND (cout)>"2013-01-01" AND date(cout)<"2013-12-31"
GROUP BY dayofyear(cout), dewey;
Processing Time: 37.034 seconds and 142336 rows returned.
(2) Monthly Dewey Classes Check-outs between the years 2007~2013
SELECT year(cout), month(cout), floor(deweyClass) AS dewey, count(*)
FROM inraw
WHERE deweyClass is not null AND (cout)>"2006-01-01" AND date(cout)<"2013-12-31"
GROUP BY year(cout), month(cout), dewey;
Processing Time: 93.179 seconds and 72201 rows returned.
Data
These exported query data can be downloaded at:
2013DailyDeweyCheckouts.csv
2006_2013_MonthlyDeweyCheckouts.csv
2013DailyDeweyCheckouts.csv
2006_2013_MonthlyDeweyCheckouts.csv
Doodle
Clustering Procedures and Visual Products
Procedure 1:
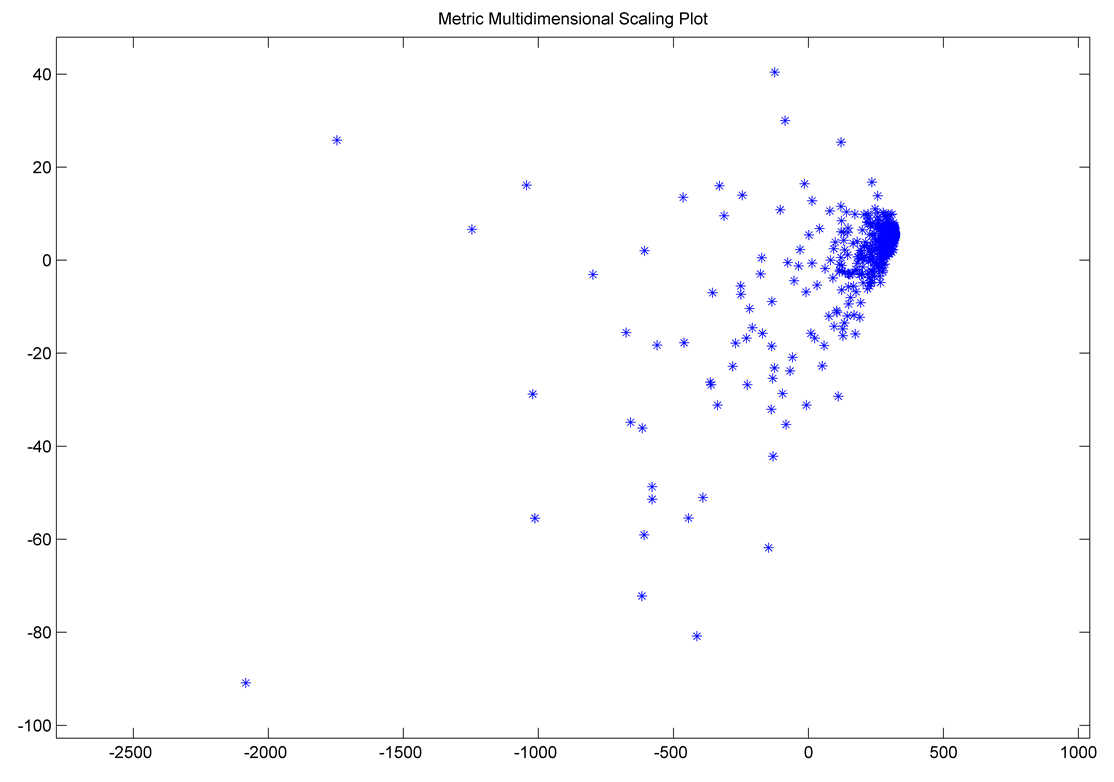
I need to cluster all dewey classes based on their check-outs temporal patterns by using Multidimensional Scaling (MDS). The MDS method can help to visualize the similarity of dewey classes. It refers to a set of related ordination techniques that have been widely used in information visualization. An MDS algorithm aims to layout each individual class in a N-dimensional space such that the between-class similarities or distances are preserved as well as possible. The results of MDS can assign a coordinate to each dewey class.
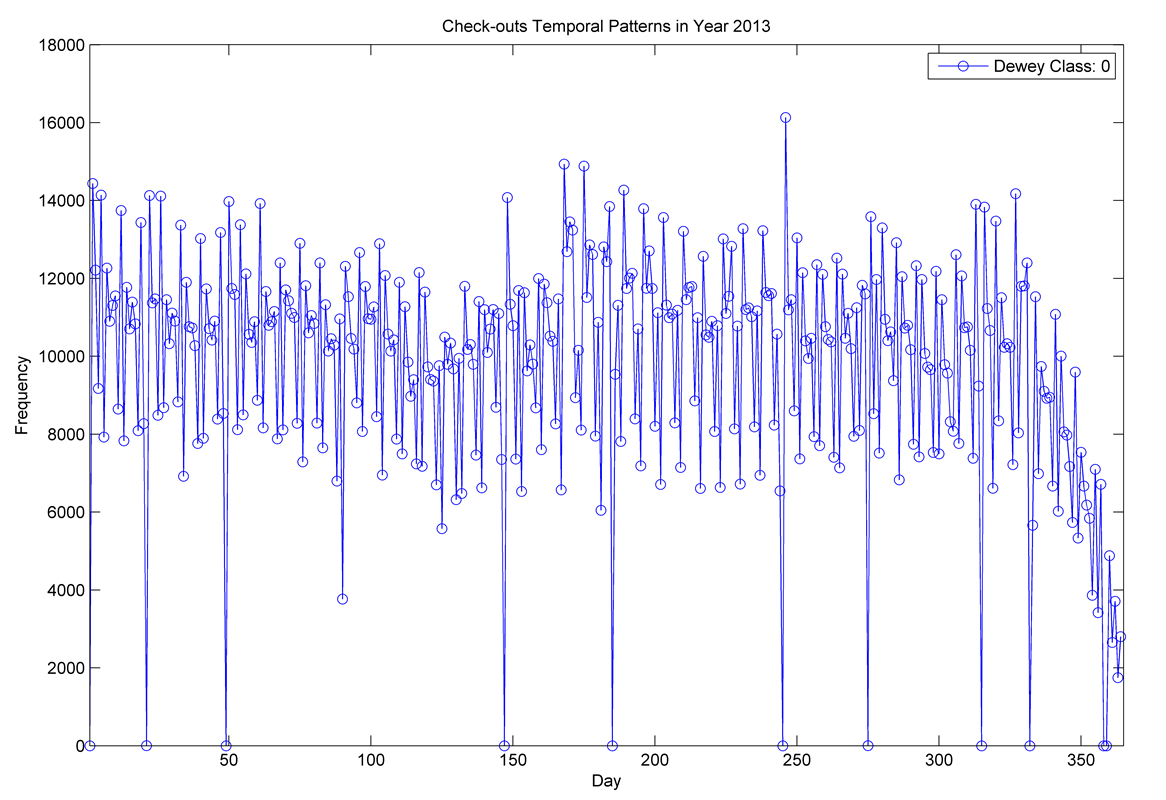
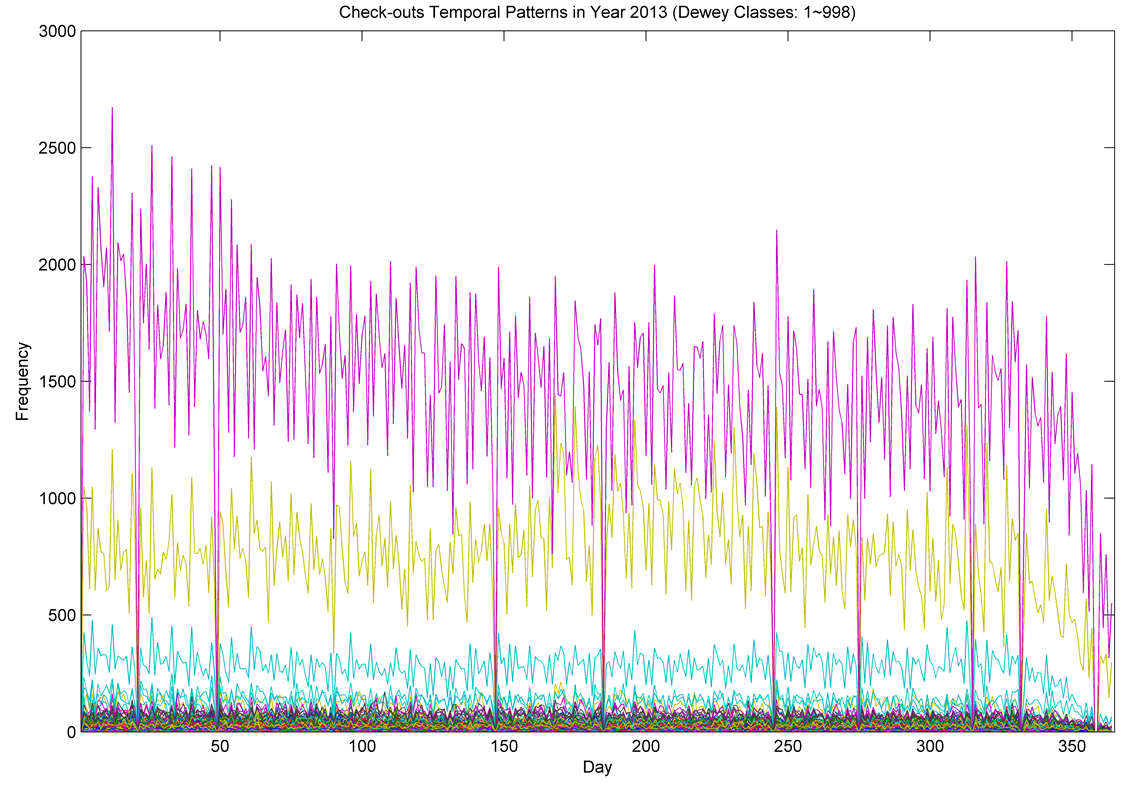
The time series graphs of check-outs patterns for all dewey classes are shown as follows: (It indicates that the magnitude of check-outs frequency of several dewey classes such as Class 0 is too large, it might to be considered as a outlier.)
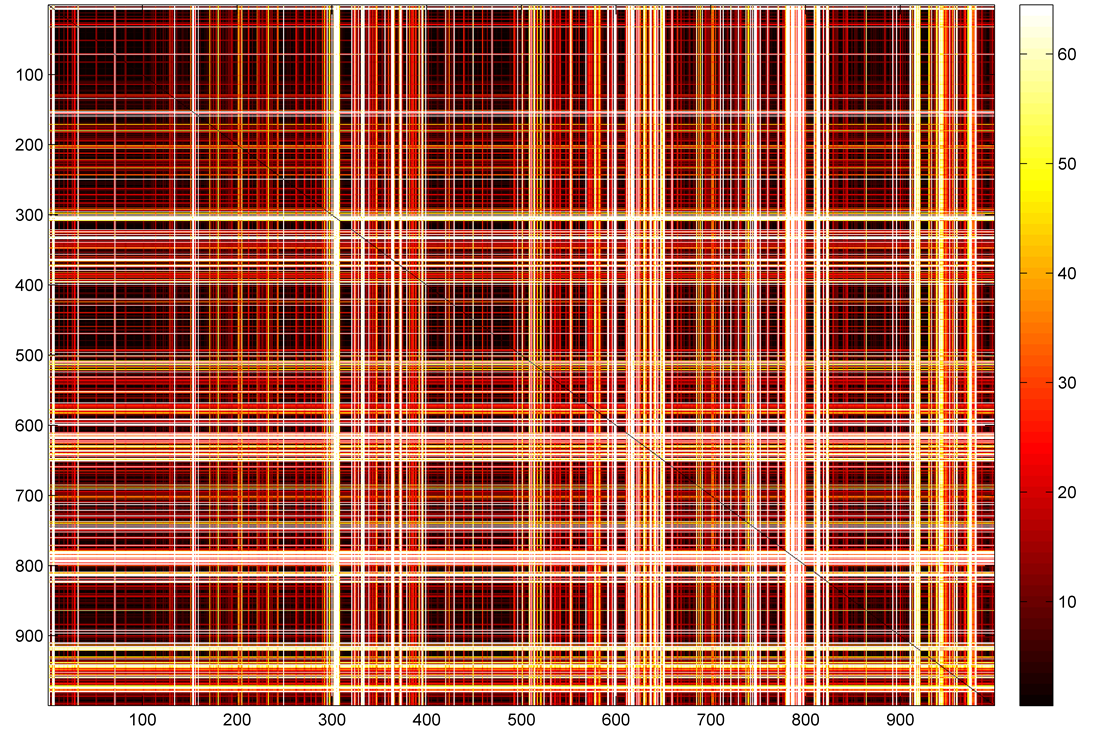
Where s, t stand for two dewey classes; and si and ti are their corresponding check-outs frequency in the i day of year (n=364). The visualization of dissimilarity matrix for all dewey classed are shown below: The more bright color of cell represents the large r dissimilarity between dewey classes regarding their temporal signatures.
The MDS coordinate results can be downloaded at:
MDS_coordinates.csv
Procedure 2: Designing and implementing the spiral galaxy and the spiral comets/stars to represent the dewey classes in the information universe.
The time series graphs of check-outs patterns for all dewey classes are shown as follows: (It indicates that the magnitude of check-outs frequency of several dewey classes such as Class 0 is too large, it might to be considered as a outlier.)
Where s, t stand for two dewey classes; and si and ti are their corresponding check-outs frequency in the i day of year (n=364). The visualization of dissimilarity matrix for all dewey classed are shown below: The more bright color of cell represents the large r dissimilarity between dewey classes regarding their temporal signatures.
The MDS coordinate results can be downloaded at:
MDS_coordinates.csv
Procedure 2: Designing and implementing the spiral galaxy and the spiral comets/stars to represent the dewey classes in the information universe.
Then, it adds one dewey class of 3D spiral “comet” into the library “information universe”, which it is actually an integration of Space and Time in the data visualization.
Adding more spatio-temporal 3D spirals to present more dewey classes.
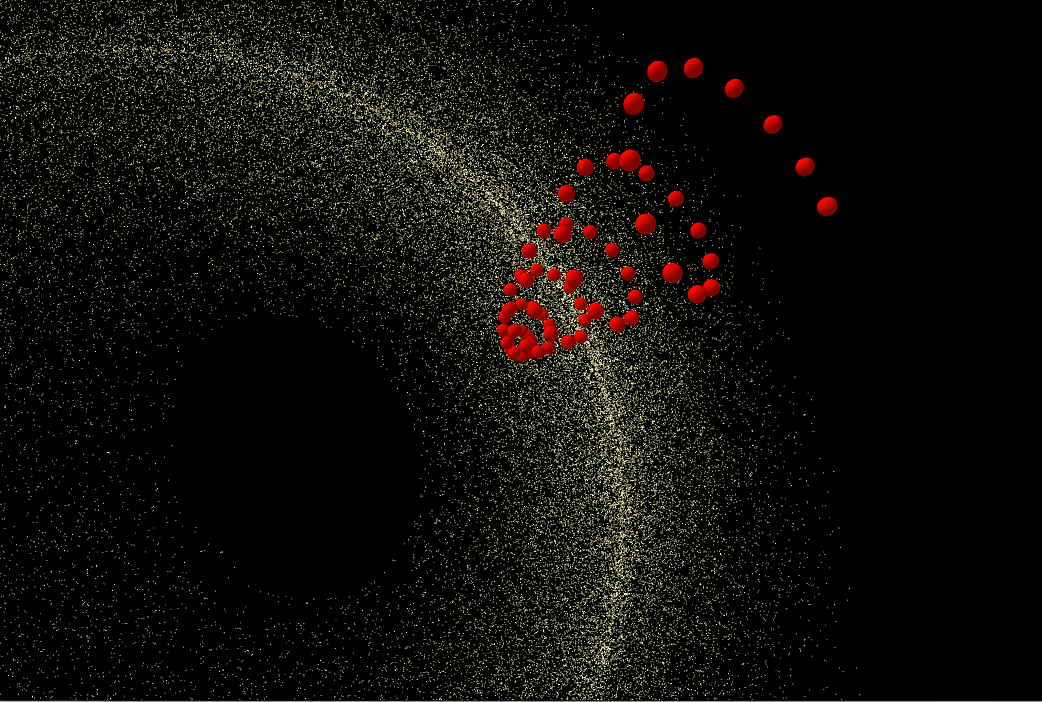
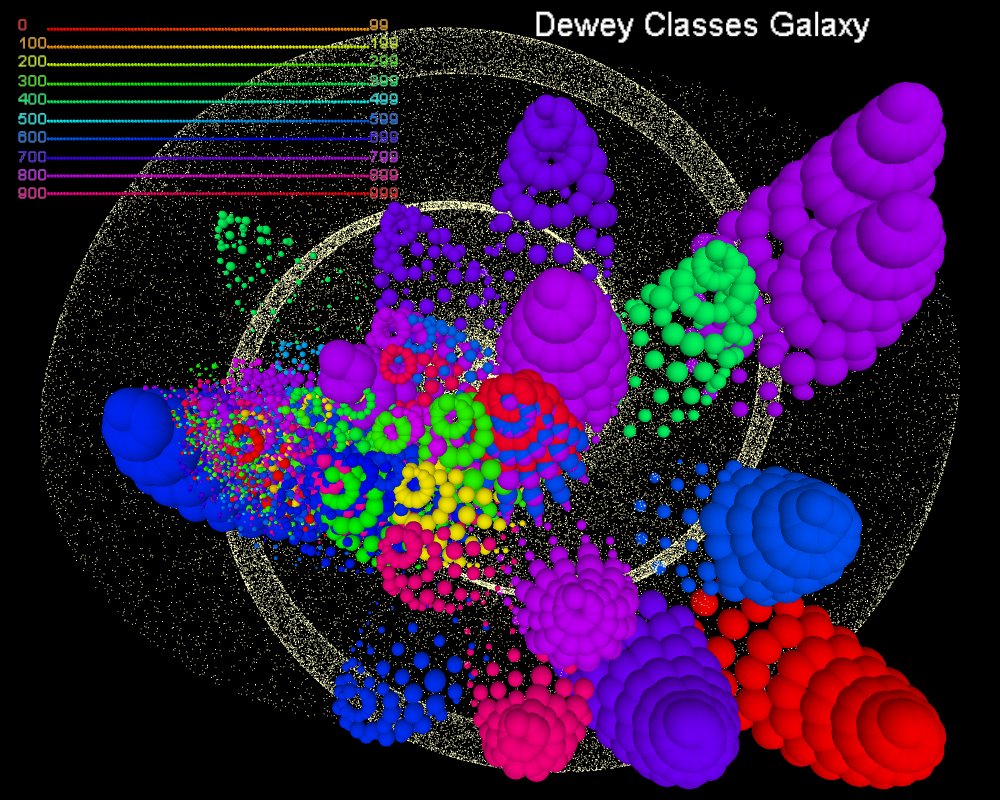
The MDS clustering layout of all dewey class spirals. The spatial closeness among the spirals indicates the similarity of these dewey classes based on their temporal check-out patterns. Note that because of the machine memory limits, it shows most of dewey classes as 3D globes whose temporal check-out probabilities are larger than a threshold value (e.g. 0.066 in the current visualization product) and one can change setting parameter in the Processing code. Other dewey classes whose temporal check-out probabilities are smaller than the threshold value, they are analogous to the sparkling star points in the galaxy.
The color bar legend shows the Hue value for each dewey class and the color hue scale has been change into 0~1000 in order to fit to all dewey classes.
Interaction Controls
In the PeasyCam 3D environment, a mouse left-drag will rotate the camera around the subject, a right drag will zoom in and out, and a middle-drag will pan the camera for interactive exploration. In addition, one can evoke some actions through keyboard:
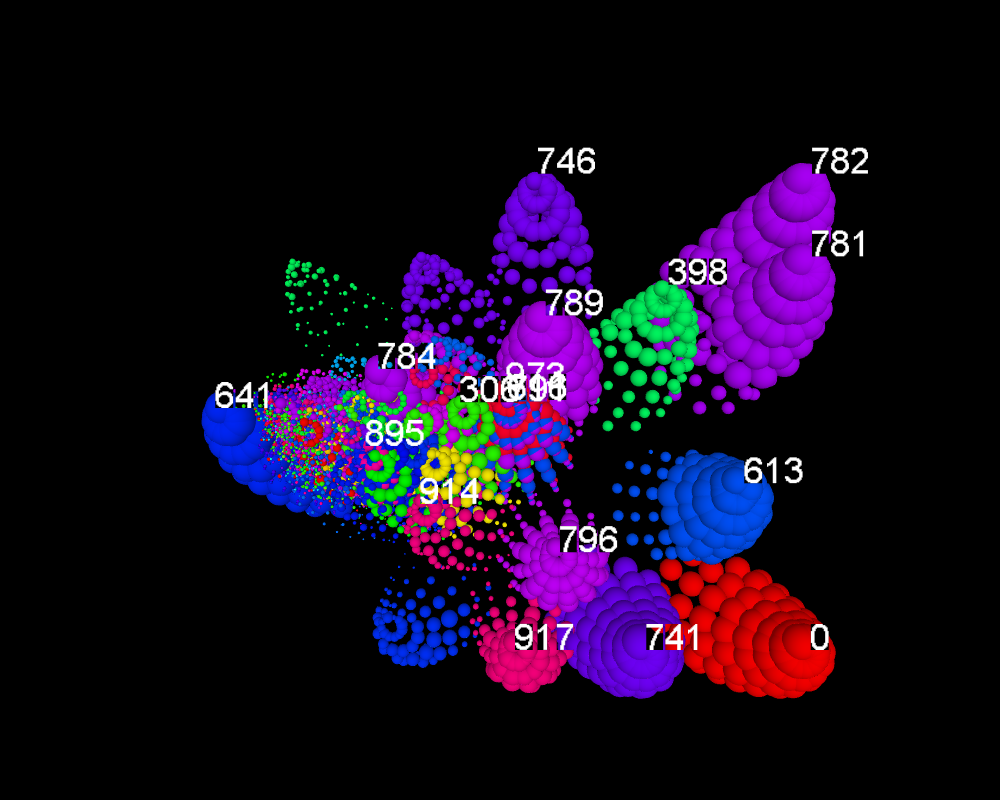
Keycode 'T': turn on or off the Dewey Class Labels. The font size of textual label for each dewew class indicates its relative monthly check-outs probability. The larger the font size is, the higher the probability is.
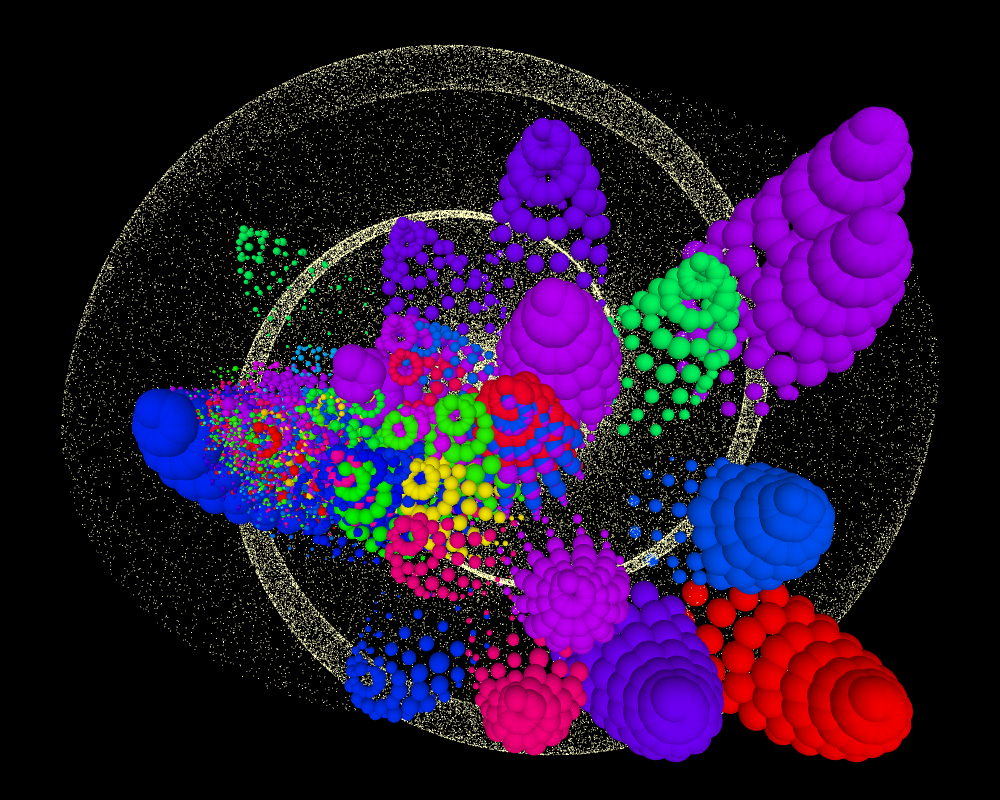
Keycode 'S': turn on or off the sparkling stars.
Keycode 'L': turn on or off the color legend.
Keycode 'T': turn on or off the Dewey Class Labels. The font size of textual label for each dewew class indicates its relative monthly check-outs probability. The larger the font size is, the higher the probability is.
Keycode 'S': turn on or off the sparkling stars.
Keycode 'L': turn on or off the color legend.
Results and Analysis
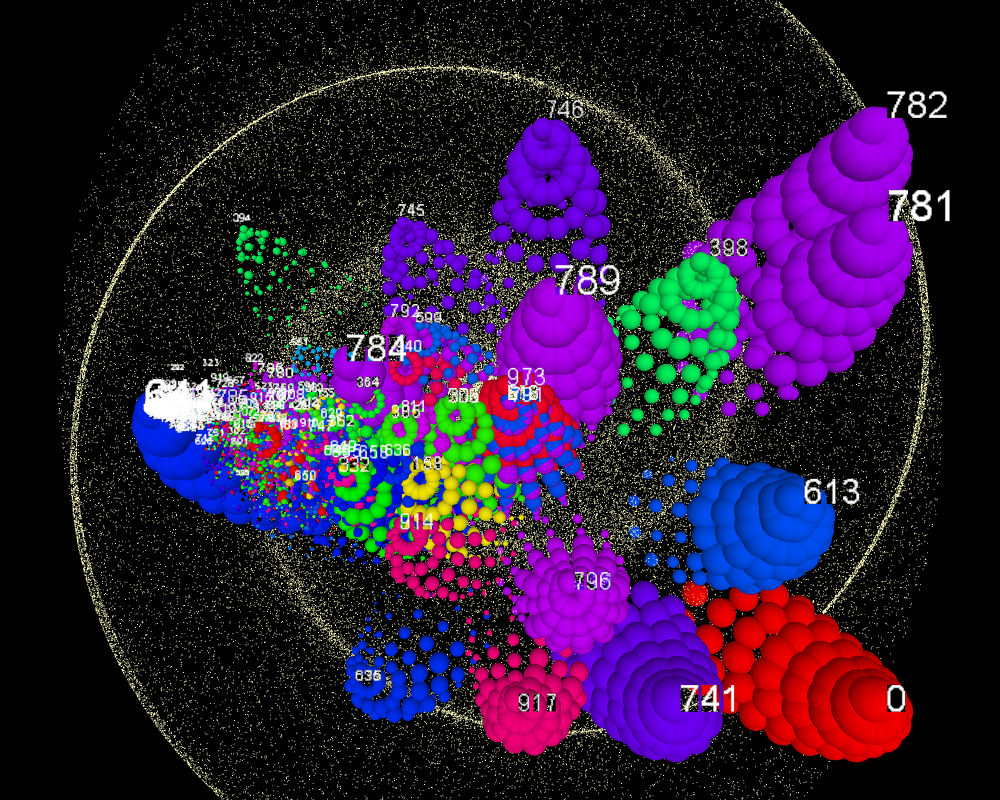
The final visual product offer insights on the integration of multidimensional scaling (MDS) approach with temporal check-outs patterns for visualizing dewey classes clusters and the capability to detect outliers. In general, the closer spirals have more similar temporal check-outs patterns. But the clusters which are far away from the main "galaxy" of dewey classes indicate very different patterns.
For instance, the following dewey classes have very large number of average monthly check-outs but their similarities based on the temporal signatures are different. This is why they acted as "independent fixed stars (clusters)" in the Dewey Classes Universe.
#0: Computer science, knowledge & general works
#398: Folklore
#613: Personal health & safety
#641: Food & drink
#741: Drawing and drawings
#746: Textile arts
#781: General principles & musical forms and #782: Vocal musi
#789: Not assigned or no longer used
# 917 North America (Geography & travel)
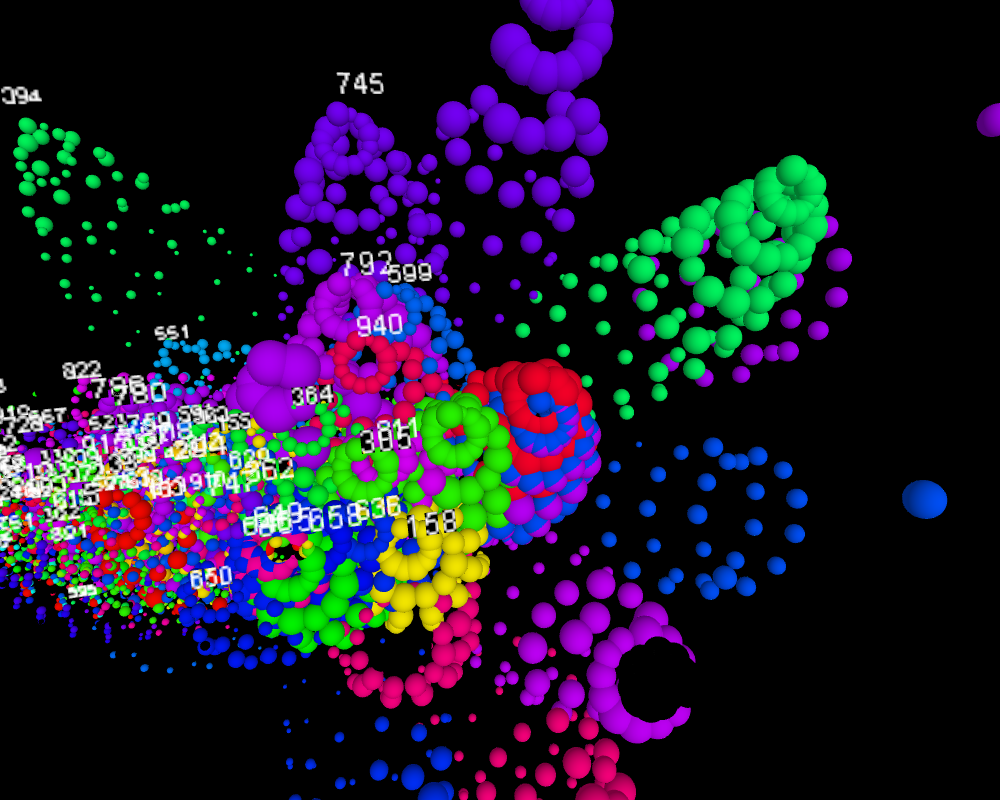
It is also interesting to find that the dewey class 789 (Not assigned or no longer used) tends to be similar to the dewey classes 973 (General history of North America; United States) and 611 (Human anatomy, cytology, histology) which have similar temporal check-outs patterns in Seattle public library. In addition, some dewey classes such as 394 General customs's temporal patterns are so different that they are also separated from the main “galaxy” and located as a "fixed star".
In addition, it is clear that the temporal check-outs of most dewey classes are decreasing (their sizes of globes are usually becoming smaller than older ones in early years).
Last but not least, the combination of coloring, lighting, scaling, labeling and clustering with Arts Design makes the visualization more tangible and attractive to human at first sight.
For instance, the following dewey classes have very large number of average monthly check-outs but their similarities based on the temporal signatures are different. This is why they acted as "independent fixed stars (clusters)" in the Dewey Classes Universe.
#0: Computer science, knowledge & general works
#398: Folklore
#613: Personal health & safety
#641: Food & drink
#741: Drawing and drawings
#746: Textile arts
#781: General principles & musical forms and #782: Vocal musi
#789: Not assigned or no longer used
# 917 North America (Geography & travel)
It is also interesting to find that the dewey class 789 (Not assigned or no longer used) tends to be similar to the dewey classes 973 (General history of North America; United States) and 611 (Human anatomy, cytology, histology) which have similar temporal check-outs patterns in Seattle public library. In addition, some dewey classes such as 394 General customs's temporal patterns are so different that they are also separated from the main “galaxy” and located as a "fixed star".
In addition, it is clear that the temporal check-outs of most dewey classes are decreasing (their sizes of globes are usually becoming smaller than older ones in early years).
Last but not least, the combination of coloring, lighting, scaling, labeling and clustering with Arts Design makes the visualization more tangible and attractive to human at first sight.
Code