3D Interactive Visualization
MAT 259, 2014
Rob Miller
Introduction
The Seattle Public Library has many distinct items that contain many physical copies. The need for having a large number of physical copies for an item is usually warranted by that item’s popularity and/or because that item is generally checked out for long periods of time. This project investigates whether the popular and length of loan period justify having large amounts of a single distinct item. To limit the scope of the visualization, I used only the following items—Books (Adult), Books (Juvenile), CDs (Adult), CDs (Juvenile), Musical Scores, Folders, and DVDs. Additionally, only items with between 50 and 100 physical copies are selected.
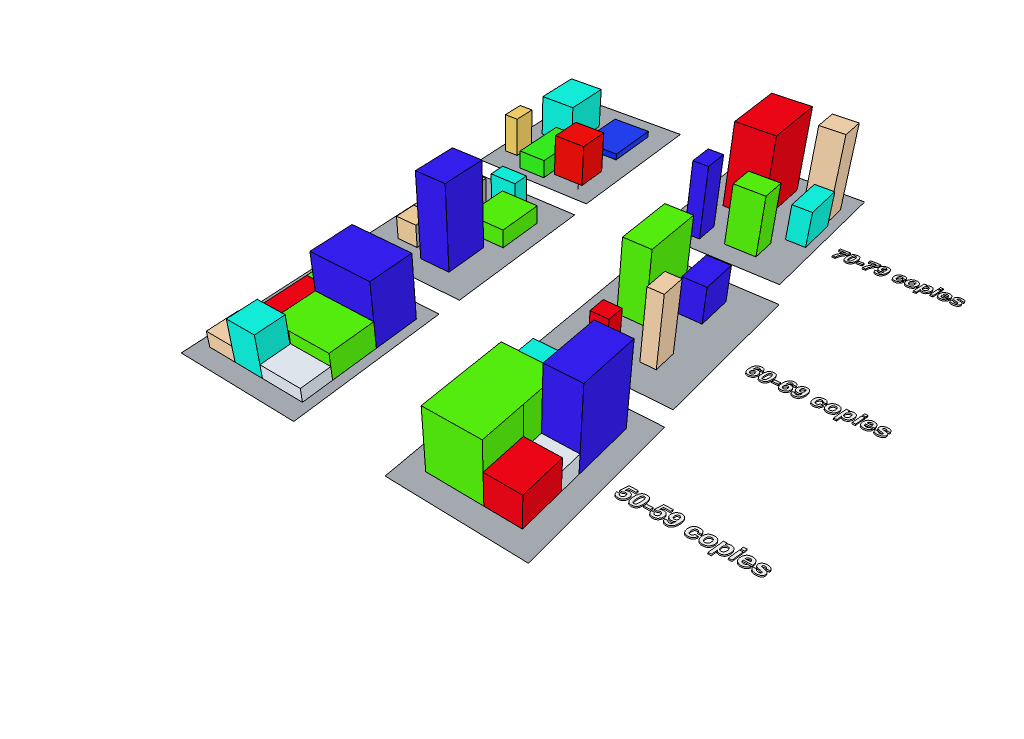
Sketch
The final visualization went through major changes from this original sketch in order to incorporate better design elements.
Query
The query is slightly modified to accommodate each item type, but the general query remains the same. The search involves inner joining three tables to get the duration of loan time and popularity for an item that has between 50 and 100 copies.
SELECT DISTINCT copies, kind, TIMESTAMPDIFF(HOUR,o,i)/24.0 AS duration, popularity FROM copies, itembib, kind, activity, popularity WHERE itembib.item=kind.item AND kind.item=activity.item AND activity.bib=popularity.bib AND copies.copies >= 50 AND copies.copies < 100 AND kind = 'acbk' LIMIT 20000;
SELECT DISTINCT copies, kind, TIMESTAMPDIFF(HOUR,o,i)/24.0 AS duration, popularity FROM copies, itembib, kind, activity, popularity WHERE itembib.item=kind.item AND kind.item=activity.item AND activity.bib=popularity.bib AND copies.copies >= 50 AND copies.copies < 100 AND kind = 'acbk' LIMIT 20000;
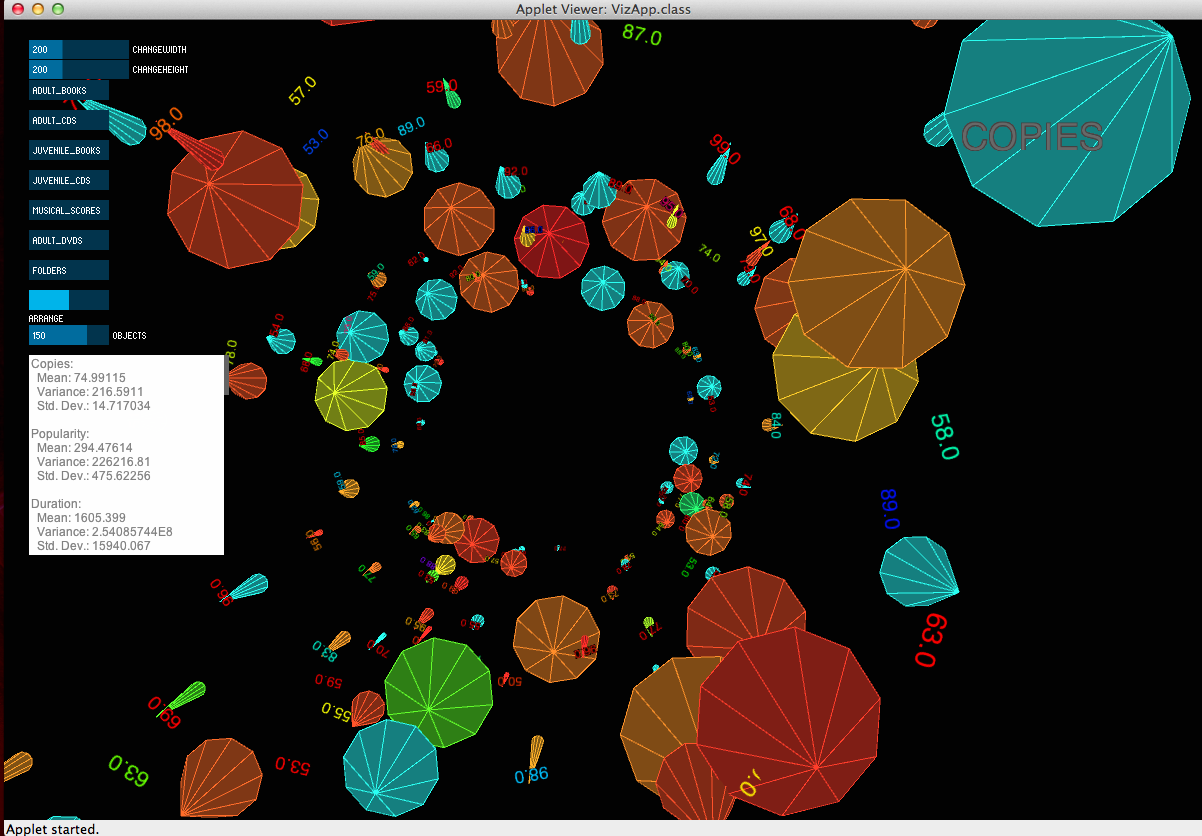
The Visualization
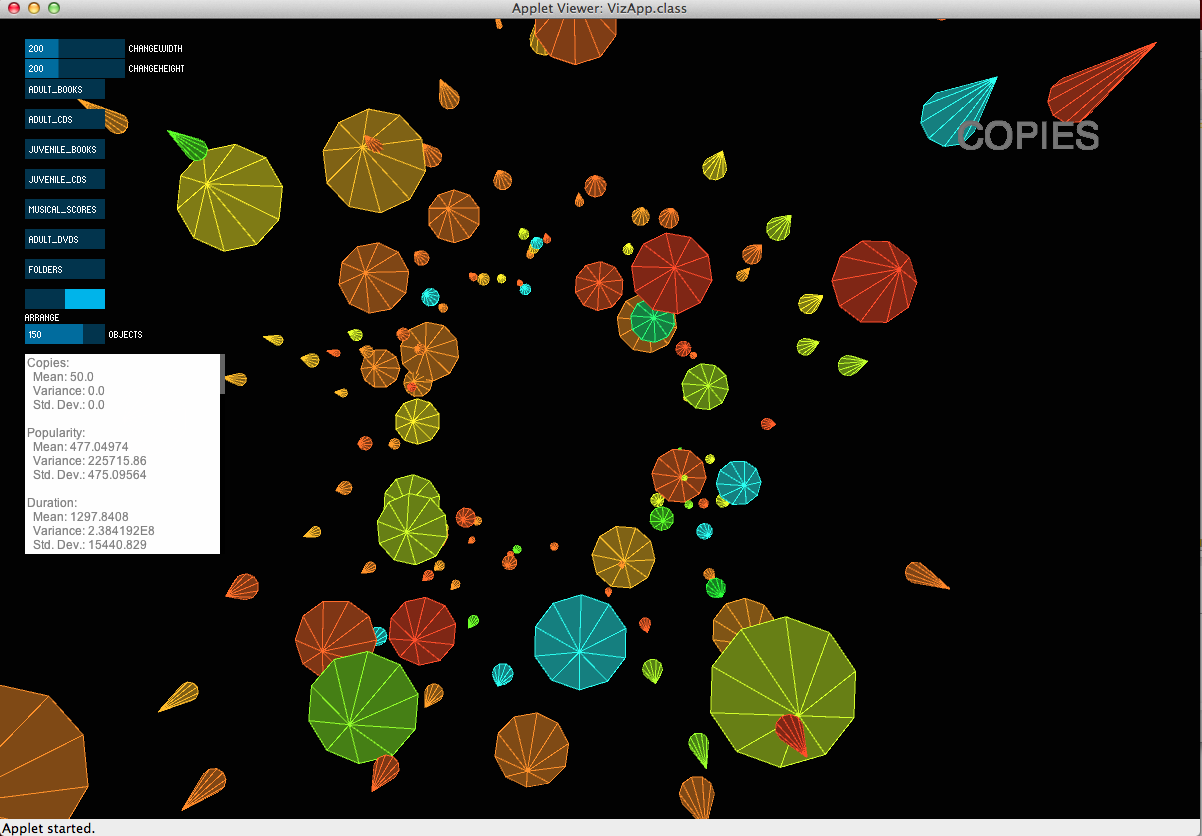
The visualization consists of cone shapes organize along an invisible spiral. Each cone represents an item from the query results. The base of each cone is determined by the item’s popularity, the height by the item’s number of physical copies, and the color (hue) determined by the item’s total duration of checkout time. A GUI allows the user to view the visualizations for different item types as well as a few basic statistics.
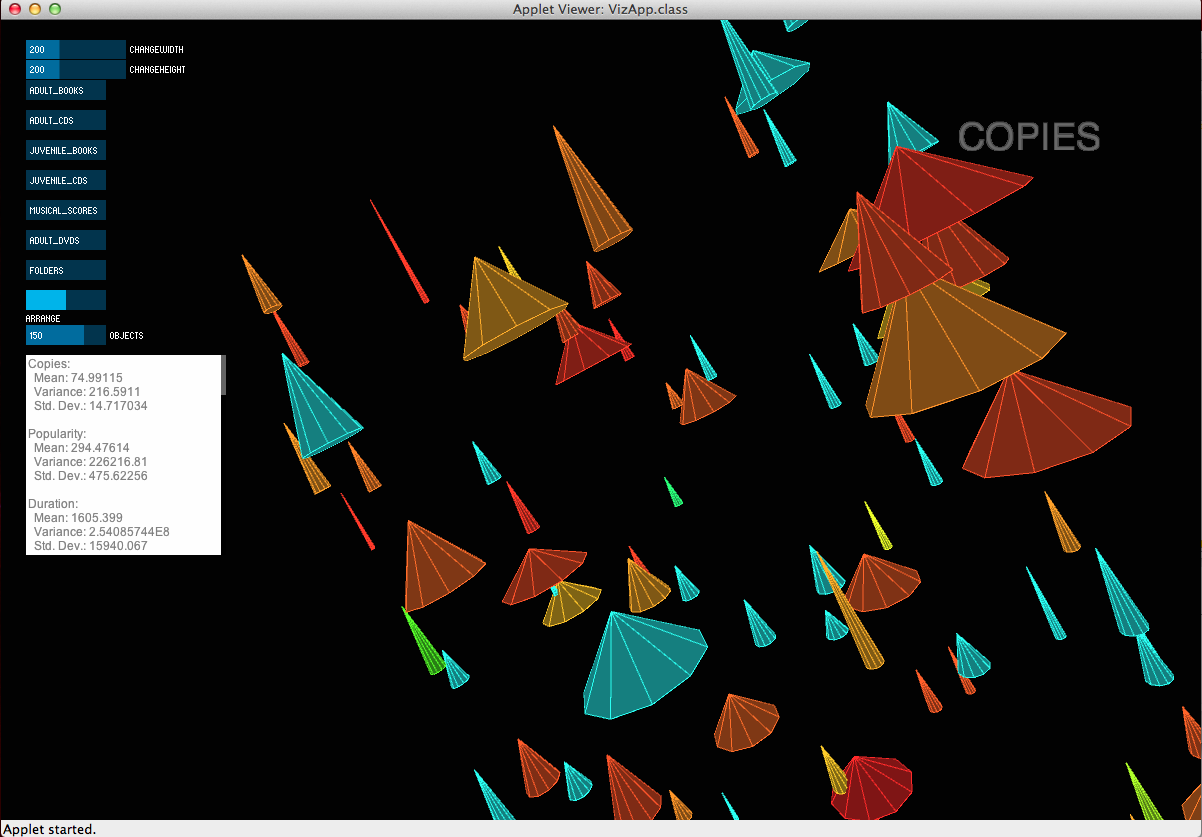
Interaction
The main interaction occurs within the GUI where the user can toggle different item types to display. Additionally, the mean, variance, and standard deviation are displayed for the amount of copies, duration, and popularity for each item. The user can also toggle the text on or off. There are predefined camera positions to aid the user in navigation that are accessed with keys 1,2, and 3. Within the GUI, the arrangement of the cones can changed from their default positions to a straight line arrangment. Lastly, the user can use the 'Objects' slider to choose the number of cones he or she wishes to draw--a feature that may improve the frame rate.
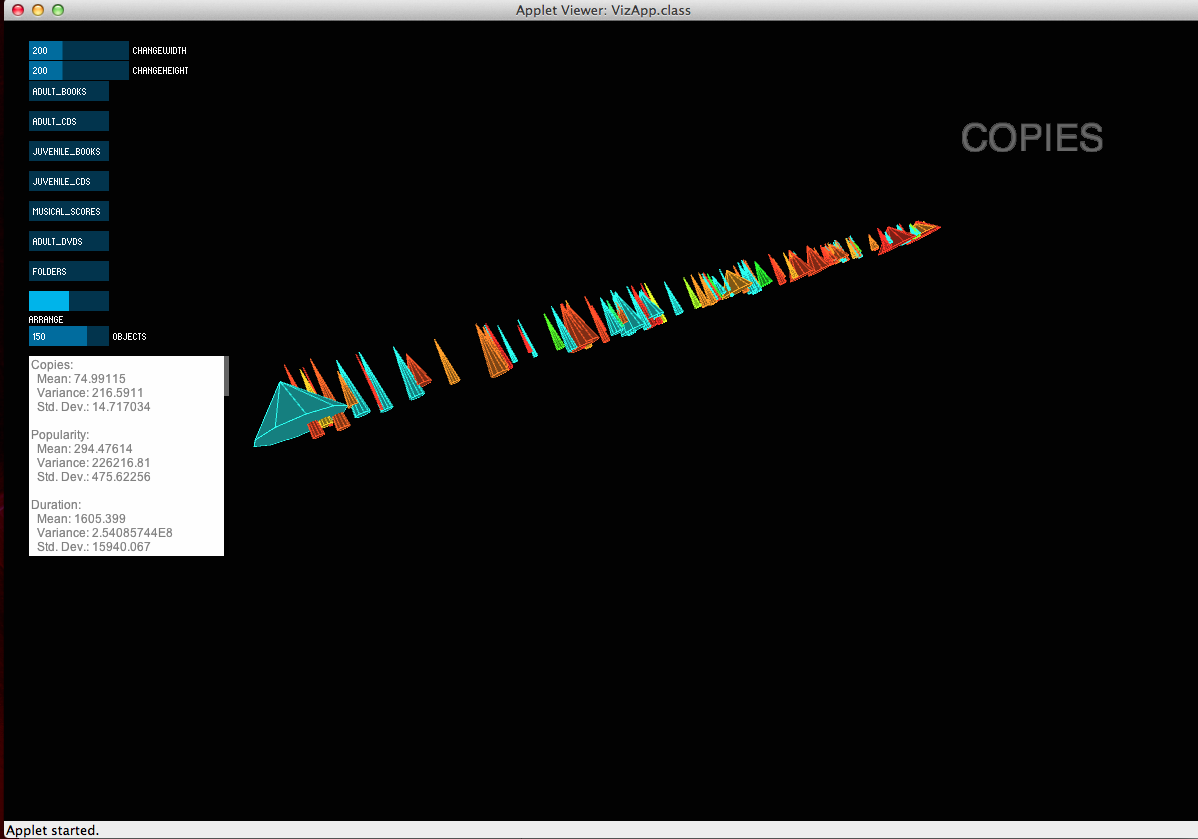
Results and Analysis
This visualization allows the user to quickly view whether or not the duration and popularity deserves to have a large number of copies. When the cone shapes have a large base, it signifies that that item is very popular, and a higher hue shows that an item has been checked out for a larger cumulative duration. The user can also view the number of copies in relation to this information. The arrangement of the cones are in an invisible, spiral-like shape and spaced according to their base sizes. This is a design decision to prevent clutter and overlap within the cones.
Code