From a research perspective, one of the most fascinating aspects of a dataset such as the Seattle Public Library check-outs is exploring the similarities between items. By similarity, I mean the ways in which two items in a set are similar or dissimilar. For example, do the authors of two books use similar language? Is the subject matter similar? Do the topics or themes discussed in the books flow along the same lines? Given this concept of topic or theme similarity, I've always thought it would be very interesting to visualize data points (books in this case) in thematic space. In this case the placement of an item in a three-dimensional space would be based on its similarity to other items in the same set. For example, two children books on the topic of dogs would be placed very closely together in space, while a book on Cold War politics would be placed much farther away.
One statistical method for approaching this idea is Multi-Dimensional Scaling (MDS). MDS takes a series of attributes for each item in a dataset and uses these attributes to compute a location in N-dimensional space. Items that are more similar are clustered together while those dissimilar are placed further apart. The number of dimensions "N” is up to the user to determine and in this case I initially chose to represent the data in three dimensions and later, in two dimensions.
The basis for MDS will be a series of attributes related to each item. These attributes will be based on descriptive data pertaining to each item. Given textual descriptions of each book, for example, a latent Dirichlet allocation (LDA) model can be run resulting in a finite set of topics. LDA is an unsupervised, generative topic model that approaches text as a bag-of-words. The co-occurrence of words in a specific document and across documents produces a set of topics from which each original book, in this case) can be defined. In essence, each book will be given a unique distribution of topic probabilities. This distribution of topics can then be compared to each other distribution of topics (through a Euclidean distance measure for example) and a resulting matrix of similarity values is produced.The first step in collecting data for this project was to determine the number and type of items that should be explored. Given the vast amount of data it was sensible to reduce the study dataset. For this project I initially chose to take the top 5,000 most check-out books from the Seattle Public Library. Later, these 5,000 books were restricted to the top 500 books in the category of "Juvenile Fiction." The query to access the initial 5,000 titles , bibNumbers and check-out counts for these books is listed below.
After exporting these results in CSV format, the next step was to ascertain more descriptive content about the specific books. In order to do this I chose to explore the Google Books API. Limited to 1,000 requests a day, the title of each book was queried against the Google Books Database and metadata about each book is returned. The following information can be accessed and downloaded:
- Direct Google Books Item link
- Title
- Authors
- Publisher
- Published Date
- Description
- ISBN
- Page Count
- Categories
- Thumbnail URI
- Language
- Text Snippet
Initial attempts at loading the 5,000 records proved to be far to process-intensive. Additionally, the results of the MDS placed many books within close proximity or directly on top of one another which significantly reduced the readability of the visualization. For these reasons the sampled set of 5,000 books was reduced to a set of 500 specifically of Google category type “Juvenile Fiction.” Examples of books in this genre range from Dr. Seuss to the Hunger Games.
Given the metadata available for each book (as listed above), a script was written to download the thumbnail image for each of the 500 books in the set. These thumbnails would prove to be both visually appealing as well as a source for identifying each book.FROM spl2.outraw
WHERE substring(itemtype,3,2) == 'bk'
GROUP BY bibNumber, title
ORDER BY ct DESC
LIMIT 5000;
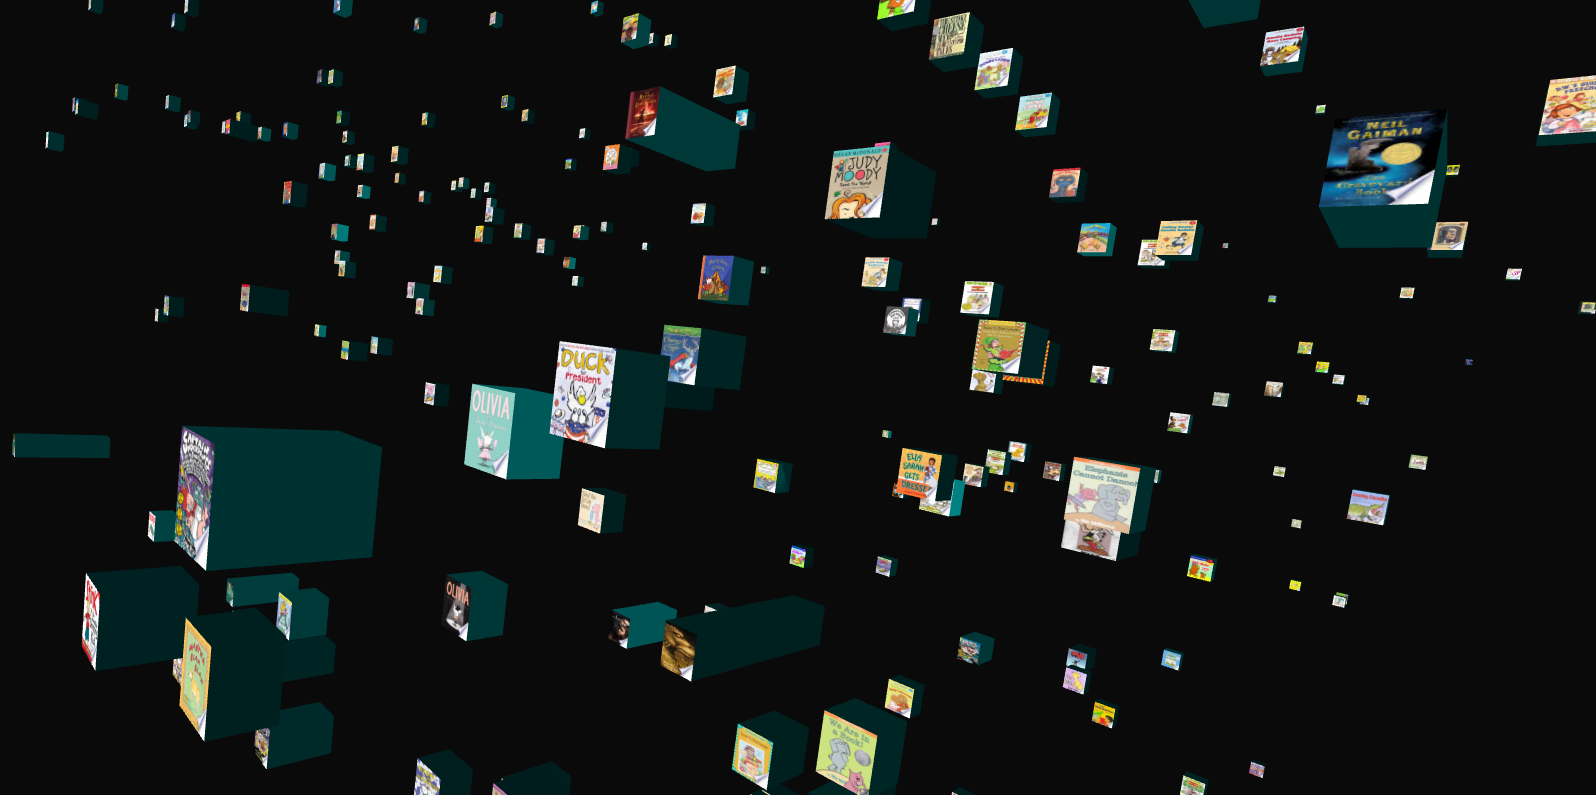
The initial results of the MDS based on LDA proved quite interesting. The first MDS method produced points in 3-dimensions that could be used in PeasyCam. While this did look very interesting (Figure 2), I felt the two dimensions would be sufficient for the MDS, leaving a third dimension that could be used for portraying other information about each book. I did spend quite a bit of time exploring the MDS results to ensure that the topic modeling and similarity metrics produced results that were reasonable. As an example, I found many written by the same author (e.g., Dr. Seuss, Suzanne Collins) clustered together as well as specific genre books (e.g., Eragon and the Hobbit).
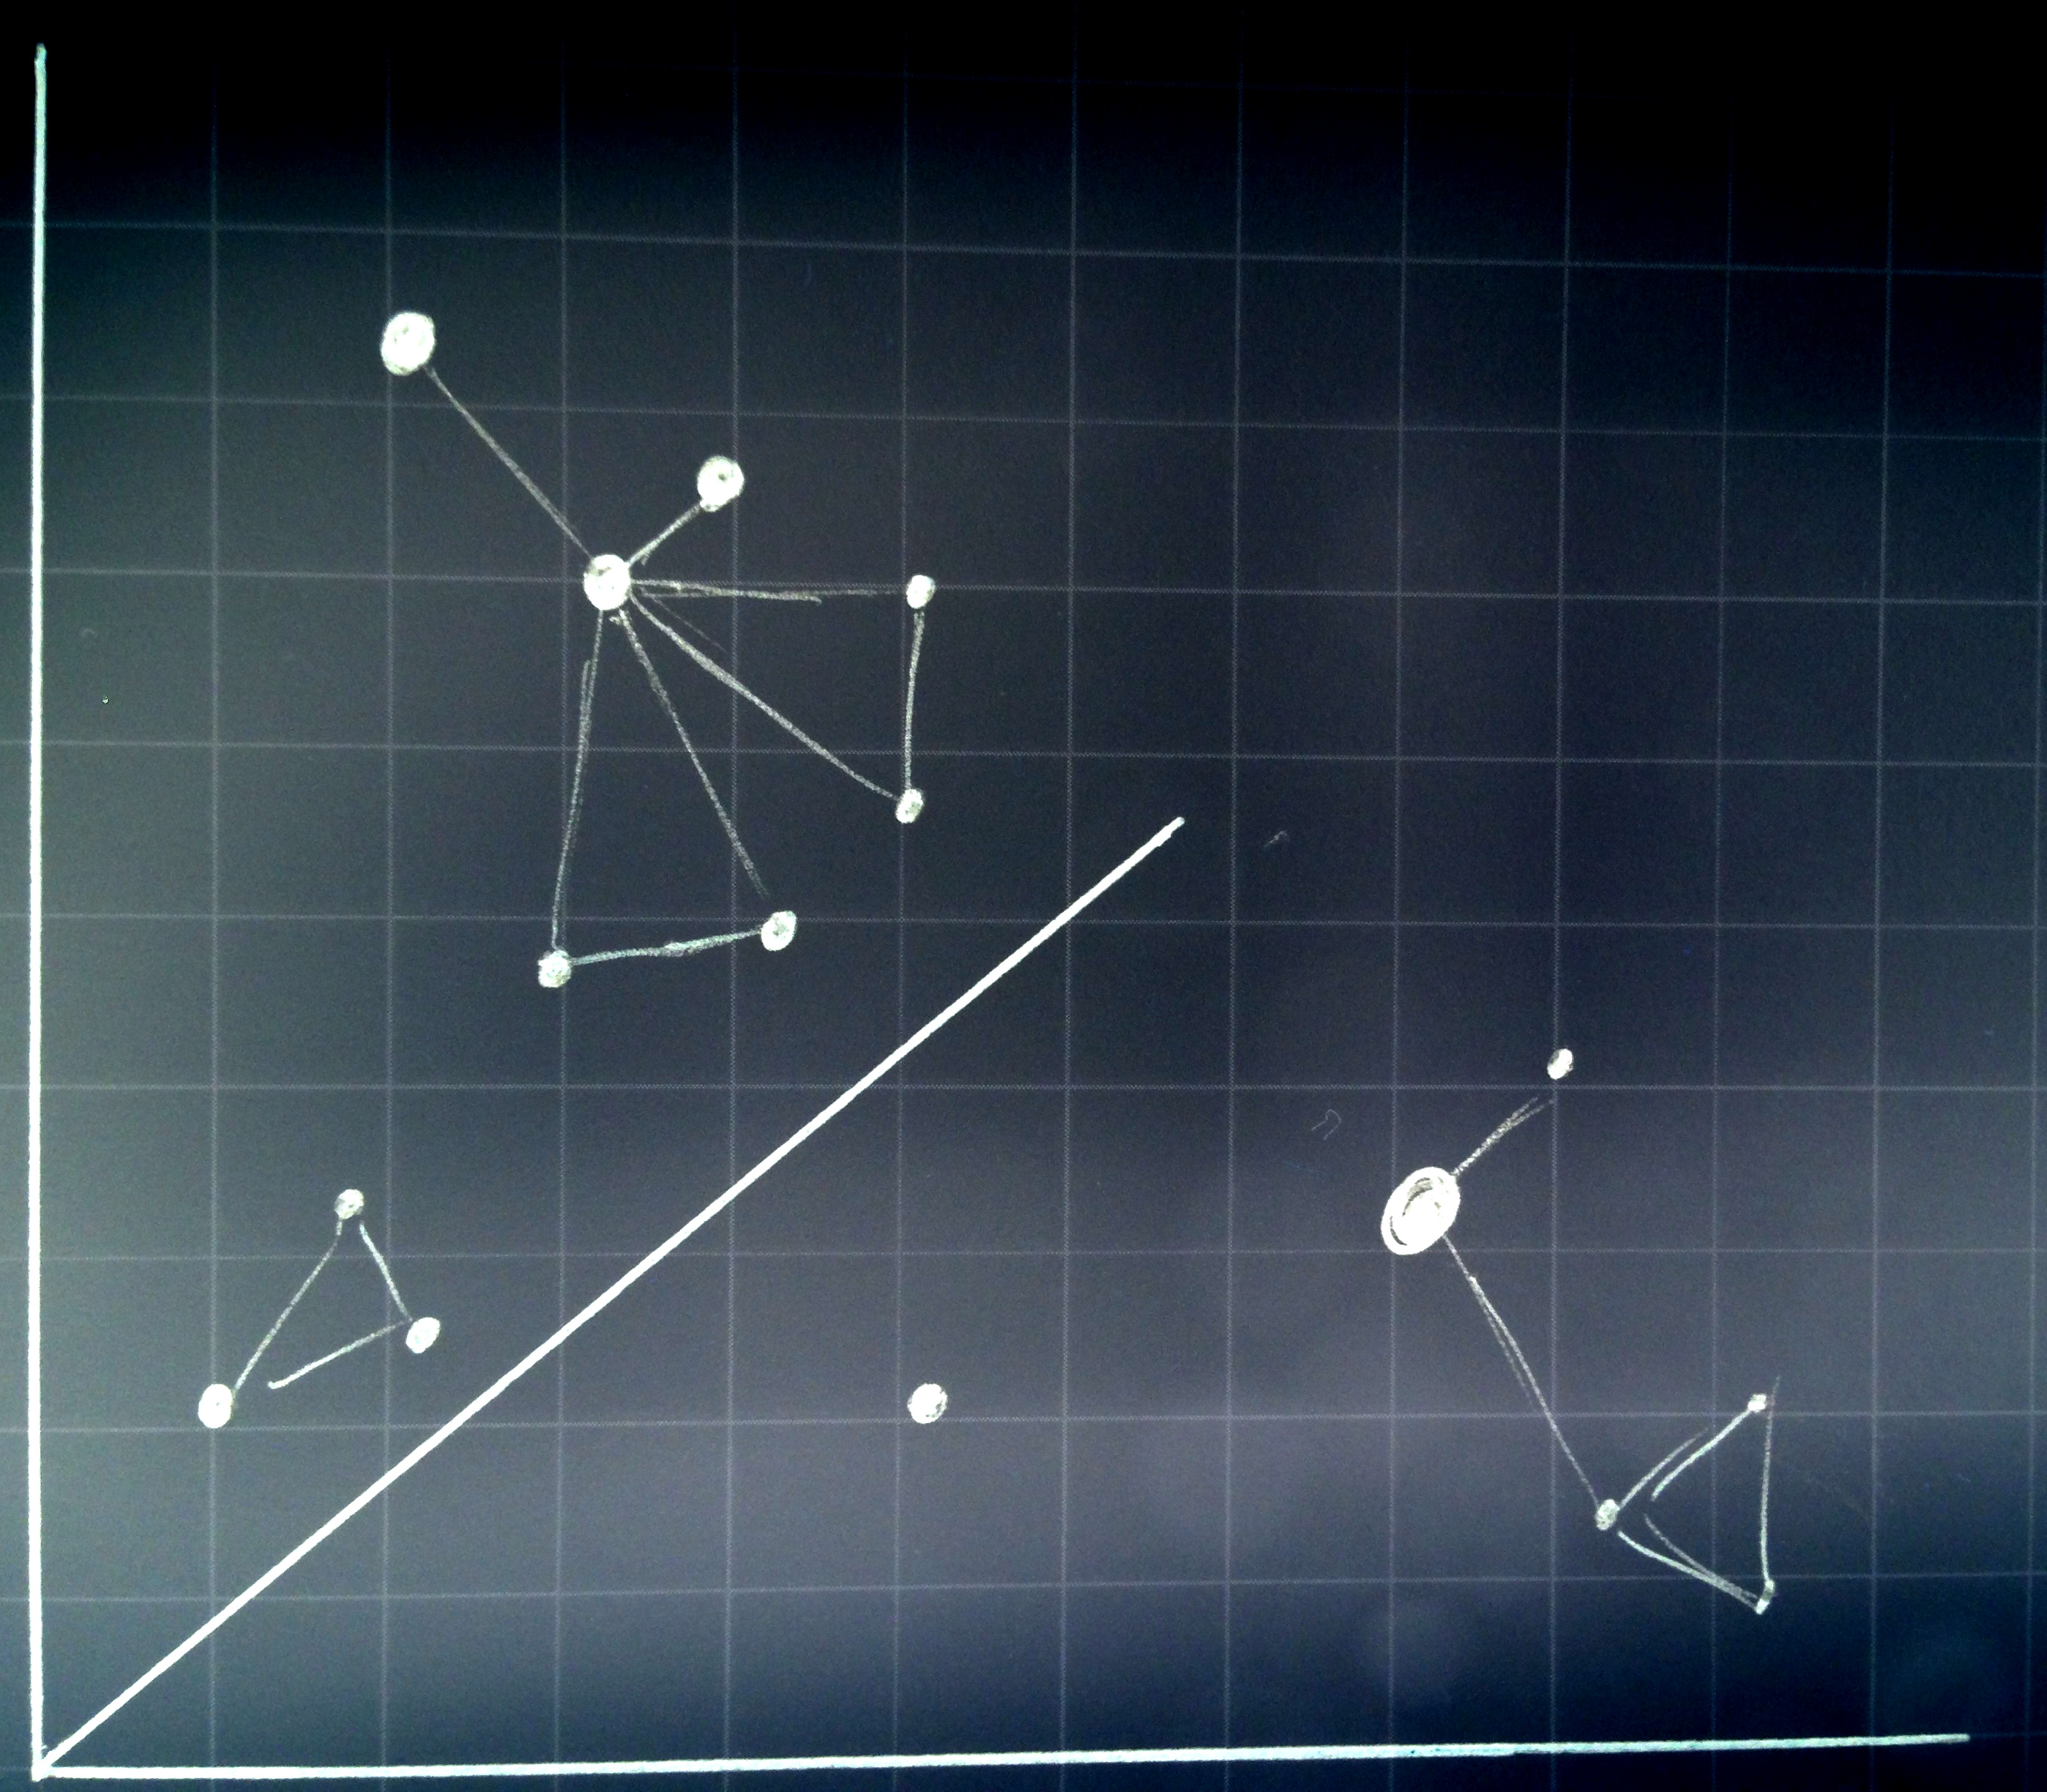
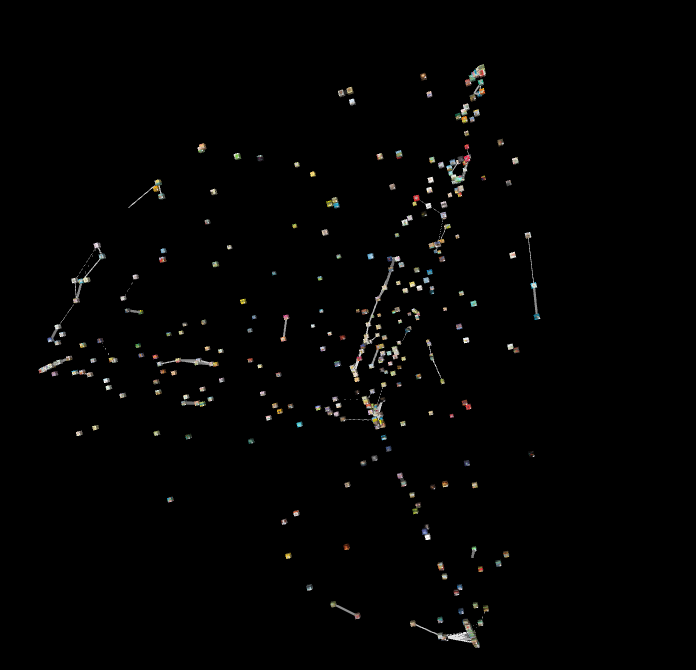
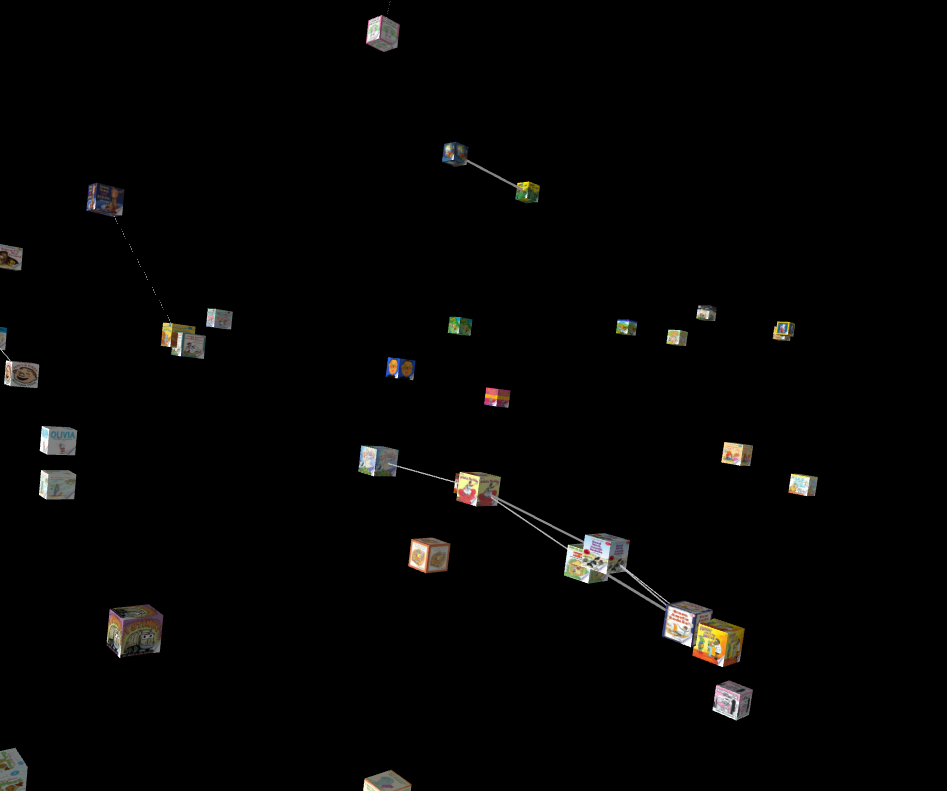
The next step was to add lines to the top 10% most similar books (Figure 3). While again, this was quite informative (from an analytic perspective), I felt that it really detracted from the overall visualization and so was removed in the final product.
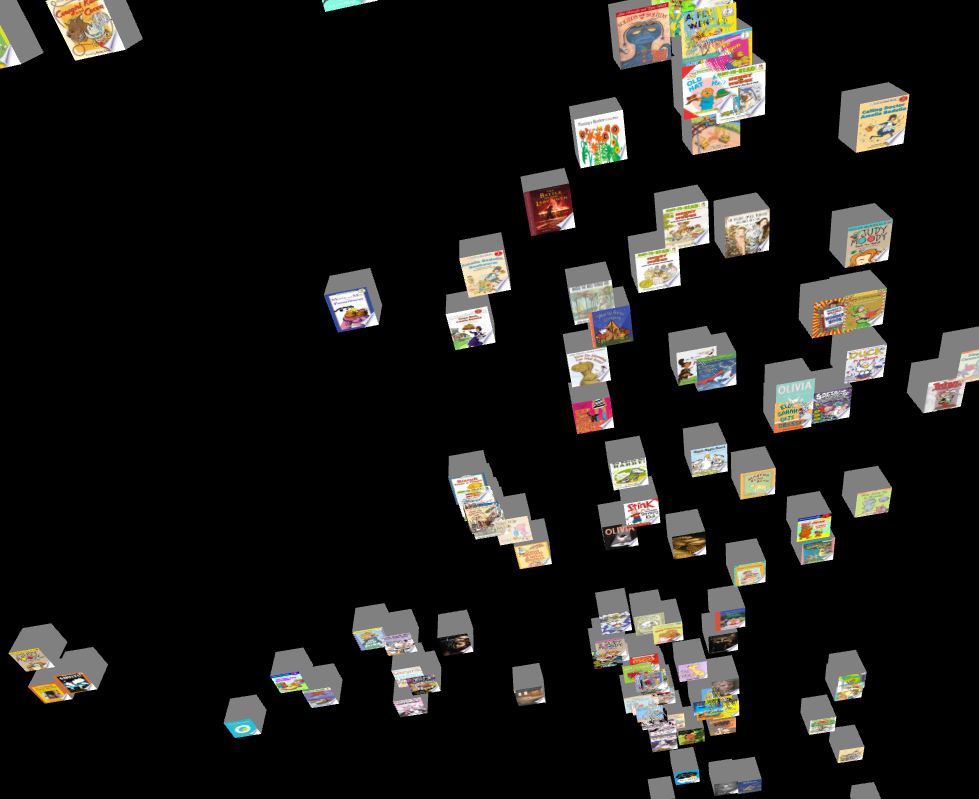
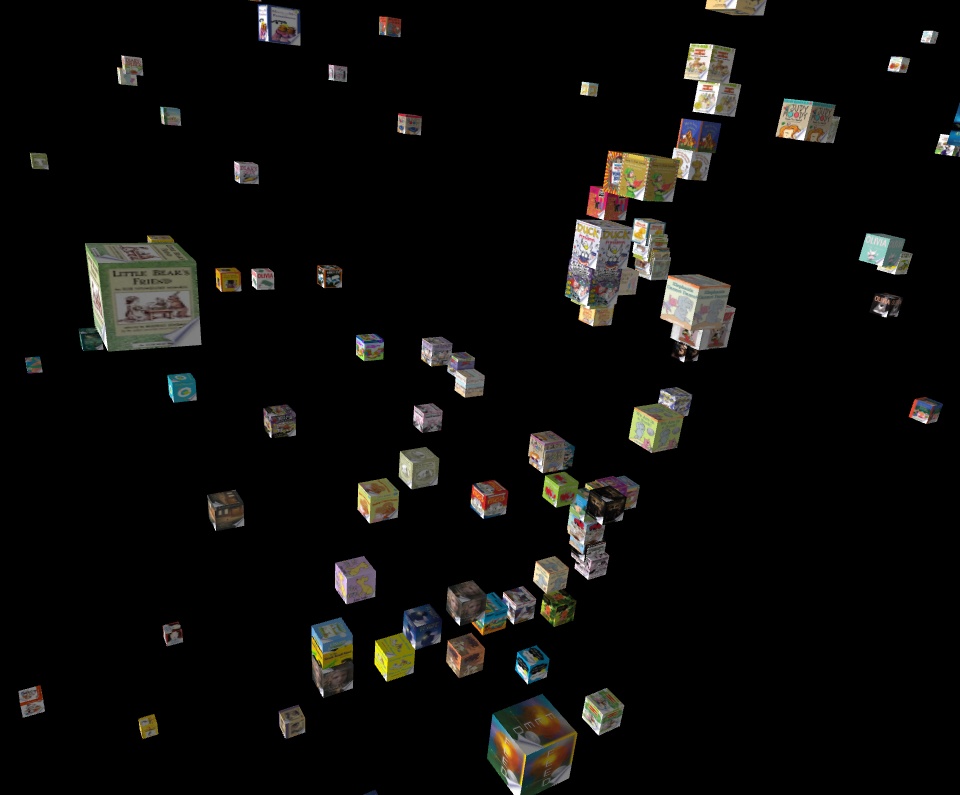
Initially, I tried visually representing the number of check-outs of each book by the size of the cube (Figure 4). This lead to scaling issues as well as overlapping of many books and so was abandoned.
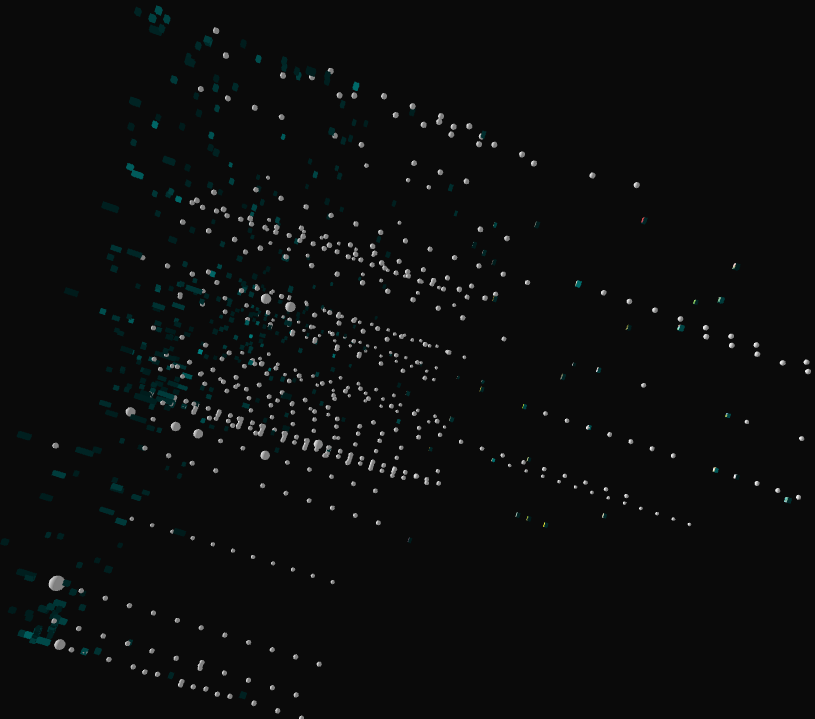
The check-out count instead was represented by the saturation of the color green assigned to the sides of all book entities (Figure 5a). Additionally, white spheres were added as tails behind each book/cube representing the relative number of check-outs for each book in each month of 2013 (Figure 5b).

Lastly, the length of the (now) hyperrectangle was determined by the number of pages in each book and the placement of the book entity on the Z-axis (remember that MDS similarity makes use of the first two dimensions) is based on the year the book was published (from most recent to oldest).