Data Correlation
MAT 259, 2014
Rob Miller
Introduction
This is an exploration of features of a song that may contribute to its popularity in Seattle. I will use the Echo Nest's API to query the "hottest," that is more popular, songs contemporaneously. The Echo Nest has a database of over 35.3 million songs, and along with those songs, certain features about the song such as tonality, tempo, and valence. After getting the most popular songs from the Echo Nest, I will query the Seattle Public Library (SPL) for the number of checkouts for albums containing those songs. The visualization will compare the popularity of an album in SPL to the features computed by Echo Nest.
Sketch

Query
Echo Nest (requires your own API key)
http://developer.echonest.com/api/v4/song/ search?api_key=YOUR_API_KEY&sort=song_hotttnesss-desc &bucket=song_hotttnesss &bucket=song_currency &bucket=audio_summary &results=20
Seattle Public Library
SELECT title, itemtype, count(*) FROM inraw WHERE cout > '2013-10-01' AND itemtype = "accd" AND title LIKE "all the little lights" OR title LIKE "halcyon" OR title LIKE "prism%" OR title LIKE "%bangerz%" OR title LIKE "%eyonc%" OR title LIKE "%marshall mathers lp 2%" OR title LIKE "%international takeover%" OR title = "native" GROUP BY title ORDER BY title;
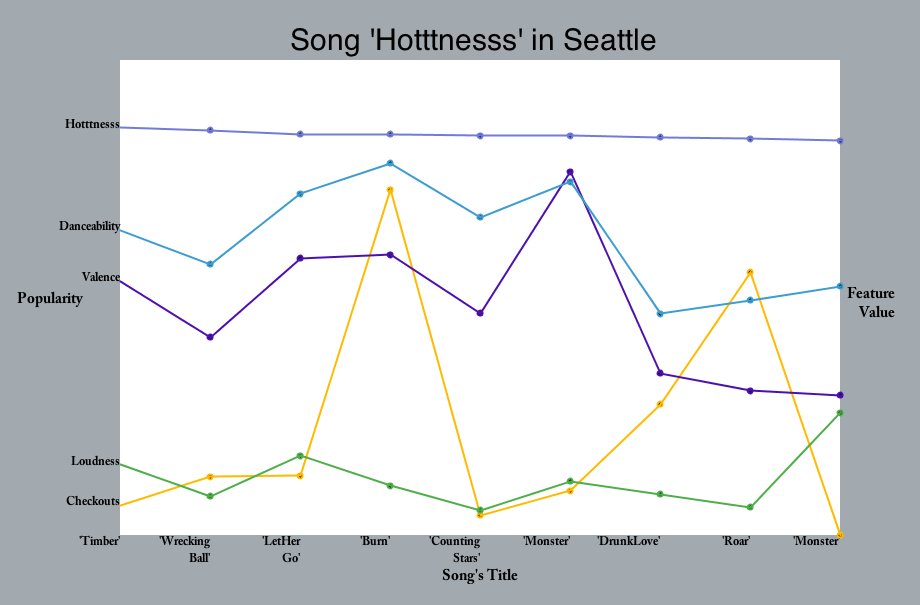
Results and Analysis
The plot of the data gives more insight as to what characteristics may lead to a song becoming more popular within Seattle. From the small dataset, it becomes clear that Seattleites have a preference for loud music with a clear, danceable rhythm. On the other hand, Seattleites prefer music that does not heavily suggest a particular emotion. Songs with a valence value in the midrange of the spectrum seem to have more popularity. It would be interesting to see how the information gleaned from this plot scales to many more songs as well as more locations.
Code