Visualizing Ukraine
MAT 259, 2014
Mudit Uppal
Introduction
Concept- Visualizing and correlating events in Ukraine. What really describes the the chaos happenings in Ukraine. The three data sets used here are New york times and Twitter and SPL.
Further comparison from Twitter and NY times api is done with seattle public library database.
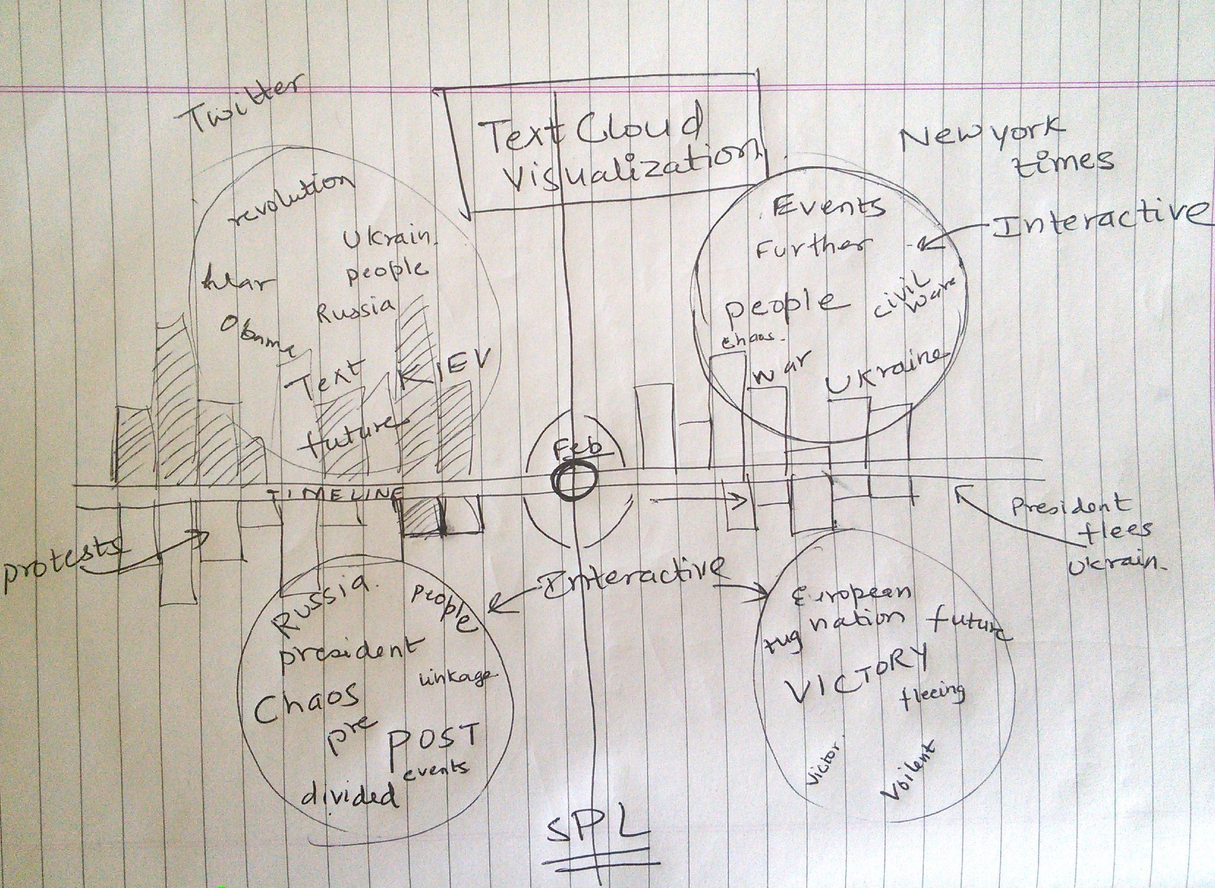
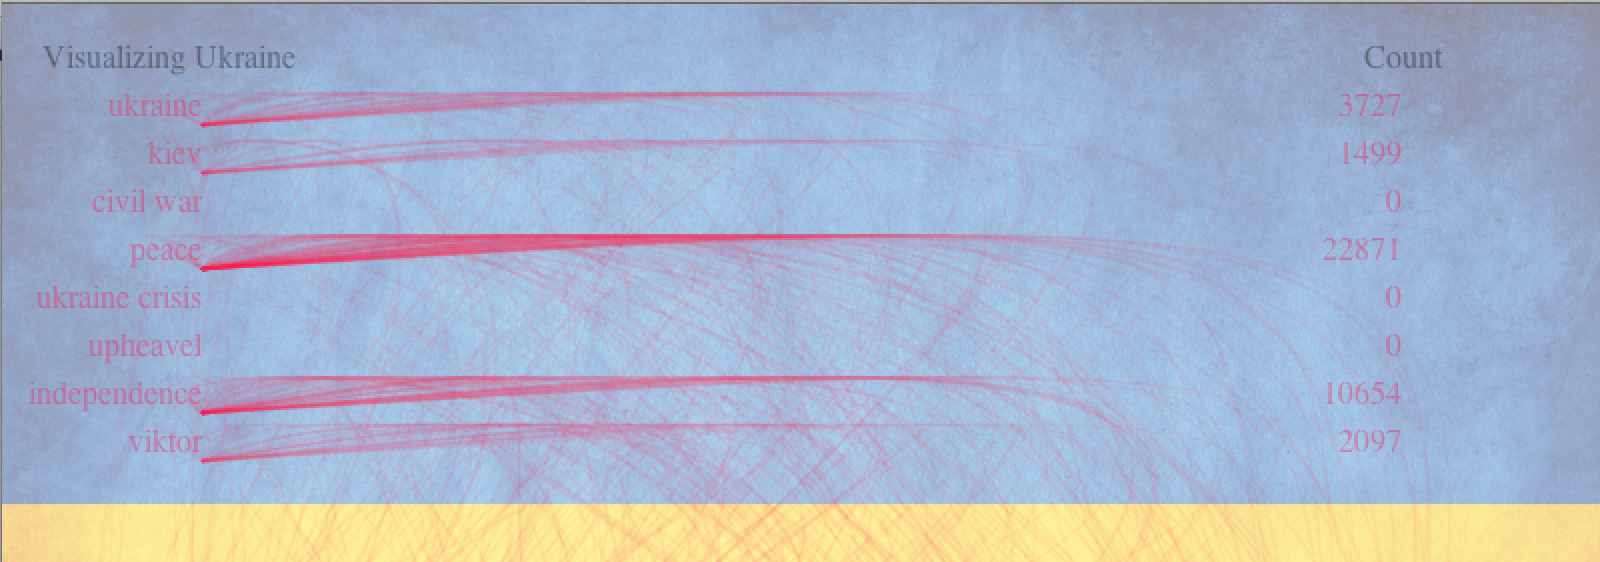
One of the basic reasons for doing this information visualization is to provide a perspective on the underlying data related to the current ‘war’ in ukraine, its context, and interactively allow or engage a user in exploring various aspects of the data. Hence, the idea is to create a text-cloud.
The idea is to depict pre- and post- president, Viktor F. Yanukovyc, fleeing Ukraine and giving power back to the people.
Ukraine is a divided country caught in an increasingly violent tug of war between its past and future. Its heading for a civil war and considered a ‘revolution’. Ukraine have been in the news since the orange revolution back in 2004. Yet, though the Orange Revolution demonstrated that Ukrainians could reverse a stolen election by taking to the streets, a crucial precedent in a post-Soviet country, the victory did nothing to resolve Ukraine’s larger economic problems, and in 2010, Yanukovych won a legitimate victory as voters rushed toward a candidate who promised a more stable path forward. Read more..
Keyword searching included: war, ukraine, civil war, protest, Kiev, Russia, linkage, EU
Background and Sketches
(1) Previous doodle for 2D visualization
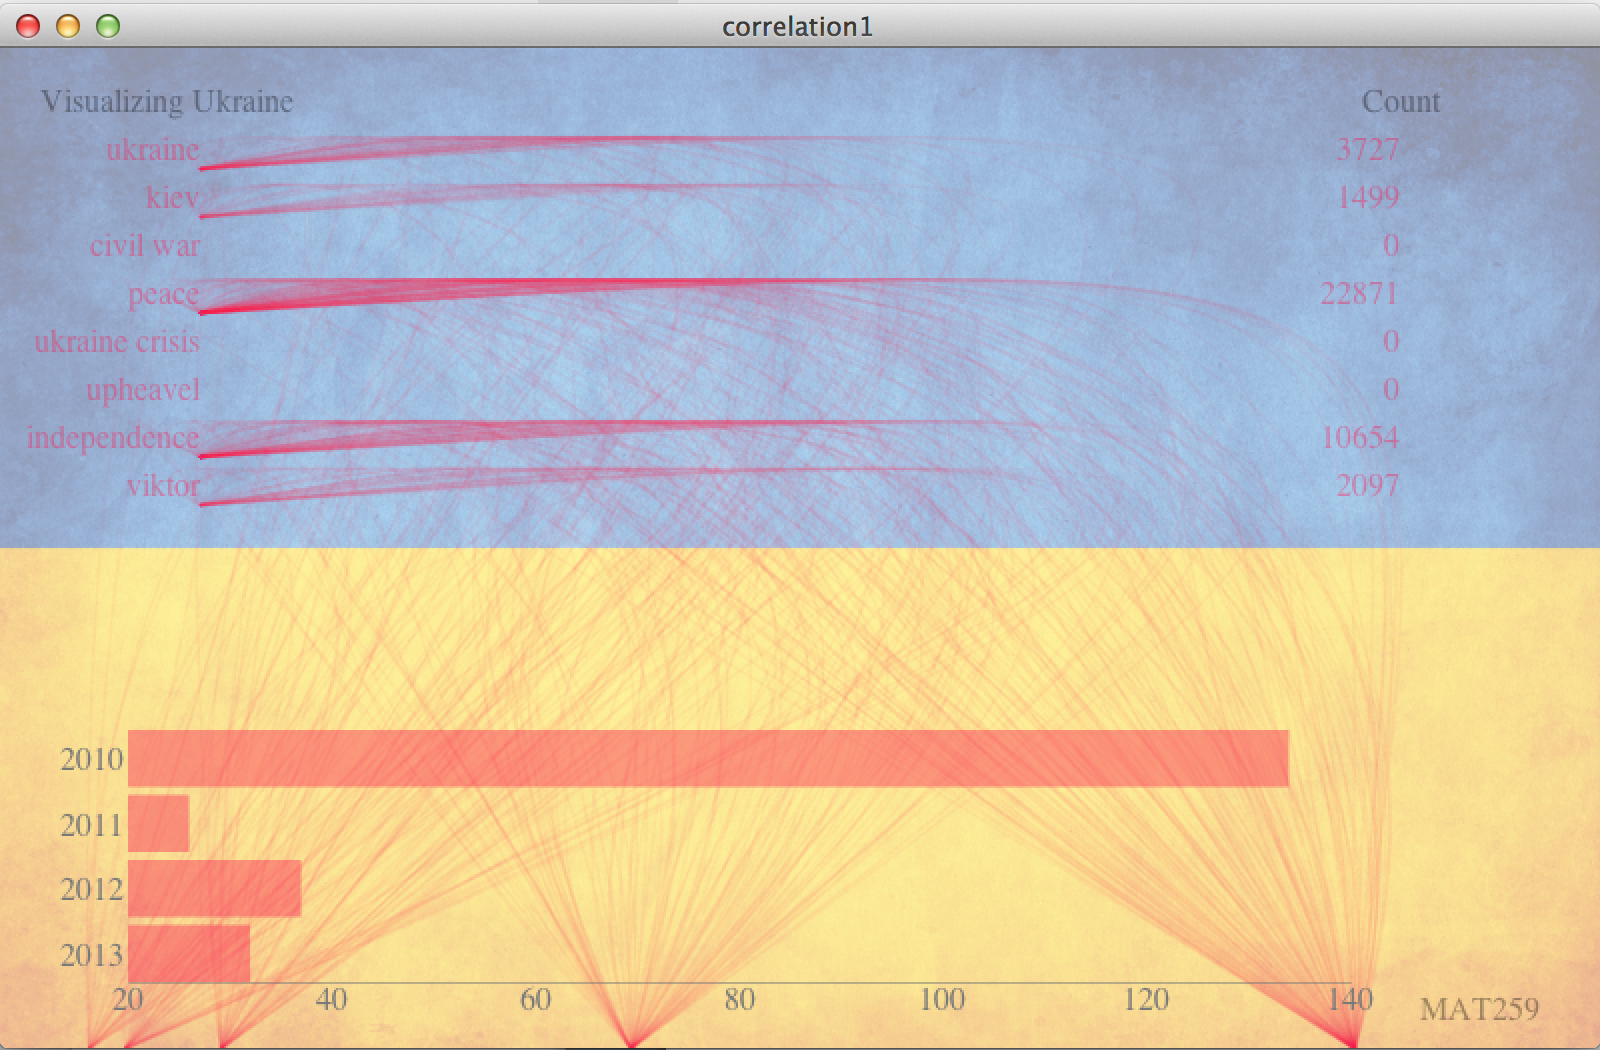
This animated visualization project is intended as an abstract visualization where the correlation between NY Times and SPL is evident by looking at different parts of the Ukraine flag. You can also see the intersection between the two different ideas of east and west coast. The original doodle is built on a 2d 4 quadrant symmetric axis that shows the text cloud and histogram of checkout history across three different data sets.
As can be seen in this doodle, I designed to show the histogram of checkouts in ney york times vs Line correlation belonging to SPL
Query
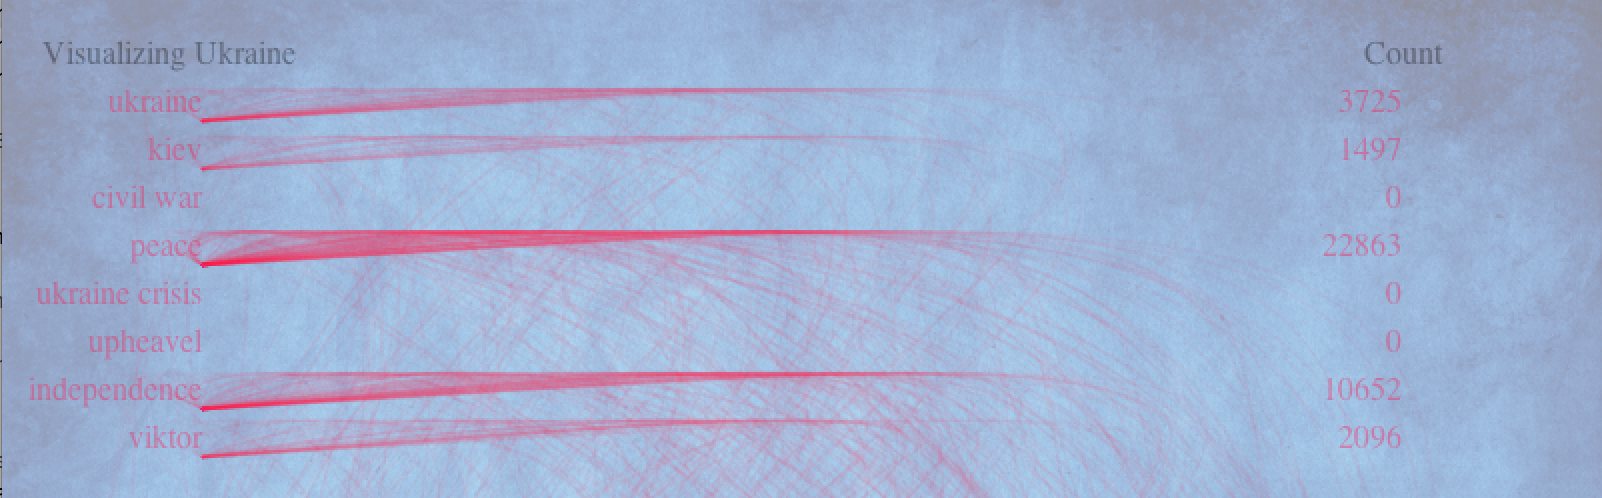
This query is run on the ‘spl1’ database computing distribution of transactions across different keywords in title and different dewey categories between 2009 and 2012.
for each:
I have decided to query from 2010, since many people claim the elections were fraud and invalid. select title, year(cout), count(*), date(cout) from spl2.inraw where year(cout) >= 2010 and title like "%ukraine%" group by title; Processing Time: 44.23 sec select title, year(cout), count(*), date(cout) from spl2.inraw where year(cout) >= 2010 and title like "%kiev%" group by title; Processing Time: 43.93 sec
Process
2D Version:
As can be seen below, we can see .
Using the above query, I was able to fetch each data set upon corresponding keyword The visualization below used a cylinder structure with 10 sides.
As can be seen below, we can see .
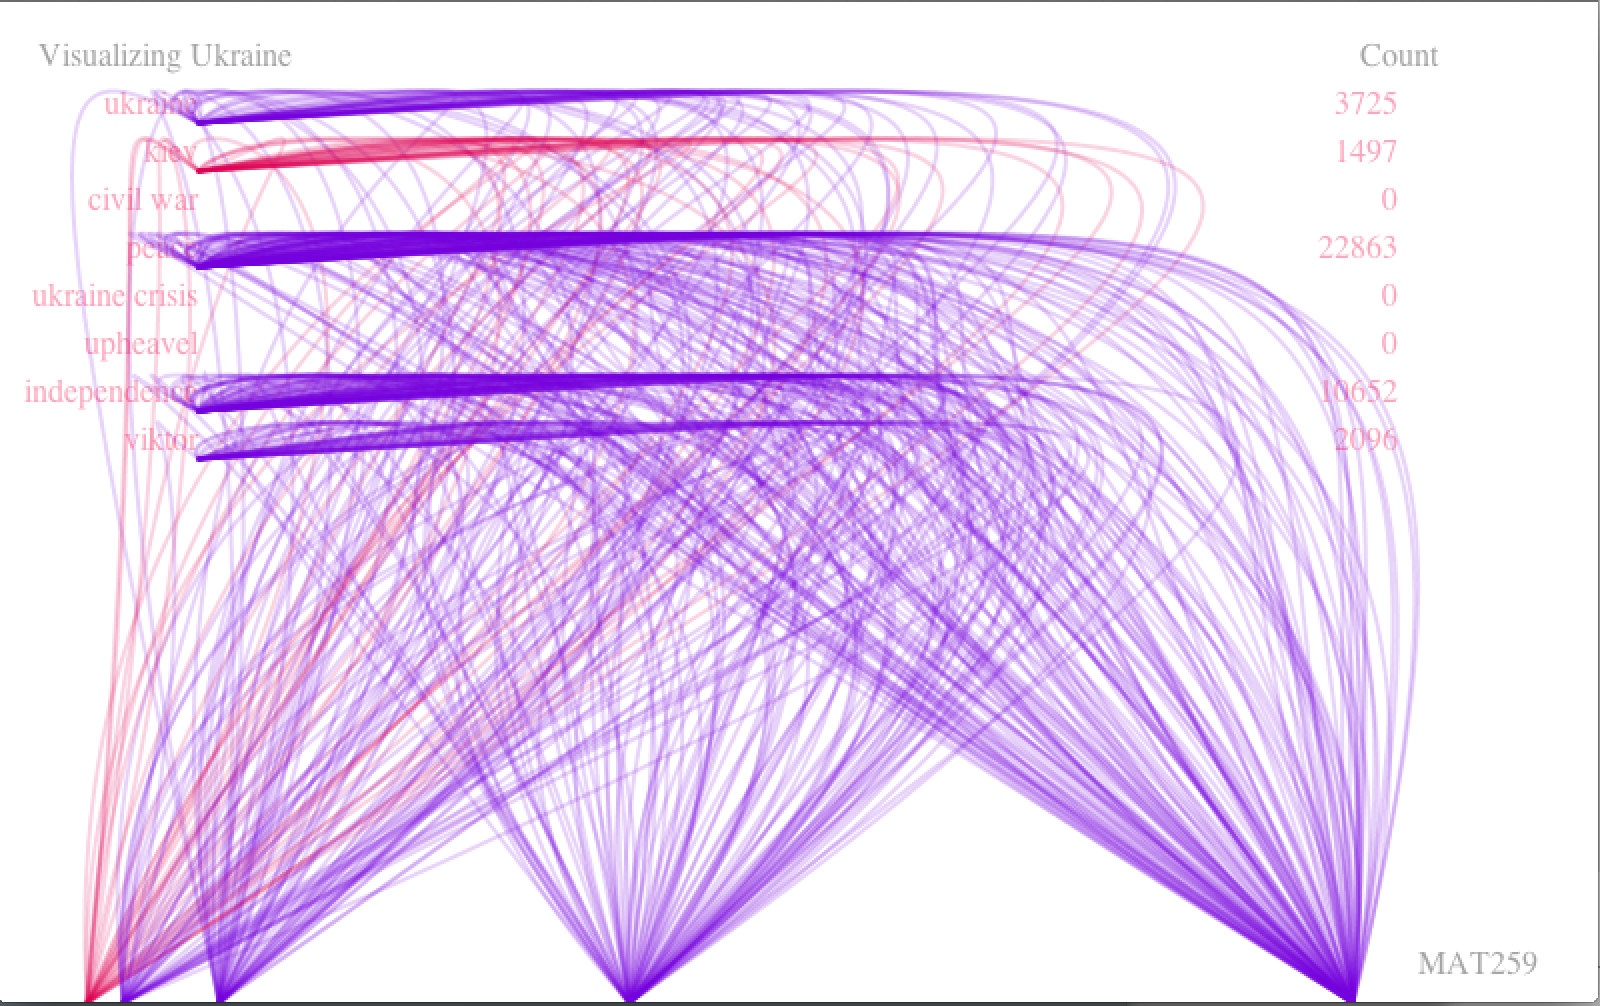
Using the above query, I was able to fetch each data set upon corresponding keyword The visualization below used a cylinder structure with 10 sides.
Results and Analysis
(g) Final visualization with labels, legends and optimized color schemes.
Code
Control
Press 1-4 for different camera views
c/x : change to different palette (0 to 10)
l : stroke on / off
s : Stat view on / off
d : dewey particles
p : pyramids on / off (checkouts in each year below the disk)
c/x : change to different palette (0 to 10)
l : stroke on / off
s : Stat view on / off
d : dewey particles
p : pyramids on / off (checkouts in each year below the disk)