Data Correlation: History of Best-sellers vs Total number of checkouts
MAT 259, 2014
Lakshman Nataraj
Introduction
In Assignment 2, I had observed the checkouts per month for some of the top manga between 2006 and 2011 in a 2D Spatial map. In this assignment of data correlation, I will be using almost the same list of manga and will count the total number of checkouts for every manga in the list from the Seattle Pubic Library. I will compare this with the total number of best-sellers for every manga from the NY Times best-seller history list. The list of manga considered are:
1. Naruto
2. Bleach
3. One Piece
4. Fairy Tail
5. Dengeki Daisy
6. Skip Beat
7. Vampire Knight
8. Black Bird
9. Soul Eater
10.Rosario-Vampire
1. Naruto
2. Bleach
3. One Piece
4. Fairy Tail
5. Dengeki Daisy
6. Skip Beat
7. Vampire Knight
8. Black Bird
9. Soul Eater
10.Rosario-Vampire
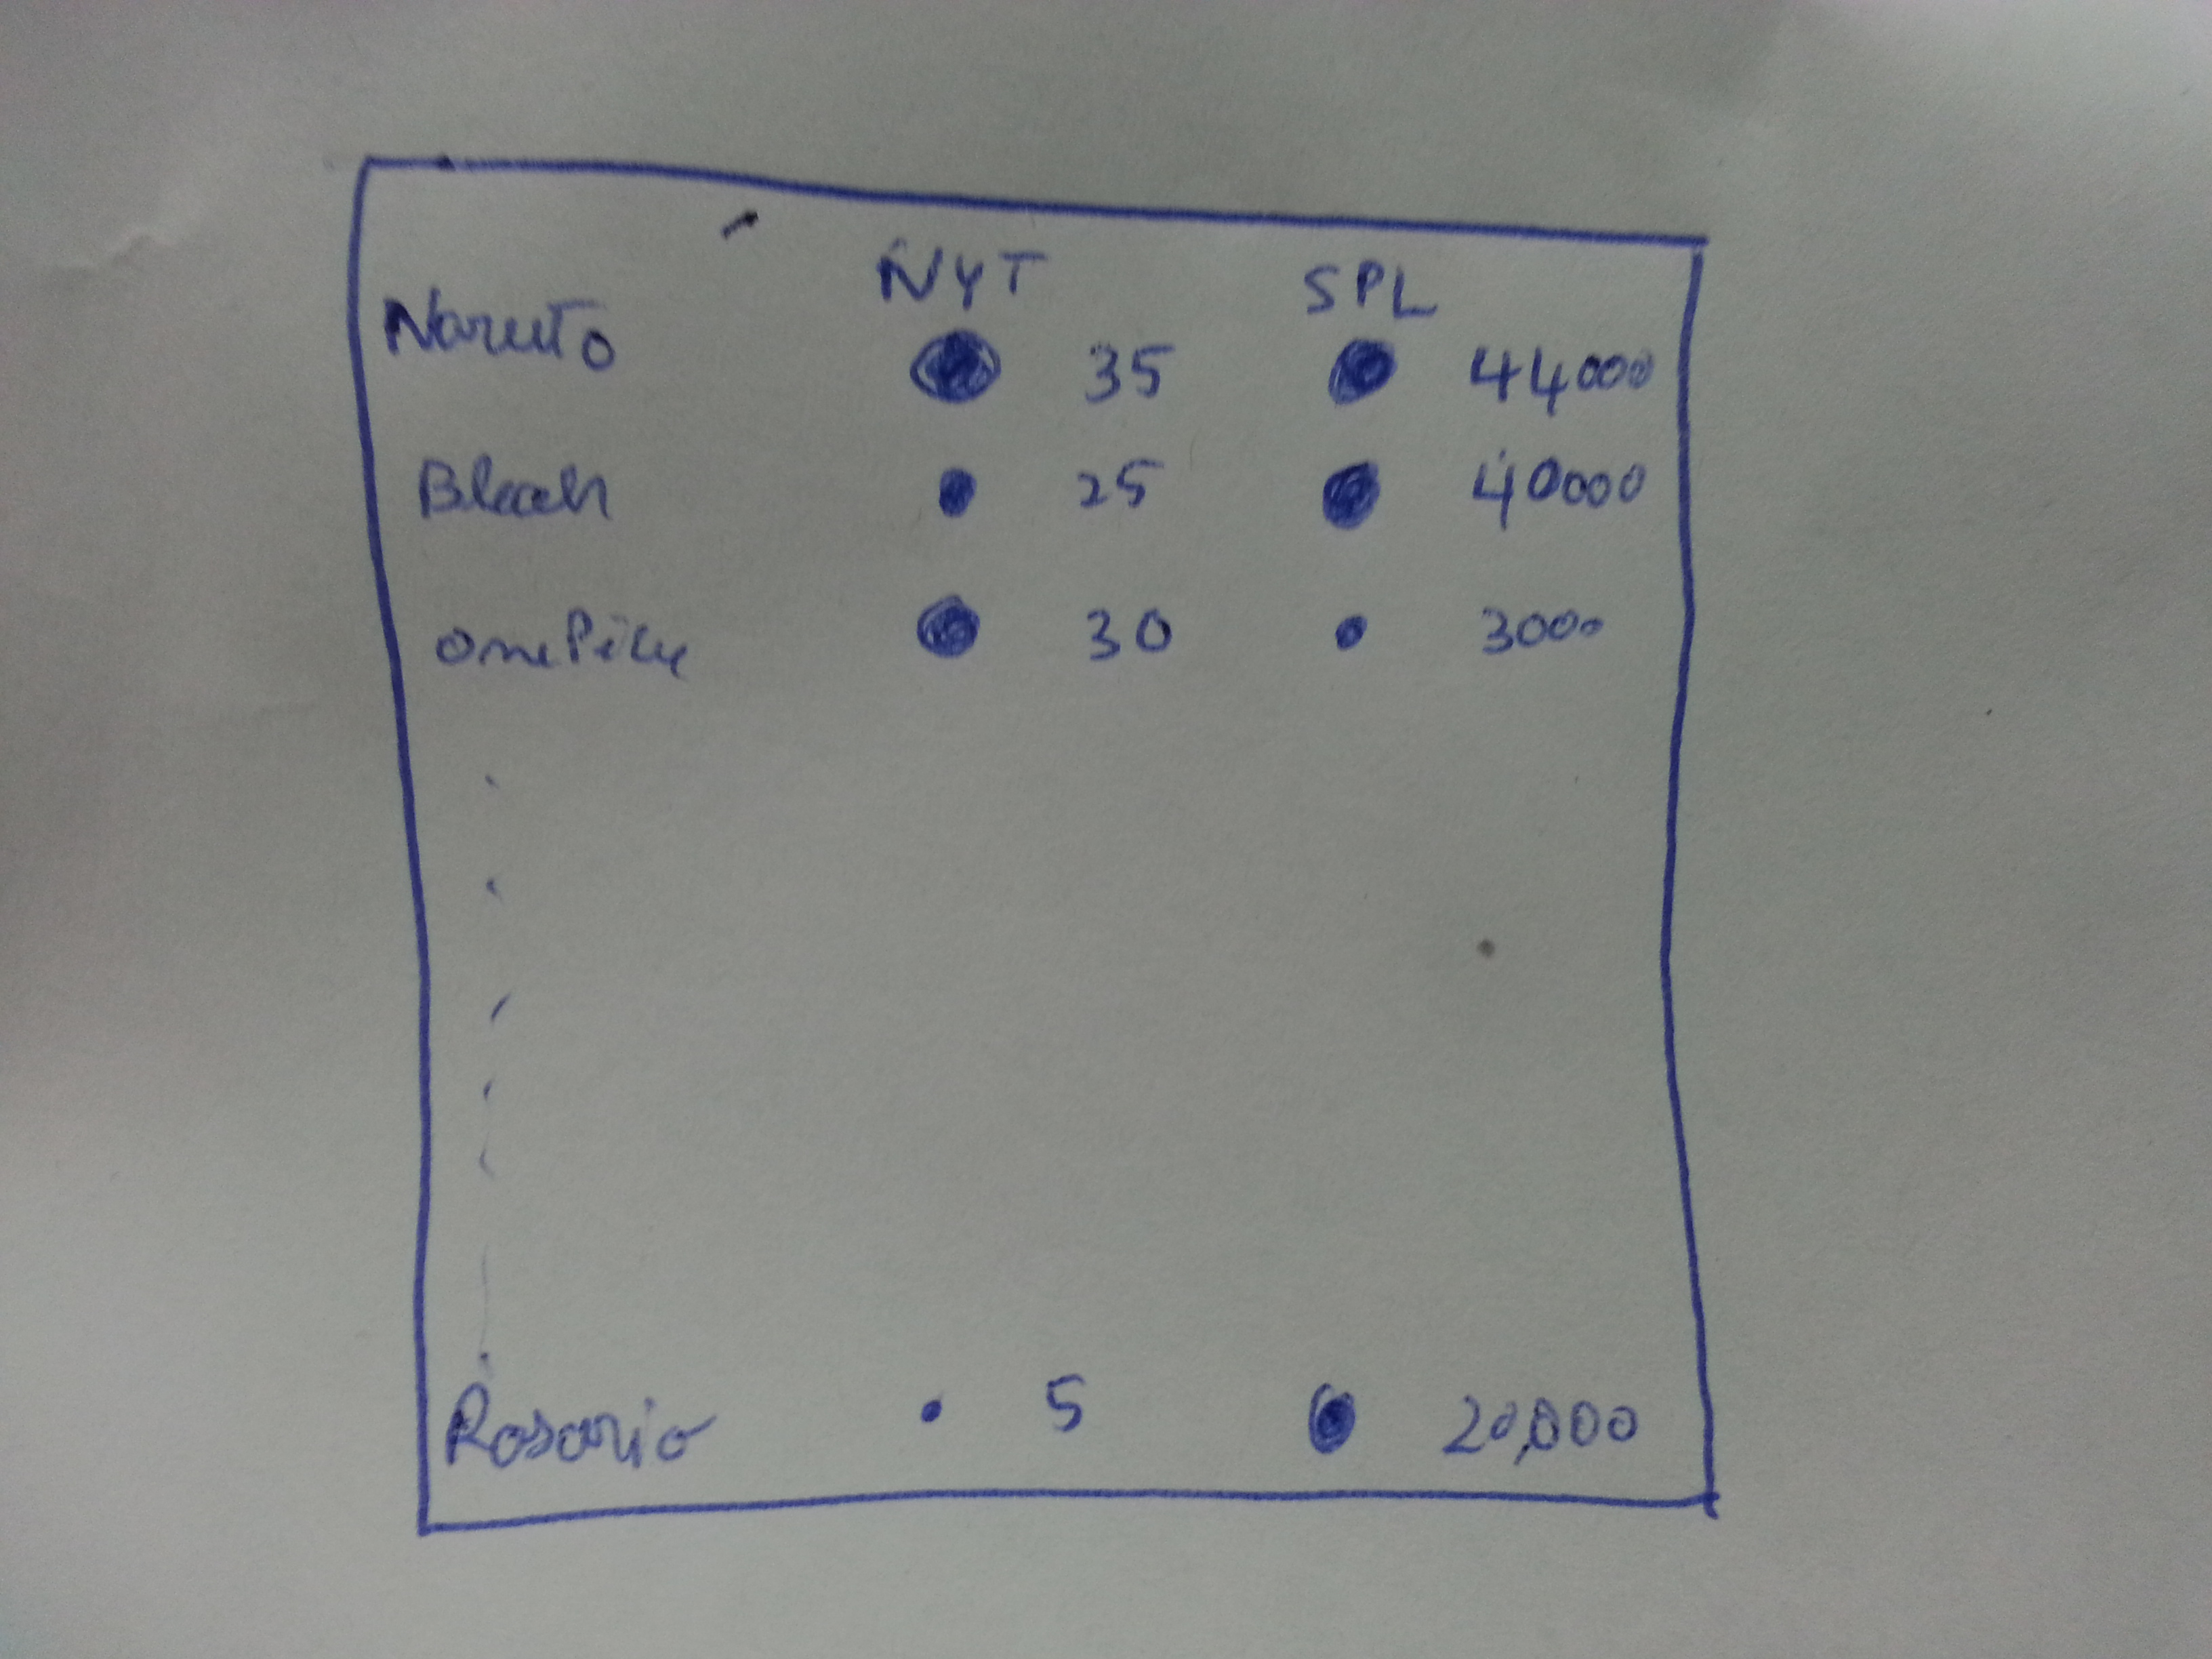
Background and Sketches
Doodle
Query
A sample query to count the total number of checkouts for a manga ('naruto') will be like:
:
SELECT count(*) FROM spl2.inraw
where (title like "%snaruto%" and itemtype="acbk")
and deweyClass = "741.5952";
:
SELECT count(*) FROM spl2.inraw
where (title like "%snaruto%" and itemtype="acbk")
and deweyClass = "741.5952";
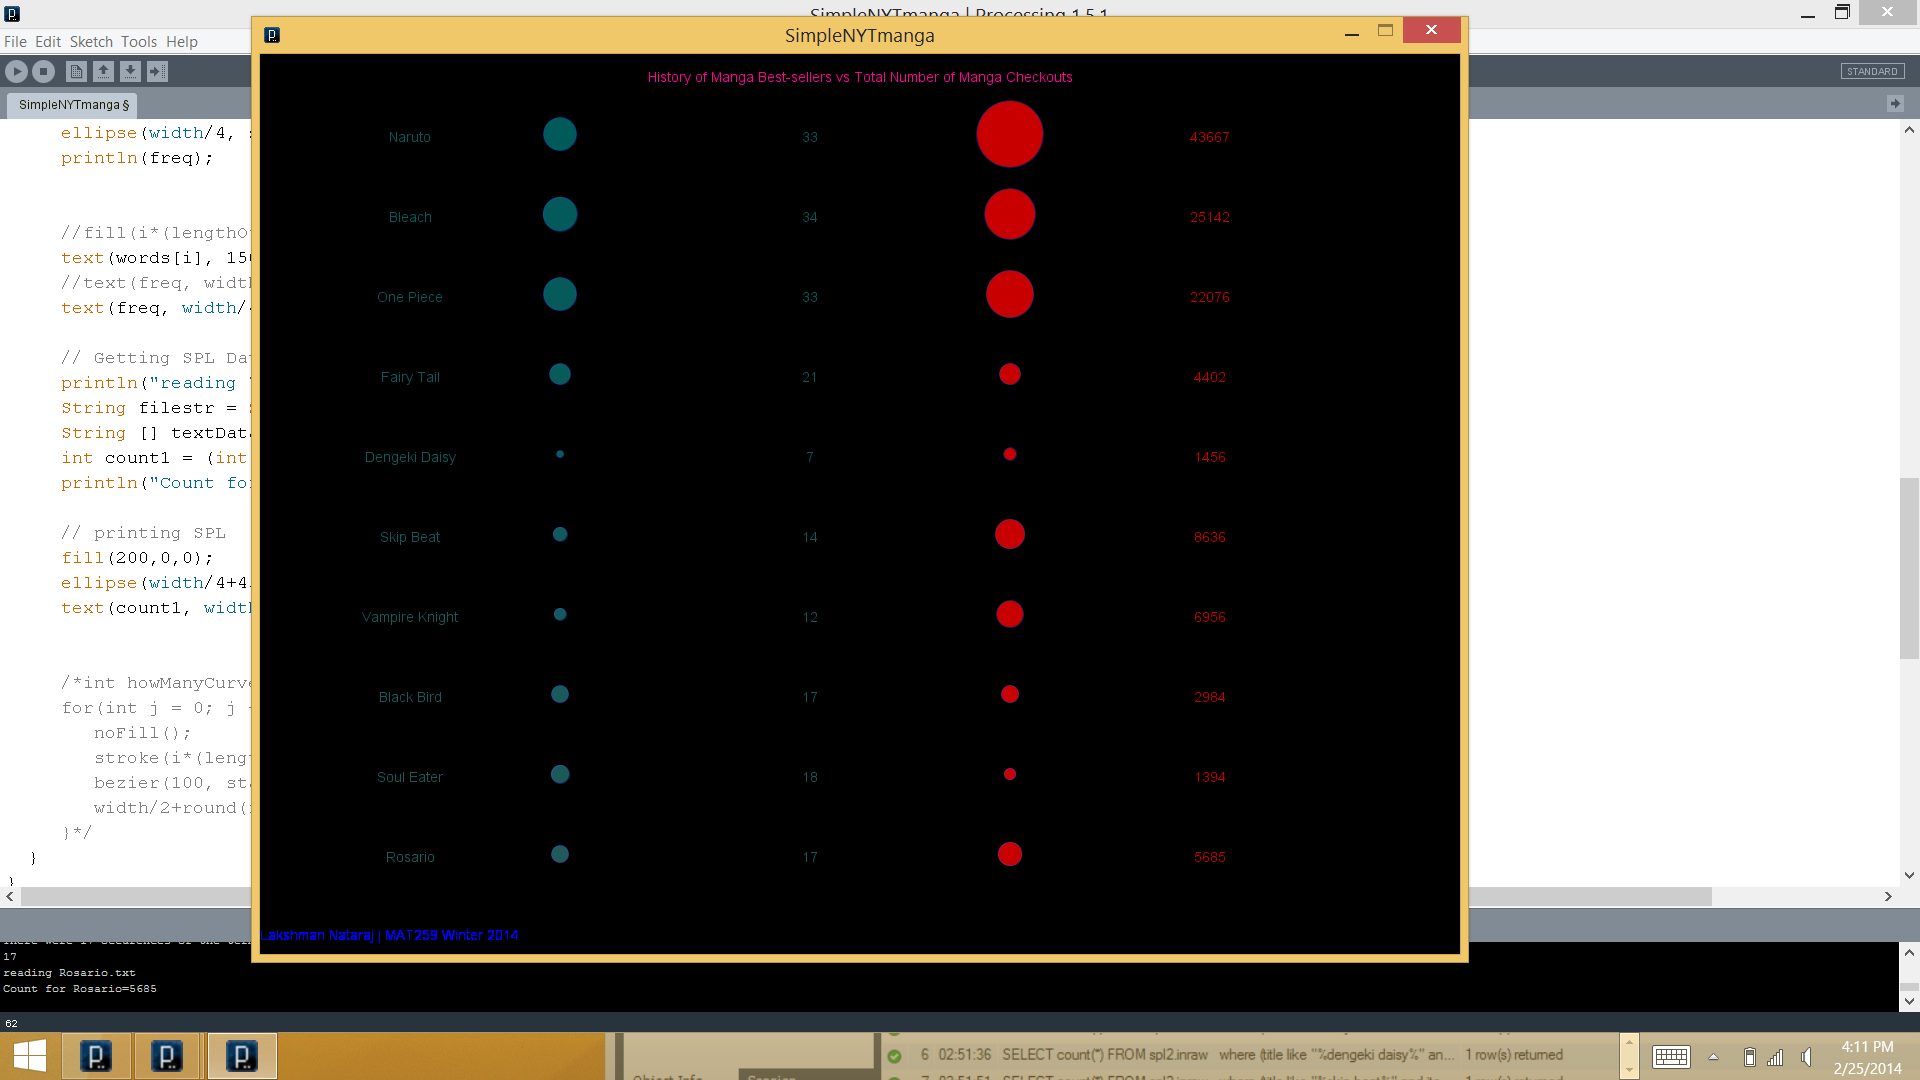
Final Visualization
We see that there is a stunning correlation between the manga checkouts from Seattle Pubic Library and the number of manga in the history of best-sellers from NY Times.
Code