Wikipedia Page Visits vs. SPL Check-outs
MAT 259, 2014
Grant McKenzie
Introduction
With the increase in online sources of information, the role of Libraries is changing. Sites like Wikipedia (ranked 6th in terms of web traffic) offer a plethora of information through crowd-sourced means. What is of interest is how exploration of subject matter through physical media differs from that of online content. While material “check-outs” from the Seattle Public Library are a biased subset of the use the of physical media, they still do offer insight in to subject-matter interest.
For this project I propose to explore the correlation between visits to Wikipedia subject pages and SPL media check-out data related to that same subject. Comparing these “visits” and “check-outs” visually over time will allow one to see trends in the data as well as visually see any correlation that exists. Given that the Seattle Public Library is located in Seattle, I thought it might be interesting to look at a number of major businesses that call Seattle home.
For this project I propose to explore the correlation between visits to Wikipedia subject pages and SPL media check-out data related to that same subject. Comparing these “visits” and “check-outs” visually over time will allow one to see trends in the data as well as visually see any correlation that exists. Given that the Seattle Public Library is located in Seattle, I thought it might be interesting to look at a number of major businesses that call Seattle home.
Background and Sketches
The companies/topics I chose to correlate Wikipedia and SPL data on are
Extraction of data from the Seattle Public Library dataset involved one query per company. Each query looked for the stemmed country name keyword in the Title or the Subject of the check-out record. Additionally, the data was restricted to between 2010 – 2013 inclusive.
Wikipedia
The site: “http://stats.grok.se” offers access to daily site visit data for Wikipedia entries. For example the URL “http://stats.grok.se/json/en/201212/starbucks” returns a JSON object of daily visits to the Starbucks Wikipedia page for the month of December 2012. A script was written to download and parse all daily visits from January 1, 2010 to December 31, 2013. A CSV file was produced for all subjects of interest.
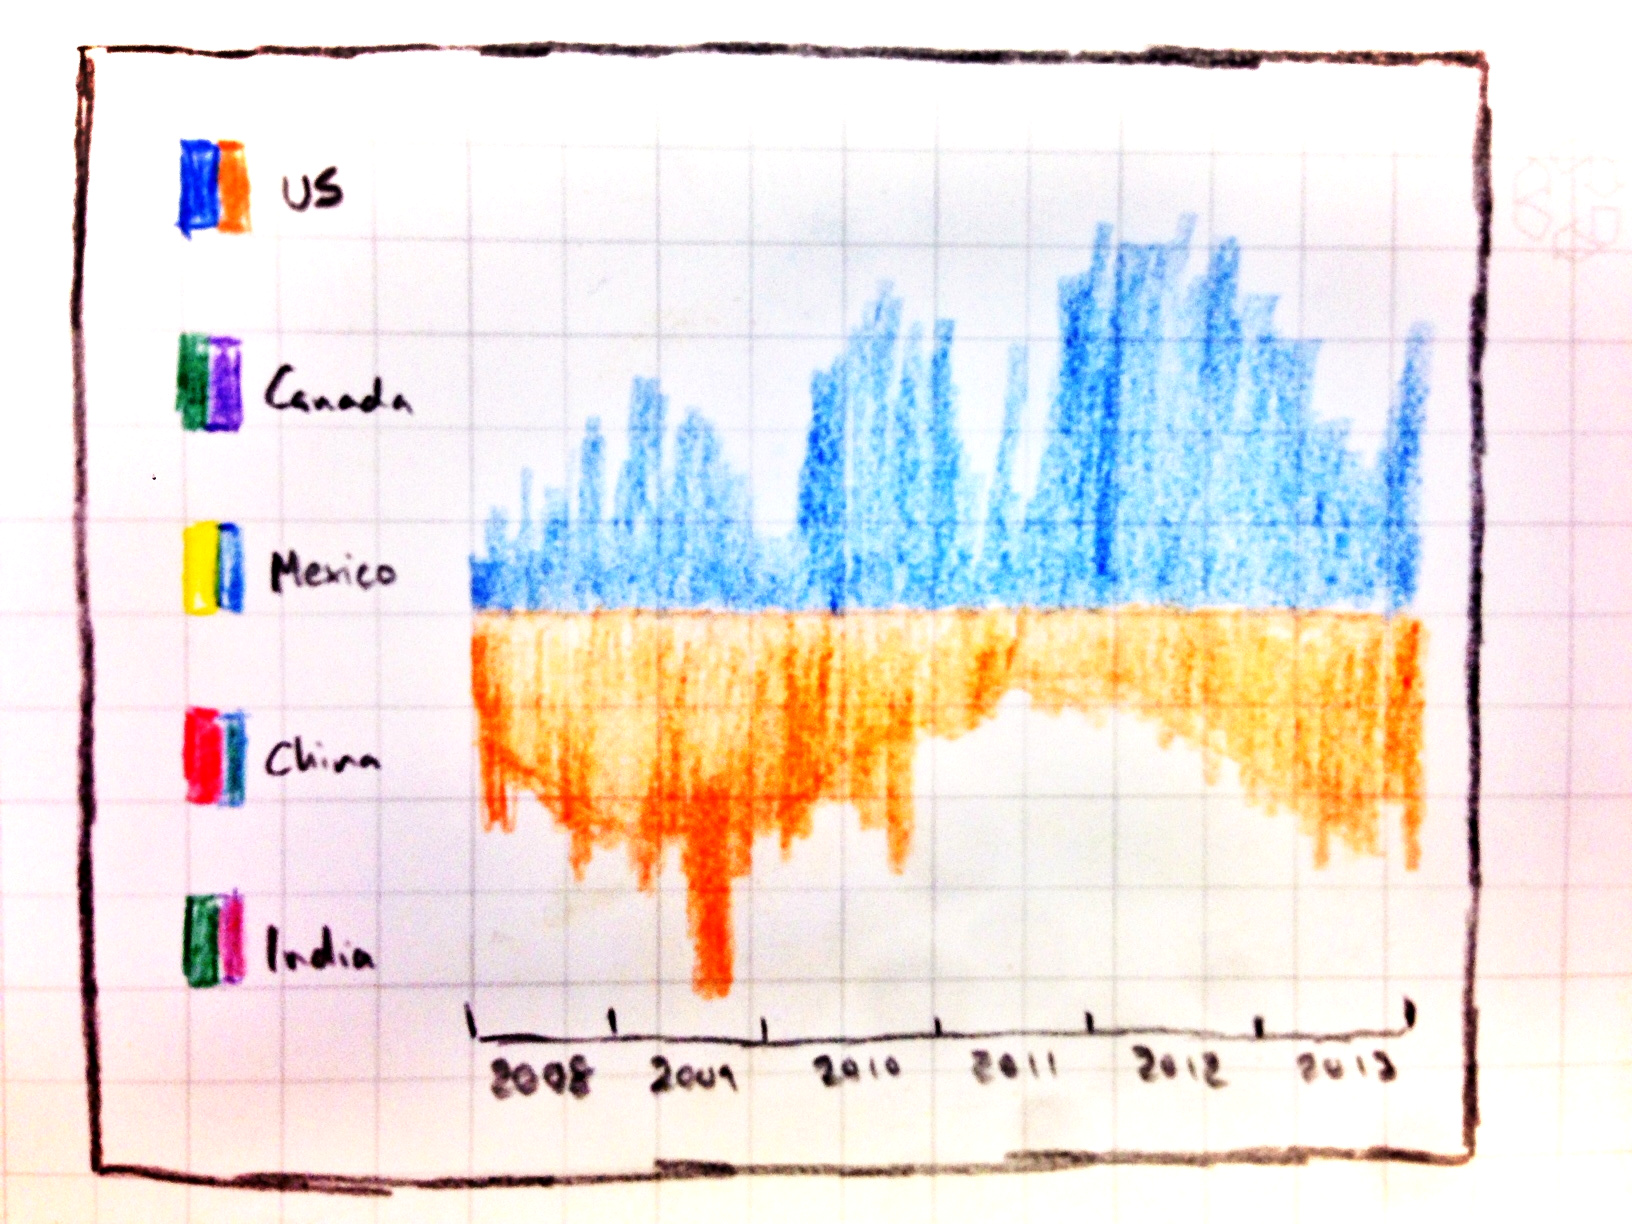
This original doodle was designed using Countries as the subjects of interest. This has since changed to Companies based in Seattle, WA.
- Microsoft
- Boeing
- Starbucks
- The University of Washington
Extraction of data from the Seattle Public Library dataset involved one query per company. Each query looked for the stemmed country name keyword in the Title or the Subject of the check-out record. Additionally, the data was restricted to between 2010 – 2013 inclusive.
Wikipedia
The site: “http://stats.grok.se” offers access to daily site visit data for Wikipedia entries. For example the URL “http://stats.grok.se/json/en/201212/starbucks” returns a JSON object of daily visits to the Starbucks Wikipedia page for the month of December 2012. A script was written to download and parse all daily visits from January 1, 2010 to December 31, 2013. A CSV file was produced for all subjects of interest.
This original doodle was designed using Countries as the subjects of interest. This has since changed to Companies based in Seattle, WA.
Query
SELECT d, count(*) as cnt
FROM
(select unix_timestamp(cout) as d
FROM spl2.outraw
WHERE (title like '%starbucks%' or subj like '%starbucks')
AND (year(cout) >= 2009) AND year(cout) < 2014) a
GROUP BY d
ORDER BY d asc;
FROM
(select unix_timestamp(cout) as d
FROM spl2.outraw
WHERE (title like '%starbucks%' or subj like '%starbucks')
AND (year(cout) >= 2009) AND year(cout) < 2014) a
GROUP BY d
ORDER BY d asc;
Design Decisions
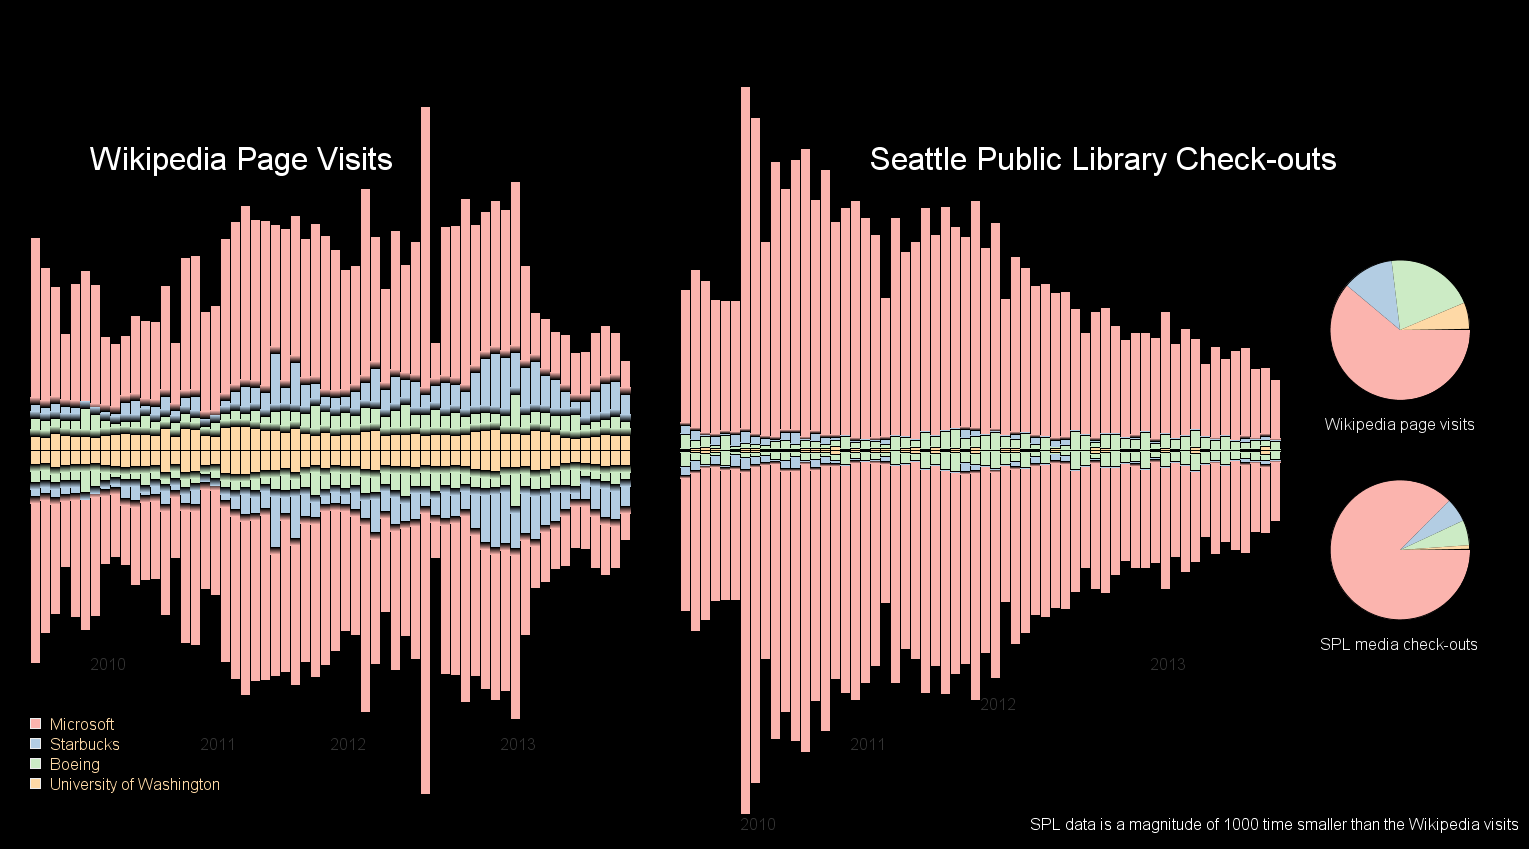
I decided to represent the data as a bidirectional wave or StreamGraph.1 The X-axis of the graph is time labeled by year, but built on daily Wikipedia site visits (first set) and daily SPL checkouts (second set). The Y-axis shows the volume of either page visits (first set) or Seattle Public Library media check-outs (second set). These volumes were collected daily, but visually aggregated to monthly buckets. It is important to note that the values presented for the Seattle Public Library are a full 1000 times smaller than those presented for Wikipedia. Forcing the same approximate size of the data allows user to compare the proportions of one set to the other. If this size adjustment was not done, the user would not be able to see any of the Seattle Public Library checkout data. In addition to the StreamGraph data visualization, two pie charts on the right are shown that represent the total percentages of page visits and media checkouts.
Results
Code