Project 2: 2D Spatial Map
MAT 259, 2014
Concept
As a geographer, I am interested in whether I can apply some cartographical design in the 2D spatial maps such as choropleth maps or spatial density maps to visualize the temporal patterns of check-outs in different granularities, such as hourly, daily, weekly and monthly. And more importantly, different visualization methods might have their own pros and cons. I will try different ways to find a good visualization to show the temporal patterns of check-outs. Specifically, a choropleth map is a thematic 2D-map in which areas are shaded or patterned in proportion to the measurement of the statistical variable being displayed on the map. In addition, with regard to the spatial density maps, it calculates the density of features around each output cell (a cell is one or several pixels) based on its value and neighborhoods’ values. Conceptually, a neighborhood is defined around each cell center, and the number of cells that fall within the neighborhood is summarized and divided by the area of the neighborhood.
Query
For the X-axis dimension, it is labeled as hourly; for the Y-axis dimension, we can change into different temporal scales, such as days of a week, days of a month, or days of a year. Thus, we process different queries.
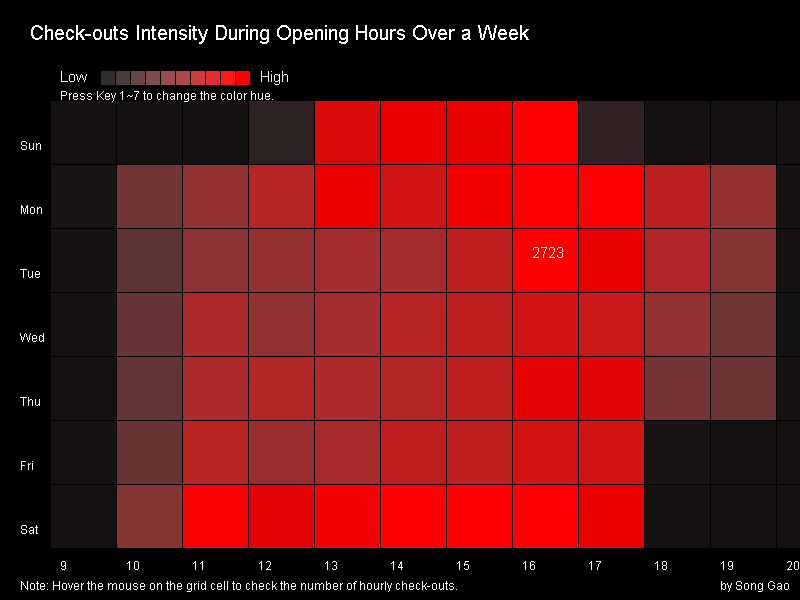
(1)Hourly check-outs "hot-spots" across a week
SELECT dayofweek(cout), hour(cout), count(*)
FROM inraw
WHERE date(cout)>=’2013-10-07’ AND date(cout)<=’2013-10-13’
GROUP BY dayofweek(cout), hour(cout)
ORDER BY dayofweek(cout), hour(cout); /*group the results by different days, note that 1 represents Sunday, 2 for Monday, and such*/
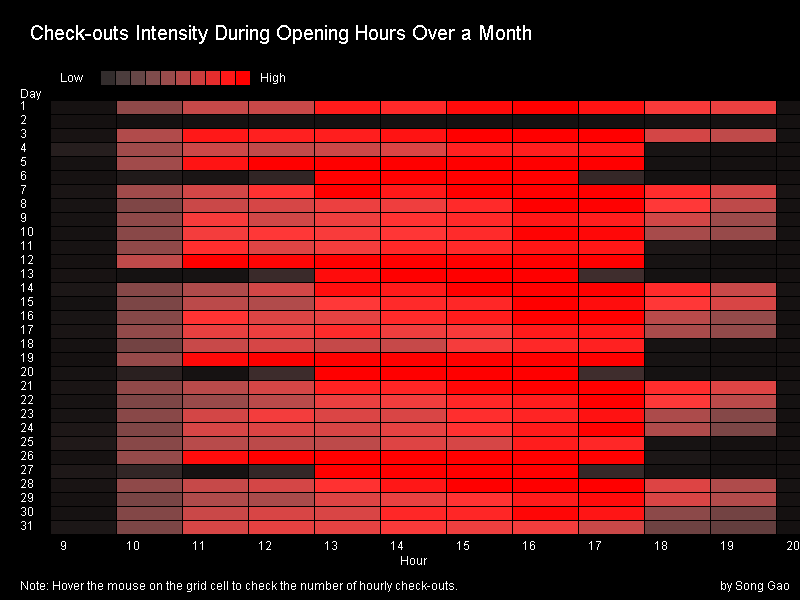
(2)Hourly check-outs "hot-spots" across a month
SELECT dayofmonth(cout), hour(cout), count(*)
FROM inraw
WHERE date(cout)>=’2013-10-01’ AND date(cout)<=’2013-10-31’
GROUP BY dayofweek(cout), hour(cout)
ORDER BY dayofweek(cout), hour(cout);
(3)Hourly check-outs "hot-spots" across a year
SELECT dayofyear(cout), hour(cout), count(*)
FROM inraw
WHERE date(cout)>=’2013-10-01’ AND date(cout)<=’2013-10-31’
GROUP BY dayofweek(cout), hour(cout)
ORDER BY dayofweek(cout), hour(cout);
Processing Time
27.628 seconds and 89 rows returned for query (1)
27.799 seconds and 373 rows returned for query (2)
30.53 seconds and 4319 rows returned for query (3)
Results and Analysis
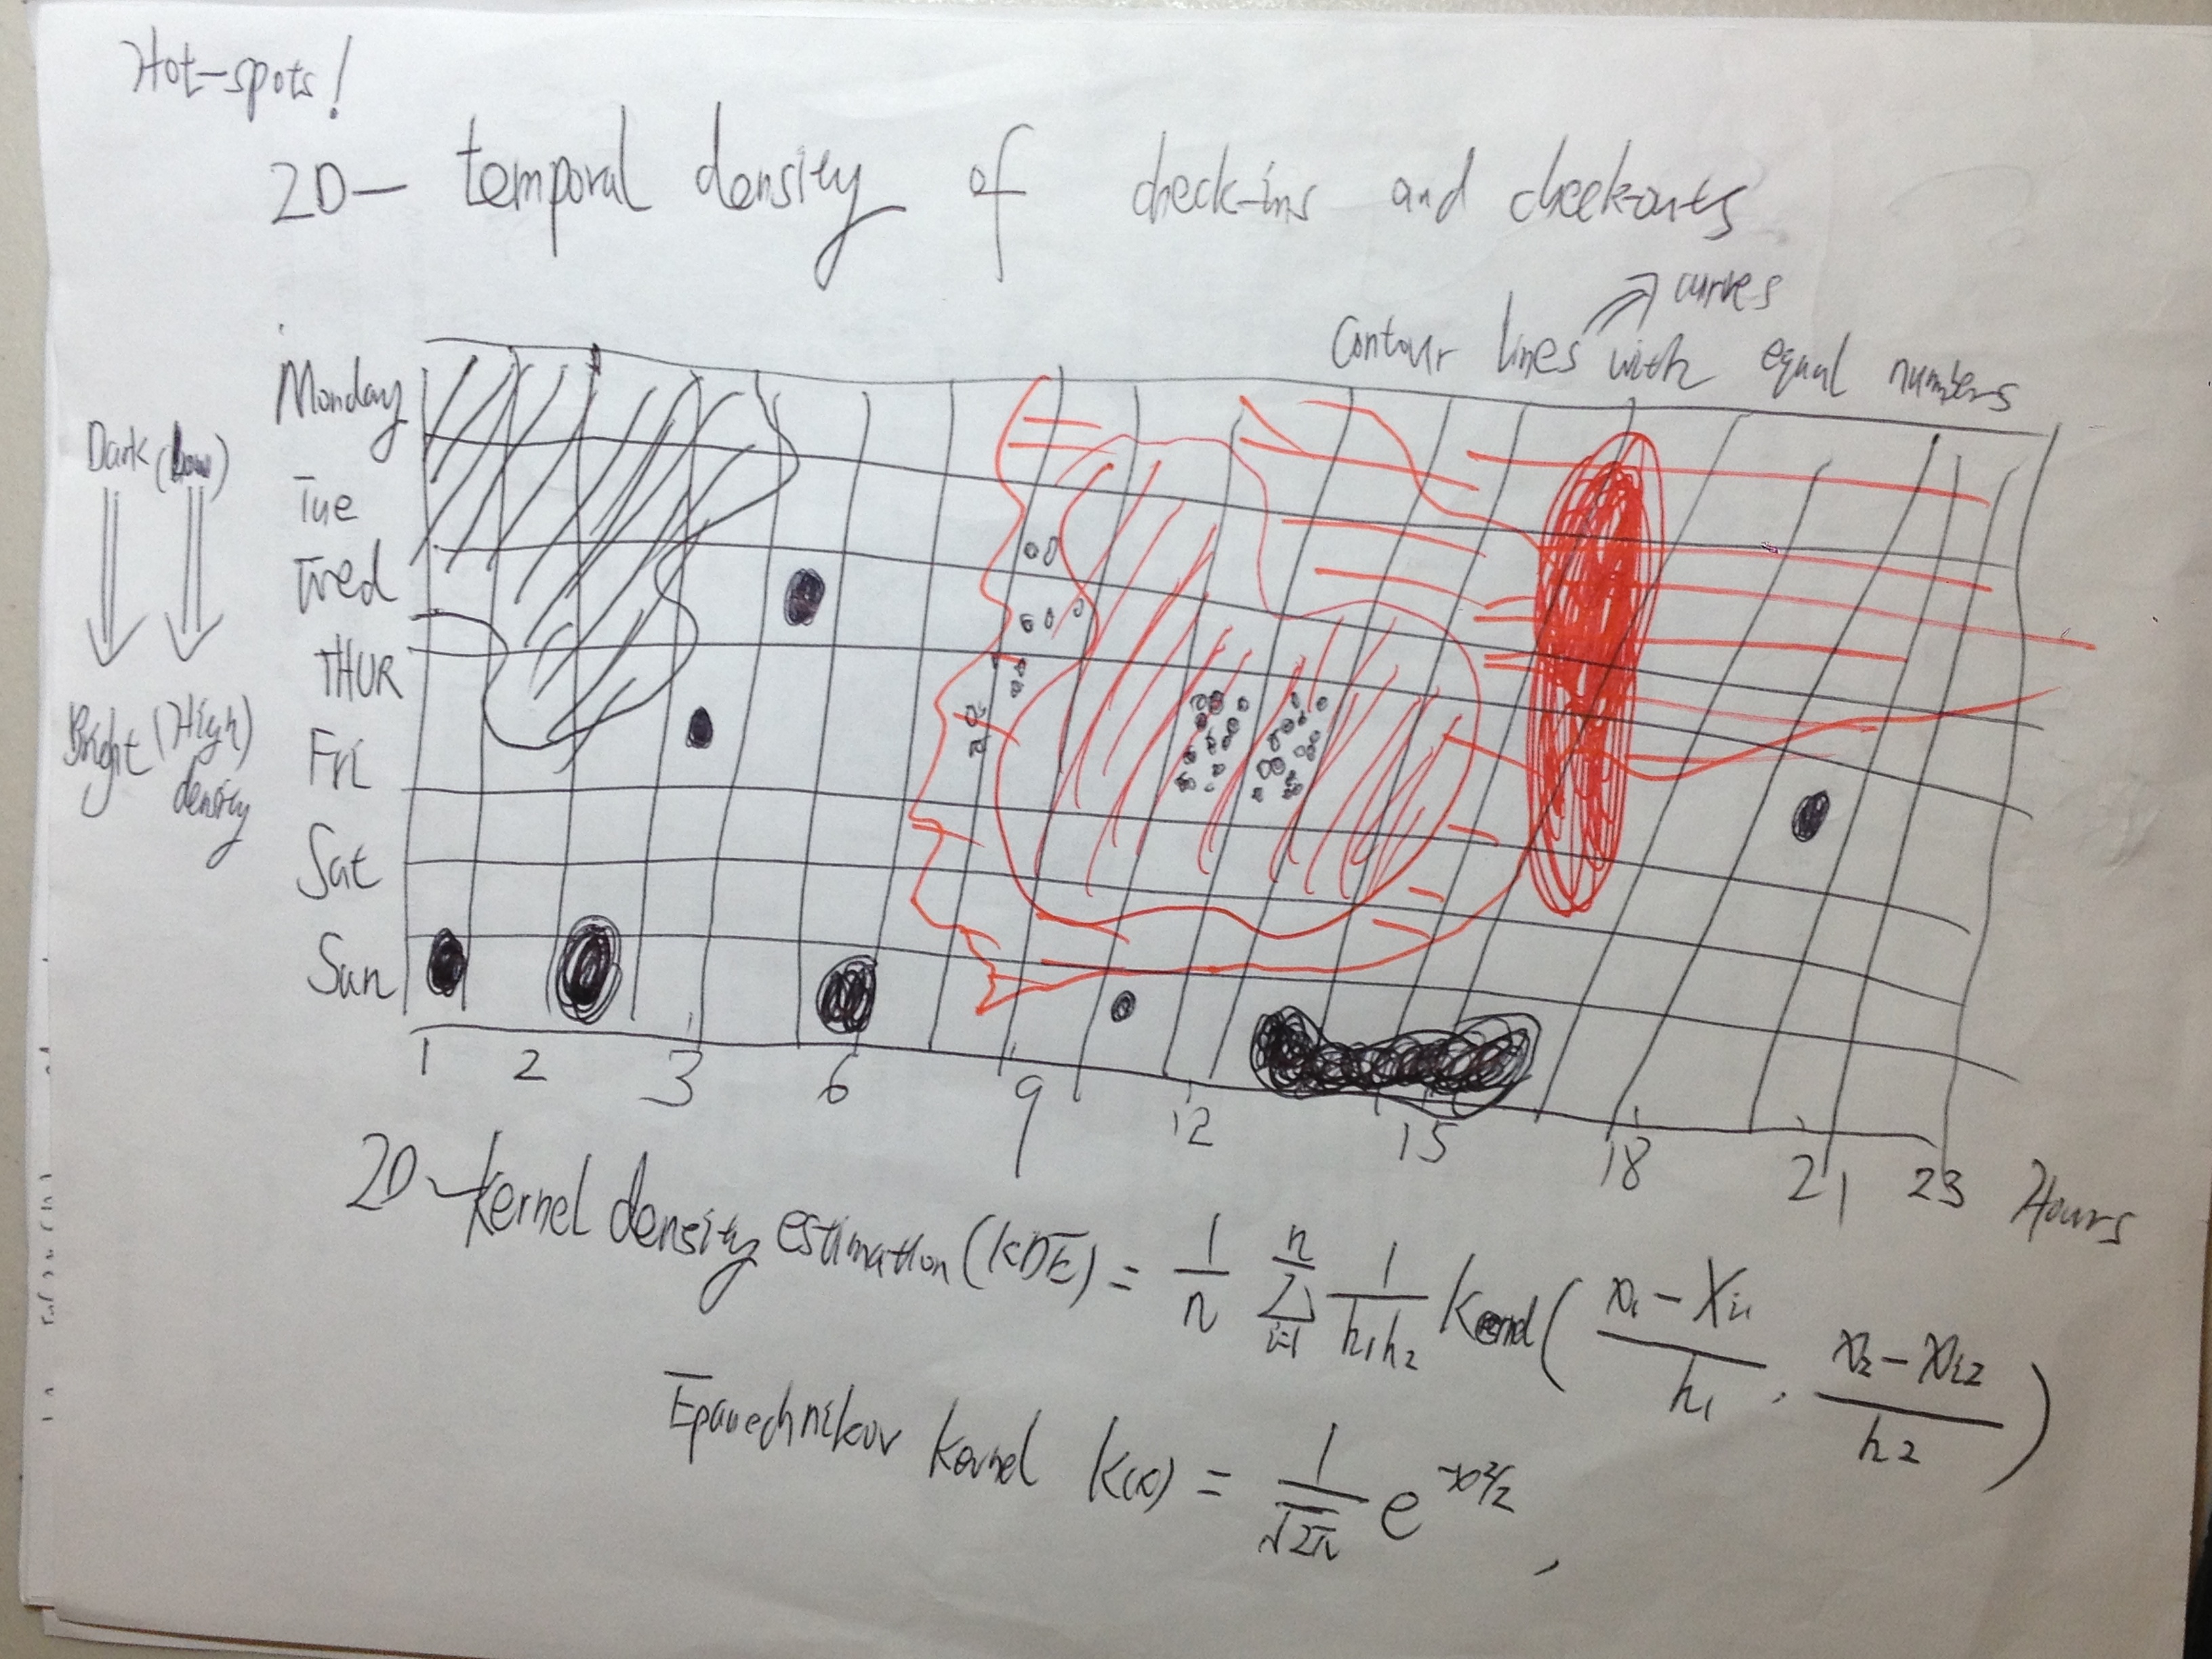
Doodle
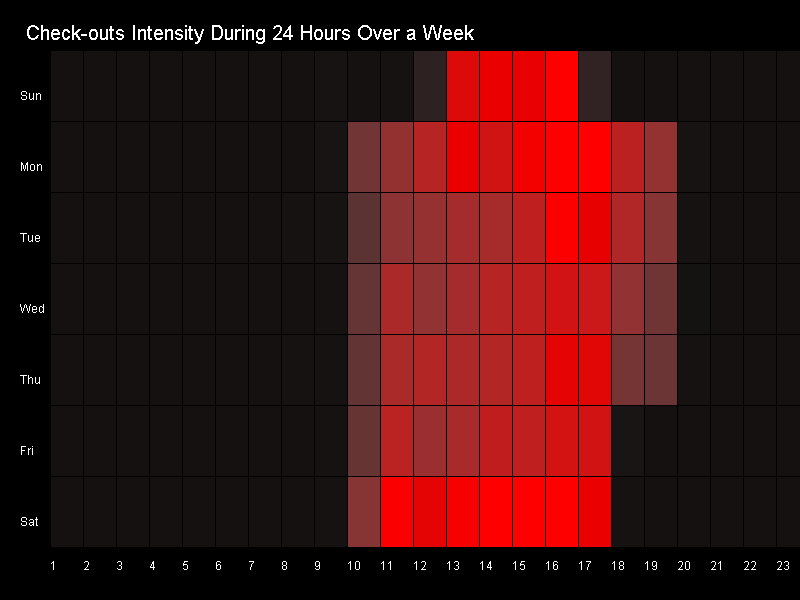
Early Version Visualization
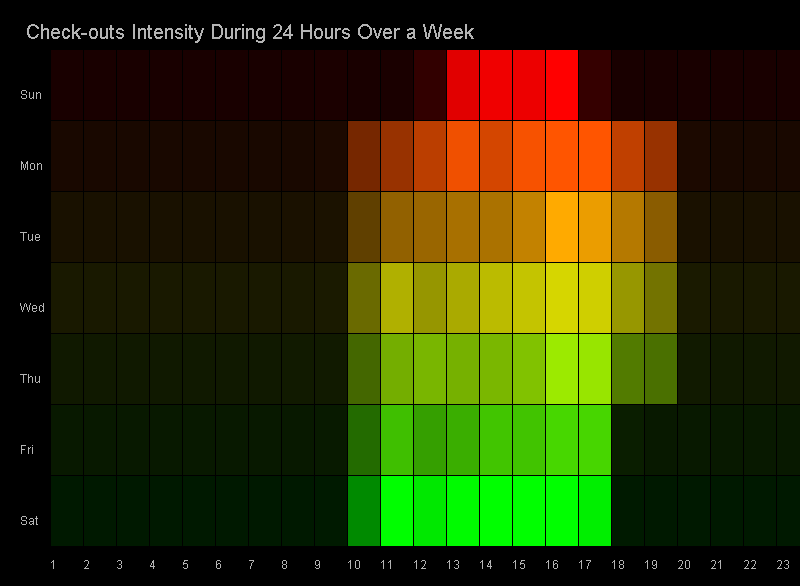
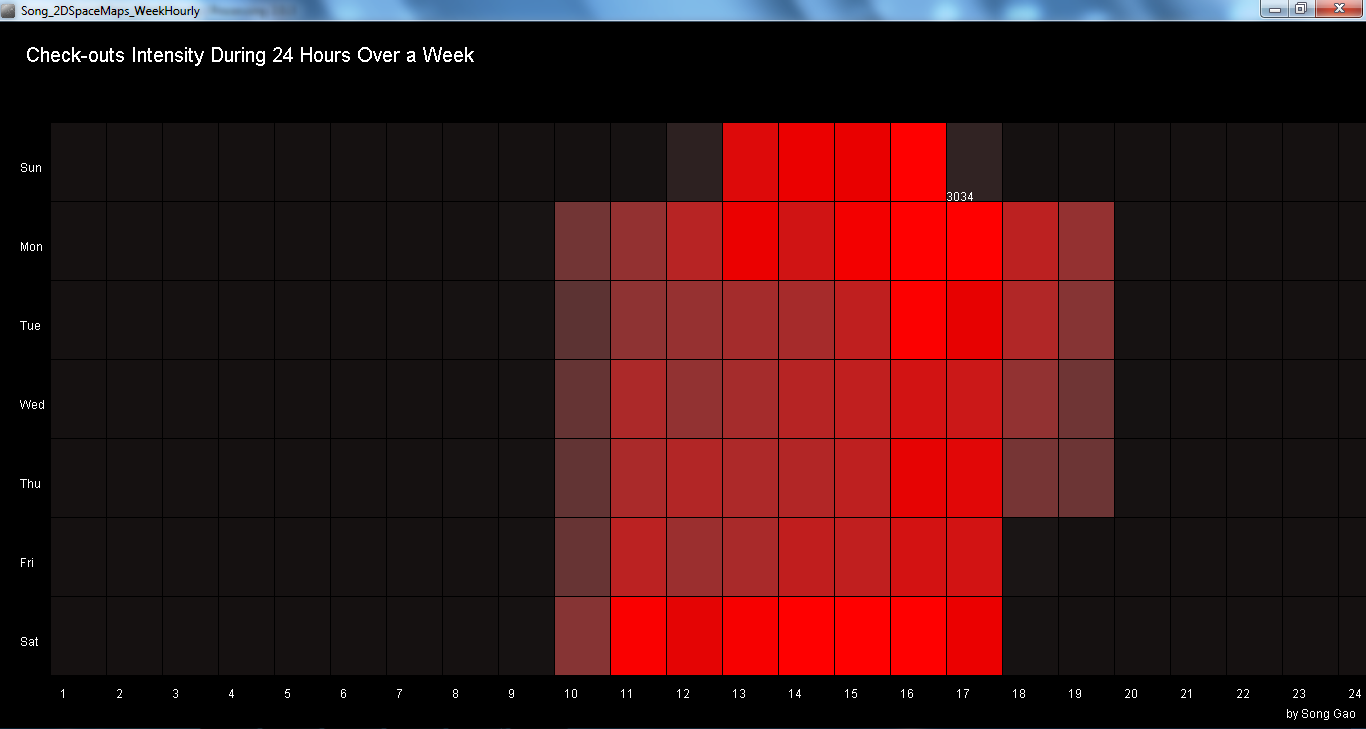
Final Version Visualization
Remove the closed hours for more balance visualization
Interaction
The user can hover the mouse on the grid cell to check the actual number of hourly check-outs. One can also press the key 1, 2, 3, 4, 5, 6, 7 to change the color hue.
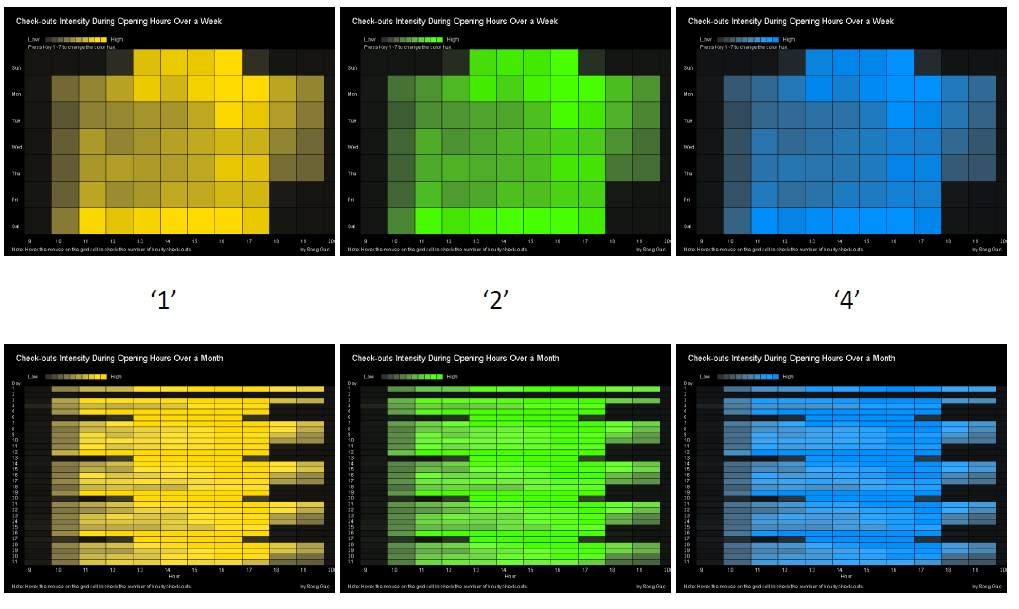
Comments and Analysis
From the Figure "Check-outs Intensity During Opening Hours Over a Week", you can see clearly about the hourly pattern that people tend to return the items between 16~18 in the afternoon and most likely after they finish the daily work. In this specific week, there are also a large number of check-outs on Saturday, from 11AM till 6PM, but for Sunday, such pattern only lasts from 12PM till 5PM, which is related to the Seattle Public Library opening hours on different days and the citizens’ behavior preferences. You can find the similar patterns across the month.
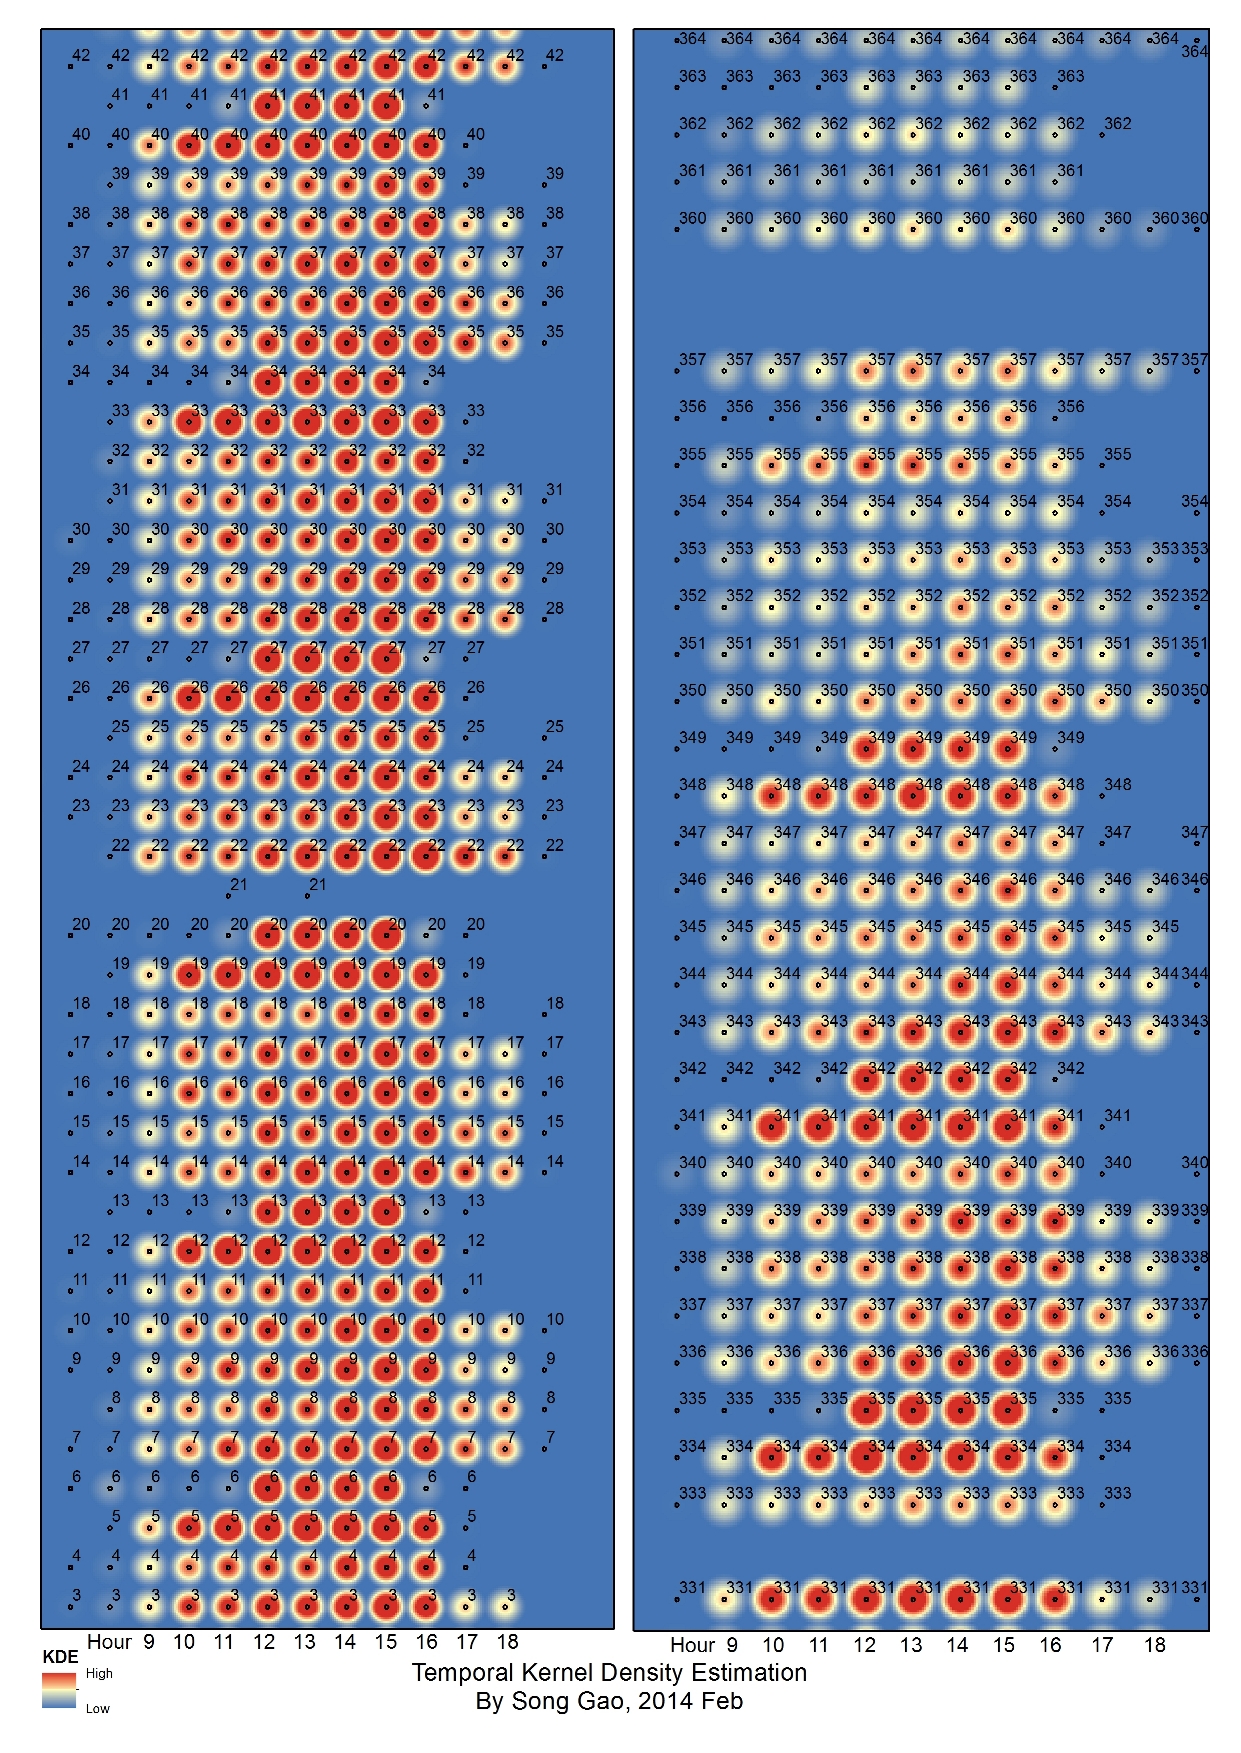
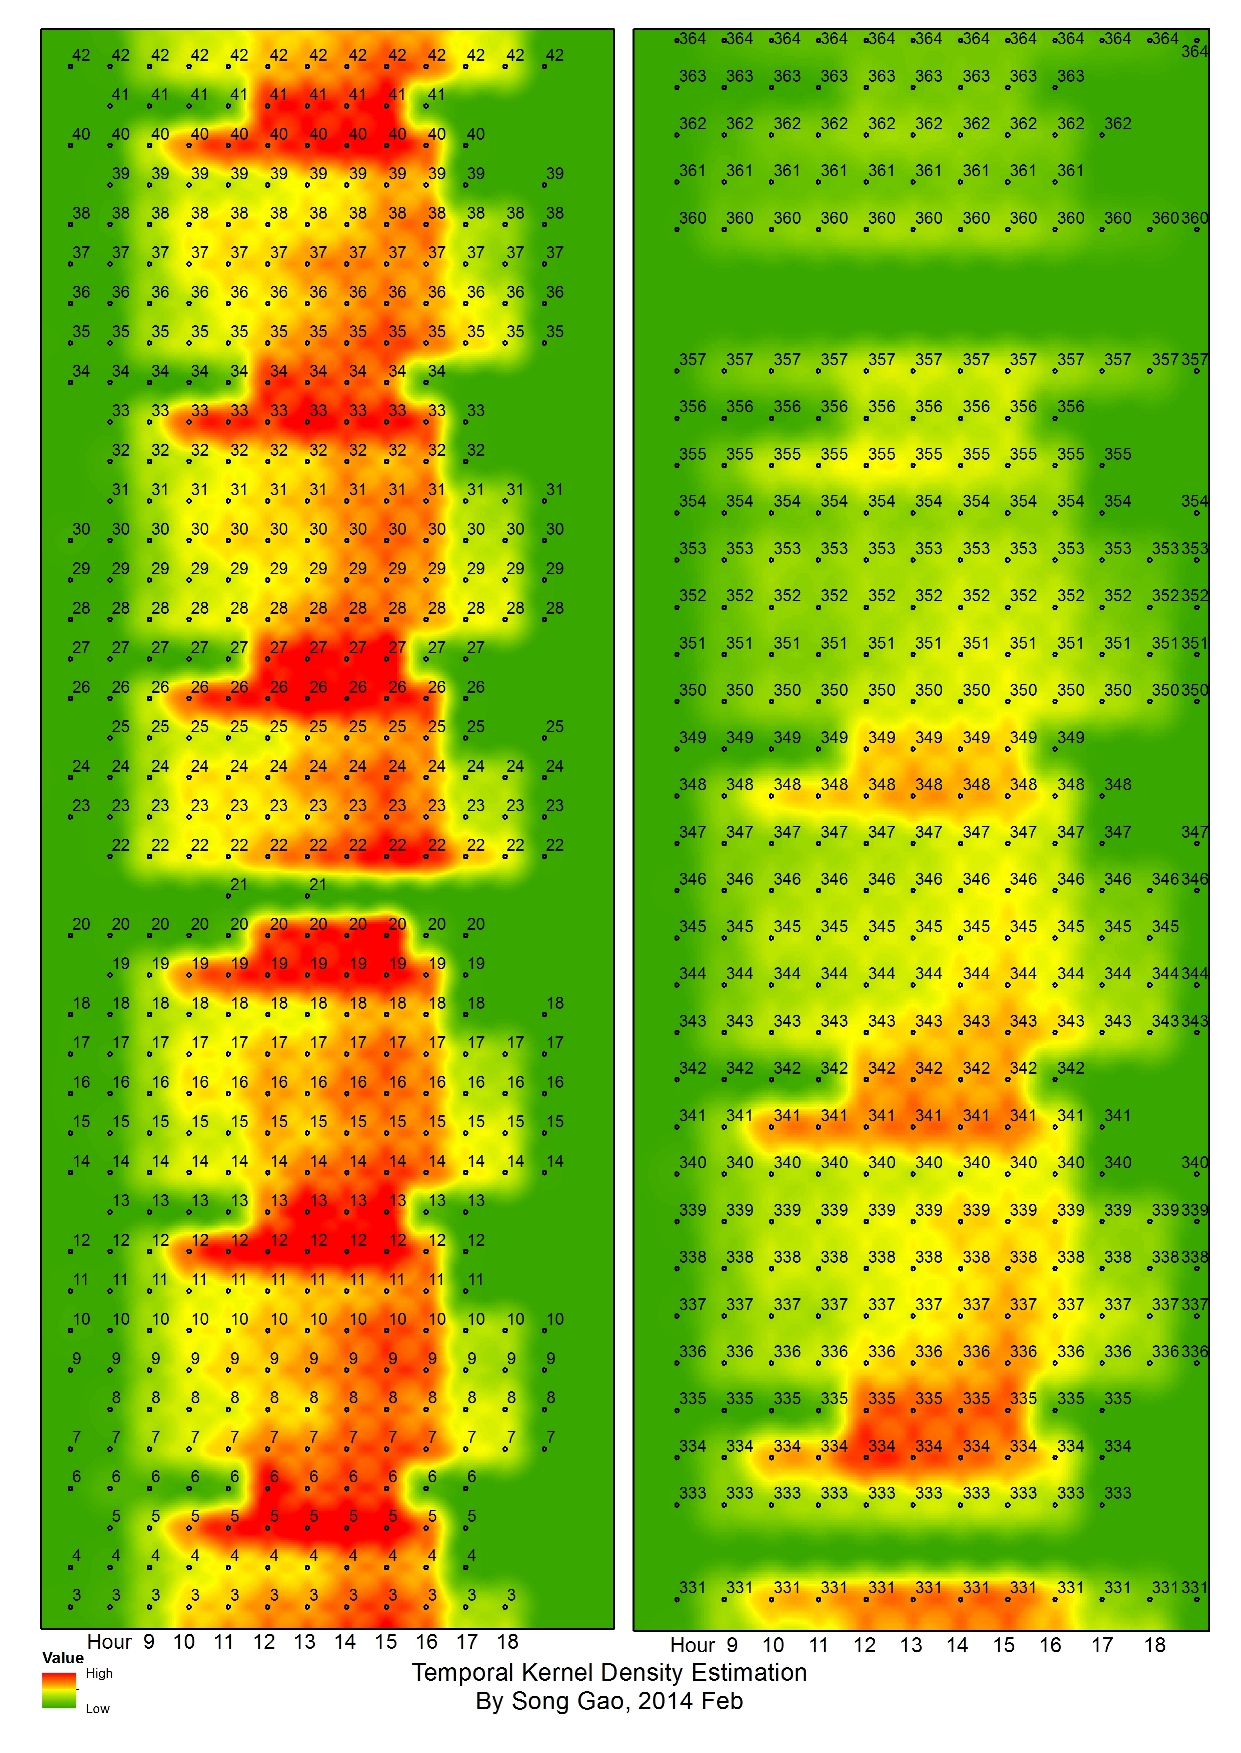
More advanced, I used multivariate-kernel-density-estimation (KDE) approach to find the temporal kernel density patterns between hours and days across months. Basically, the KDE generates a smooth surface of the density of check-outs in a temporal neighborhoods around the selected time grid, and the band width (temporal duration) selection in the calculation affects the results. You can see the different visual results in the temporal-KDE figures (one is [1hour, half-a-day] band width, and the other is [1hour, a-day] band width). It is easy to identify that before the end of this year (during mid-December, day 350~day 364), there are less check-outs compared with the density in January, which has many “red hot-spots” areas. From the hourly perspective, it indicates a higher probability of check-outs between 11AM ~ 5PM.
To know more information about the Kernel Density Estimation if you are interested:
Kernel density estimation
Multivariate kernel density estimation
Downloading