2D Spatial Treemap
MAT 259, 2014
Rob Miller
Introduction
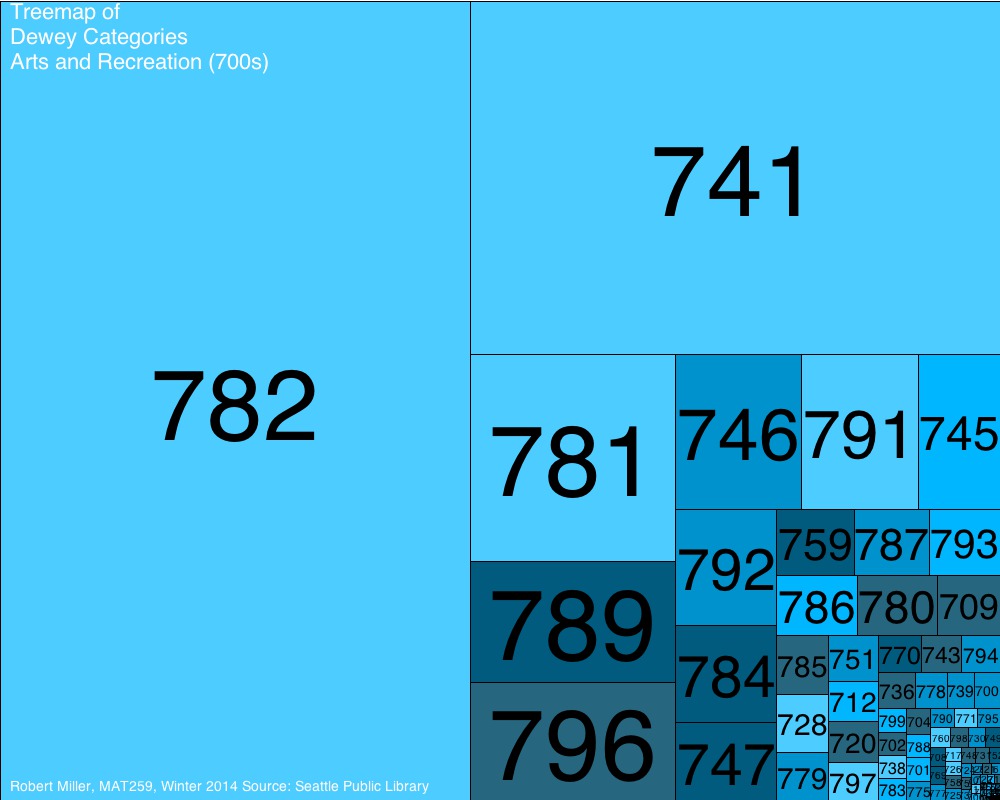
Treemaps utilize the entire allotted space, and they distribute "leaves" economically depending on metrics set by the programmer. Aside from a pure visualization of hierarchical structures, the ability of treemaps to convey more information is augmented by the use of color coding and varying sizes to display additional aspects of the leaves. My treemap shows the popularity of different items within the "Arts and Recreation" dewey class (700s). The larger the leave, the more it appears within the data results, specifically, the more checkouts of an item within a dewey class, the larger that dewey classes' leaf.
Sketch
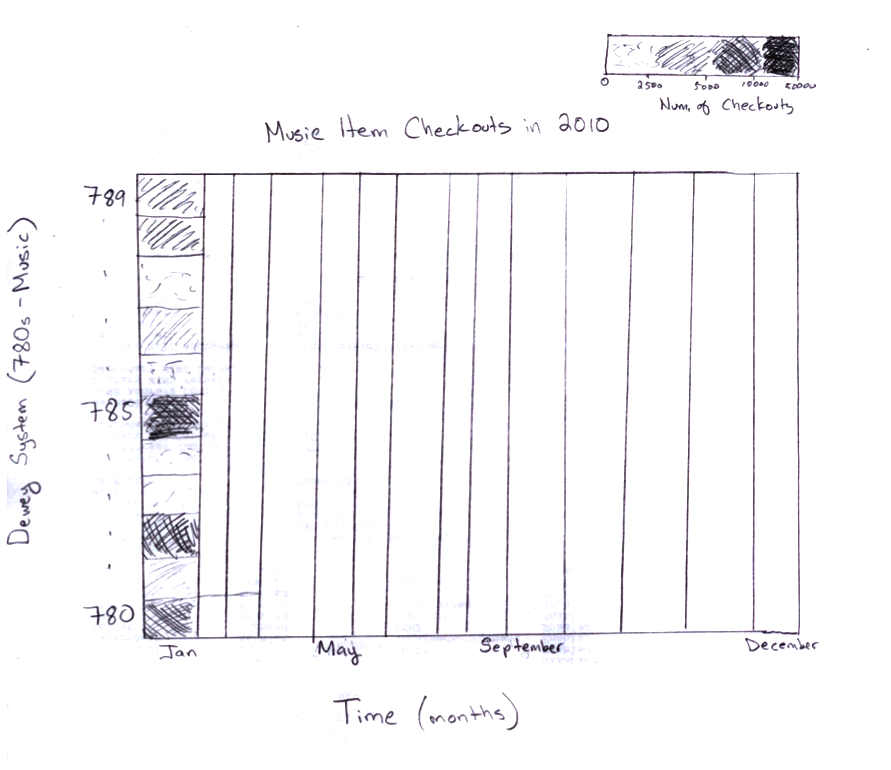
Query
The query retrieves all of the checkouts for the years 2012 and 2013 for all items in the dewey class, "Arts and Recreation."
SELECT YEAR(cout), MONTH(cout), deweyClass WHERE cout >= '2012-01-01' AND cout <= '2013-12-31' AND deweyClass >= 700 AND deweyClass < 800;
(Additional query used for textual data:)
SELECT DISTINCT subject.subject FROM spl2.subject WHERE subject.subject LIKE "% flute %" OR subject.subject LIKE "% clarinet %" OR subject.subject LIKE "% oboe %" OR subject.subject LIKE "%bassoon %" OR subject.subject LIKE "% trumpet %" OR subject.subject LIKE "% horn %" OR subject.subject LIKE "% tuba %" OR subject.subject LIKE "% trombone %" OR subject.subject LIKE "% violin%" OR subject.subject LIKE "% viola %" OR subject.subject LIKE "%cello %" ORDER BY subject.subject;
Program
The processing sketch draws from several sources including code from Ben Fry, Yoon Chung Han, Sandeep Bhat, and Daniel Barben. The user can toggle between different treemaps by pressing a number key between 1 and 5. The sketch reads in data from a csv file and stores it into an array. Next, that data is used to create a map, and then, using Ben Fry's treemap algorithm, which is based on the treemap algorithms of Ben Bederson and Martin Wattenberg (University of Maryland). The values are hashed and organized according to the frequency in which they appear. The size of the leaves represent the frequency of appearances. The color represents the relative time period where a lighter shade is an earlier time and a darker shade is the most recent date.
Results and Analysis
The treemap makes it very easy to quickly see the most popular dewey classes. In this case, the Vocal Music section (782) was most popular. The arrangement of the leaves appear to be in a Fibonacci-like sequence, emanating from the bottom right-hand corner. Unfortunately, it is quite difficult to see the less popular items, and the items with zero checkouts because of the arrangement of the tree. Allowing for more interactivity, i.e., moving the cursor over different data to create a pop-up window, could improve the readability of the treemap. Yet, the treemap is very efficient in terms of gathering a quick view of the most populous items.
Code
I used Processing.
The Treemap class comes from Ben Fry's book, ""Visualizing Data: Exploring and Explaining Data with the Processing Environment"
Source Code
The Treemap class comes from Ben Fry's book, ""Visualizing Data: Exploring and Explaining Data with the Processing Environment"
Source Code
Control
Press 1-4 for different tree mappings