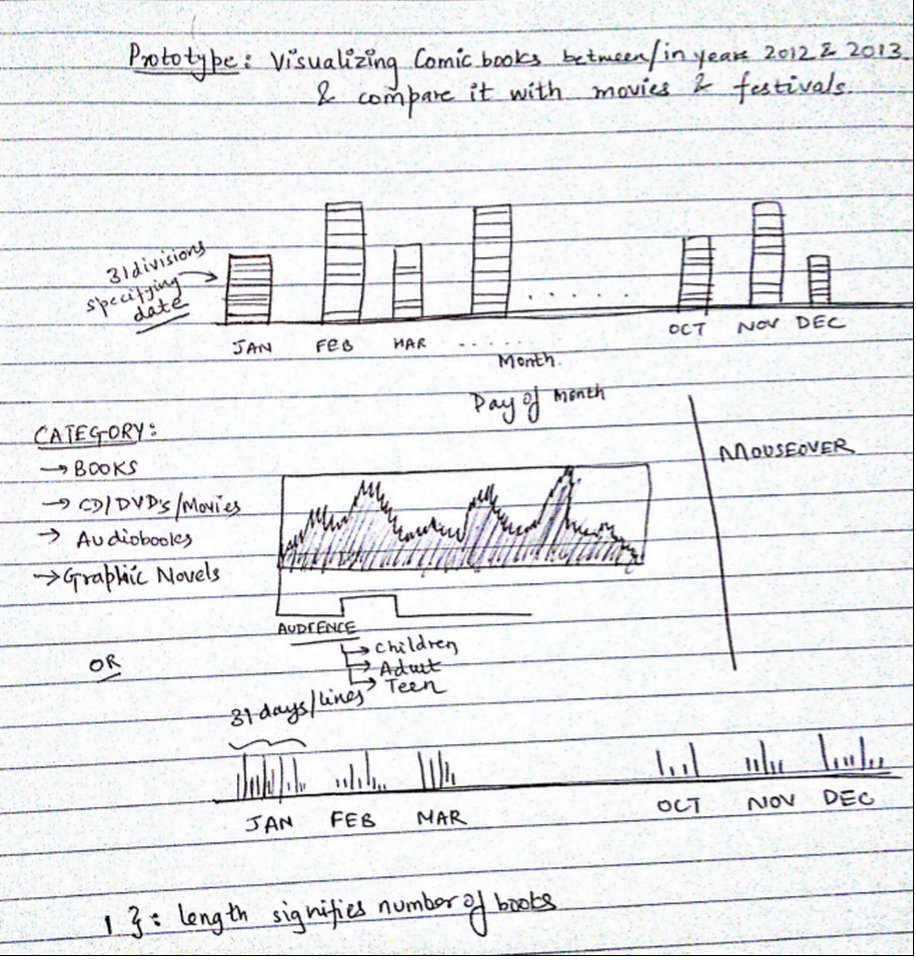
(1) Doodle for 2D visualization
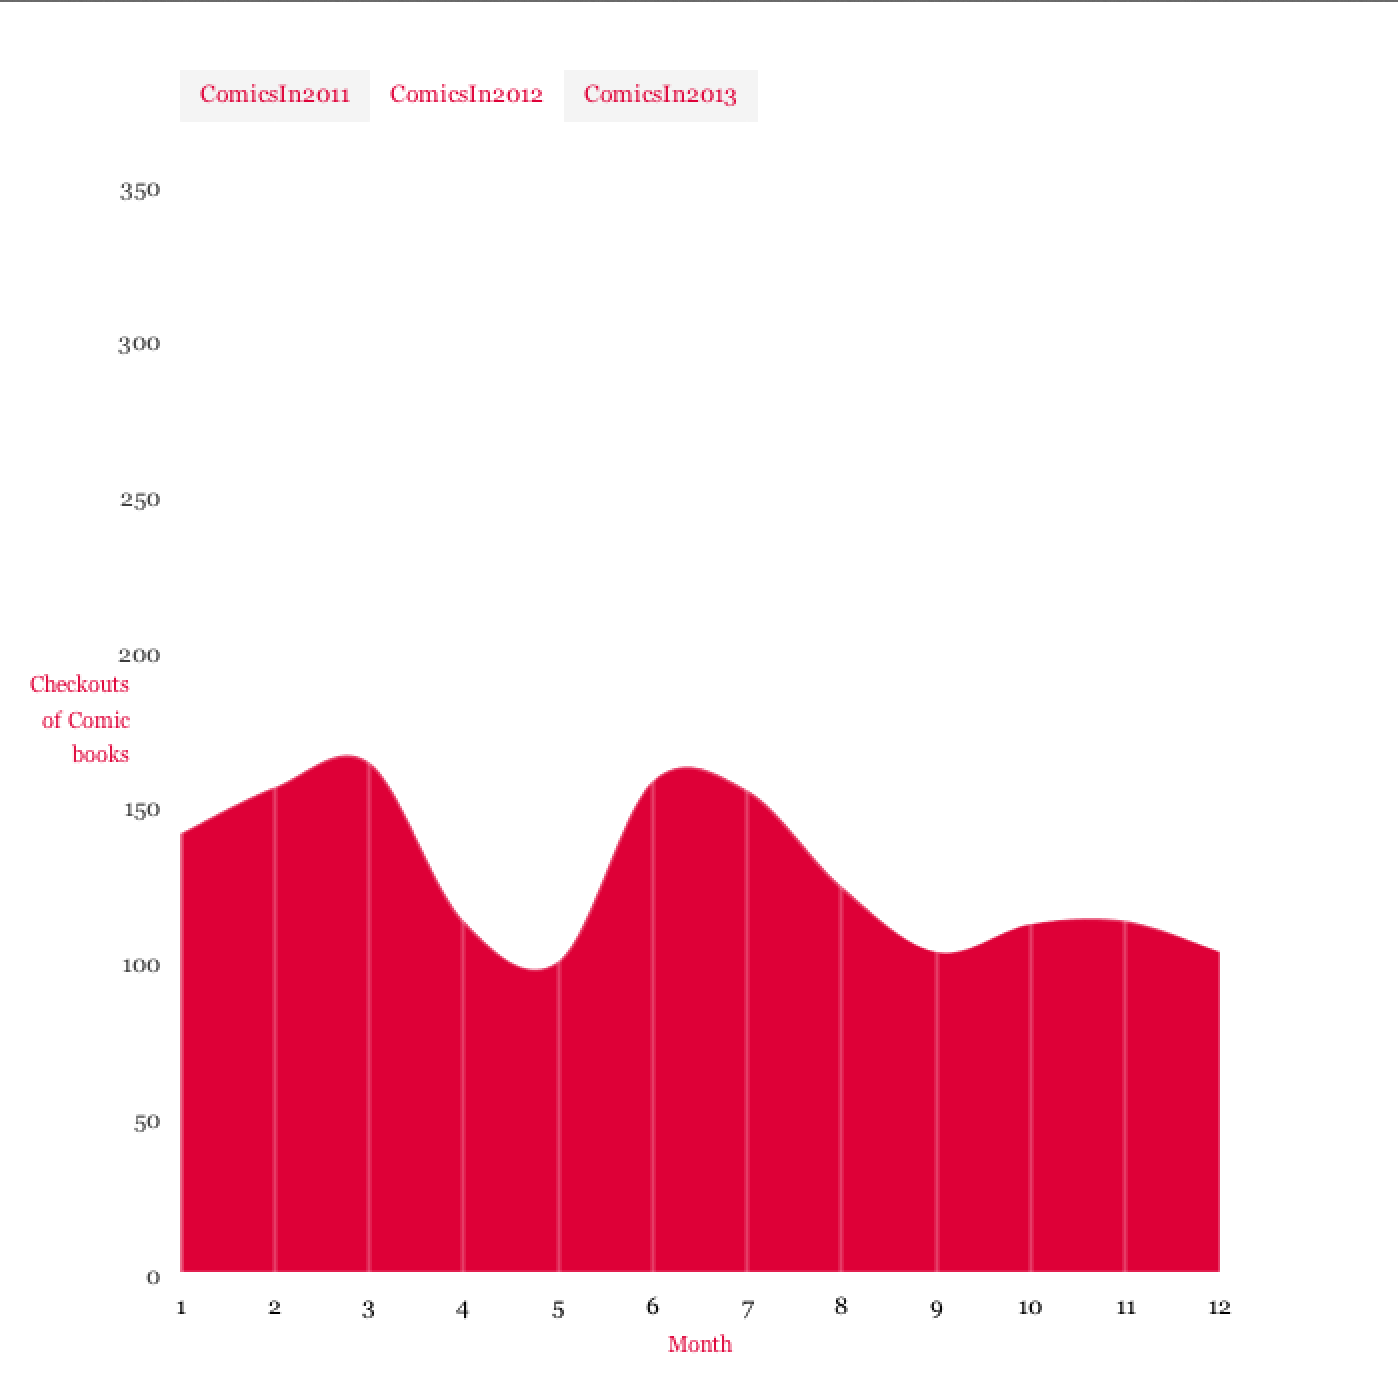
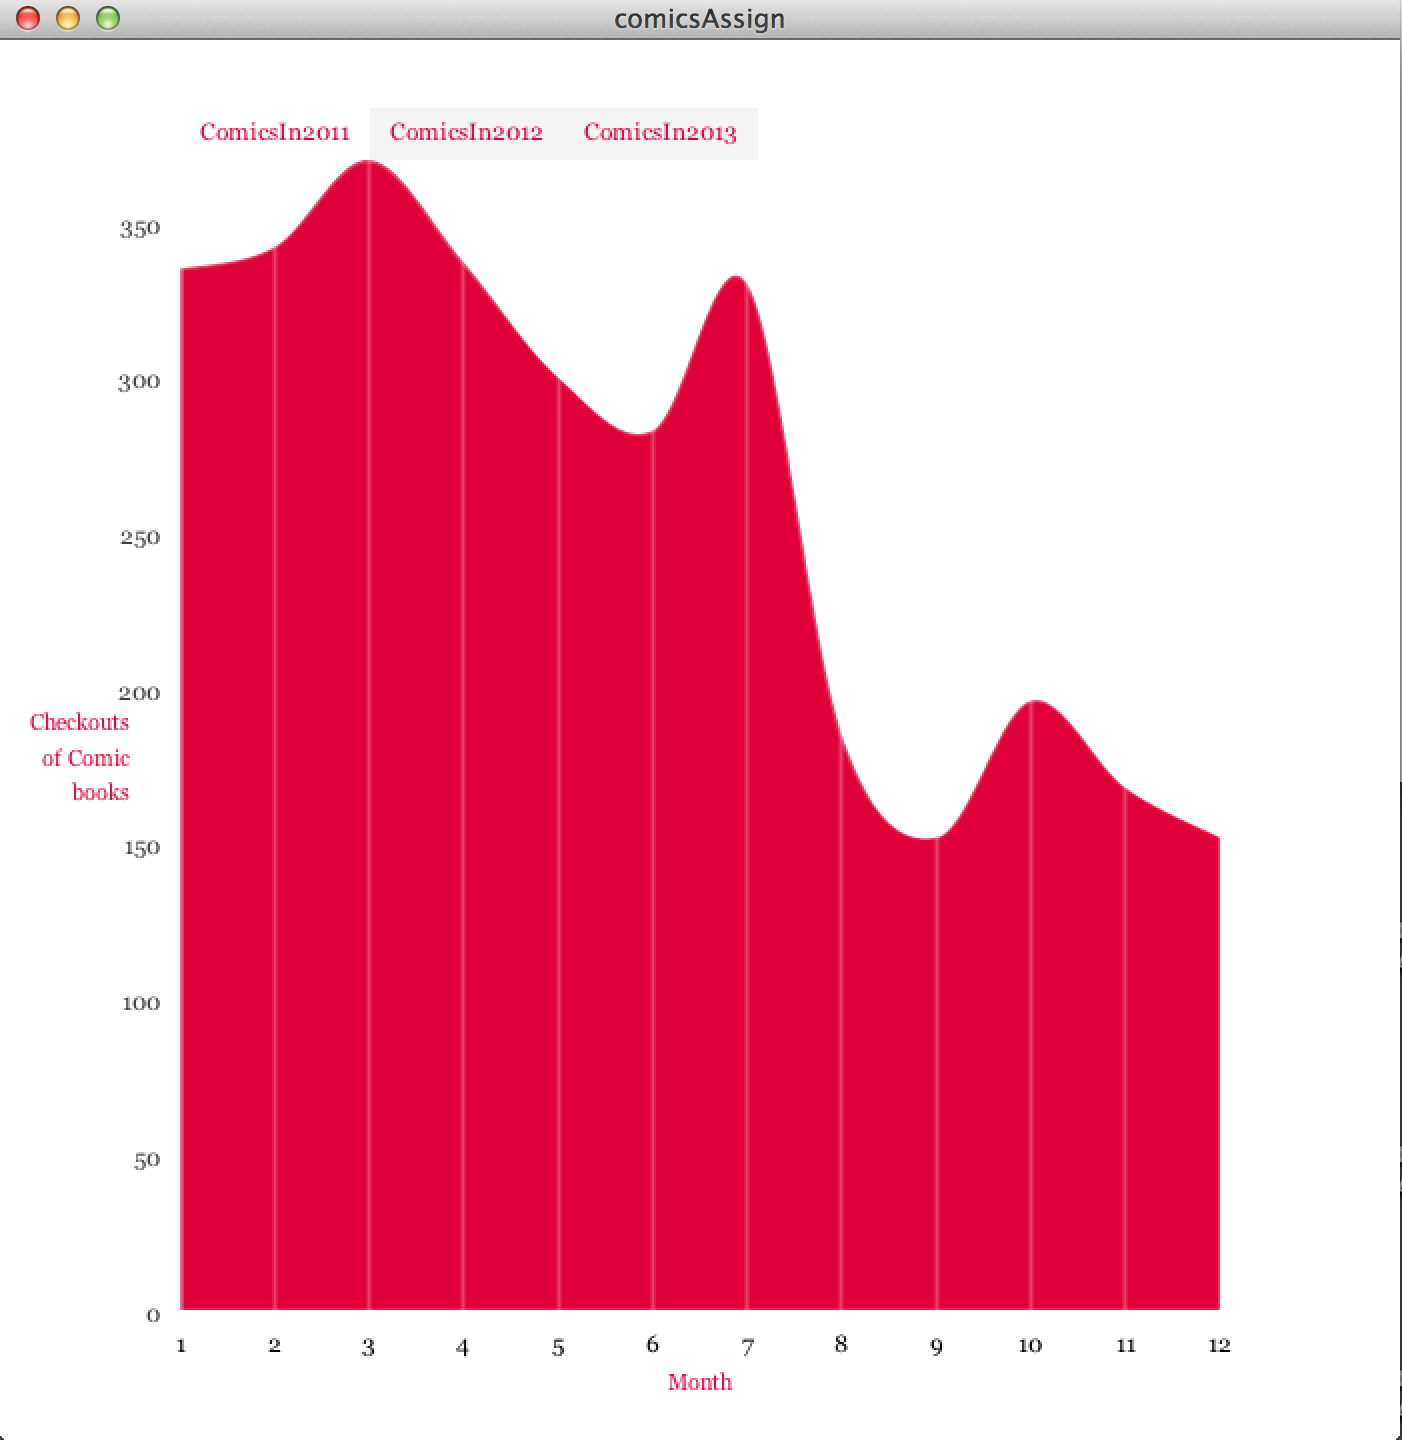
This visualization goes for the minimal approach where each month data
is associated with the number of checkouts/counts for the past 3 years..
As can be seen in this doodle, I designed to show the histogram of checkouts in the form of a series of series of lines and curveVertices to create a smooth flowing curve
SELECT month(cout) as month, sum(case when year(cout) = '2011' then 1 else 0 end) as ComicsIn2011, sum(case when year(cout) = '2012' then 1 else 0 end) as ComicsIn2012, sum(case when year(cout) = '2013' then 1 else 0 end) as ComicsIn2013 from spl2.inraw where (deweyClass = '741.5' OR deweyClass = '791.4') group by month(cout);
//books and dvd/cd’s with deweyClass 741.5 and 791.4(for dvd)
query1 -> SELECT distinct title,count(*) from spl2.inraw where deweyClass = '741.5' OR deweyClass = '791.4' AND date(cout)>'2012-01-01' AND date(cout)<'2013-12-30';
Processing Time: 0.7 sec

//since the comic-con festival in the last 2 year have been in March-April
//2012
query2 -> SELECT distinct title,count(*), month(cout) as month from spl2.inraw where deweyClass = '741.5' OR deweyClass = '791.4' AND date(cout)>'2012-02-01' AND date(cout)<'2012-05-01' GROUP by year(cout) ORDER by month(cout) asc;
Processing Time: 0.09 sec

//seeing only in months march and april
query3 -> SELECT distinct title,count(*), month(cout) as month from spl2.inraw where month(cout) = ‘3’  or month(cout) = ‘4’ AND deweyClass = '741.5' OR deweyClass = '791.4' AND date(cout)>'2012-02-01' AND date(cout)<'2012-05-01' GROUP by year(cout) ORDER by month(cout) asc;

//2013
query4 -> SELECT distinct title AS Title from spl2.inraw where deweyClass = '741.5' OR deweyClass = '791.4' AND date(cout)>'2013-02-01' AND date(cout)<'2013-05-01' AND SUM(CASE WHEN itemtype ='accd' THEN 1 ELSE 0 END) CD,
SUM(CASE WHEN itemtype ='acdvd' THEN 1 ELSE 0 END) DVD;

query5 -> SELECT title, subj as subject, itemtype from spl2.inraw where title like “%comic%”deweyClass = '741.5' OR deweyClass = '791.4' AND date(cout)>'2012-01-01' AND date(cout)<'2013-12-30';
Processing Time : 59.55 sec

query6 -> SELECT distinct title, itemtype from spl2.inraw where deweyClass = '741.5' OR deweyClass = '791.4' OR title like “%comics%” AND date(cout)>'2012-01-01' AND date(cout)<'2013-12-30';
Query results: query1 -> 311 results obtained query2 -> 2700 results query3 -> 300 result query4, query5 and query 6 had 2700 results
Overall this project really pushed my designing abilities, which were very minimal at the beginning. I explored methods for coloring data and representing layers of meaning within a 3D space through an interesting data set.
As expected, tt clearly relates to comic-con festival which happens in March every year, and hence a surge in comic books and other movies. What more intersting is this small rise in July every year(due to unknown reason) as well, which indicates another spike or attraction to comics books.
c/x : change to different palette (0 to 10)
l : stroke on / off
d : dewey particles
p : pyramids on / off (checkouts in each year below the disk)
5: Change year 2
6: Change month