2D Spatial Map
MAT 259, 2014
Lakshman Nataraj
Introduction
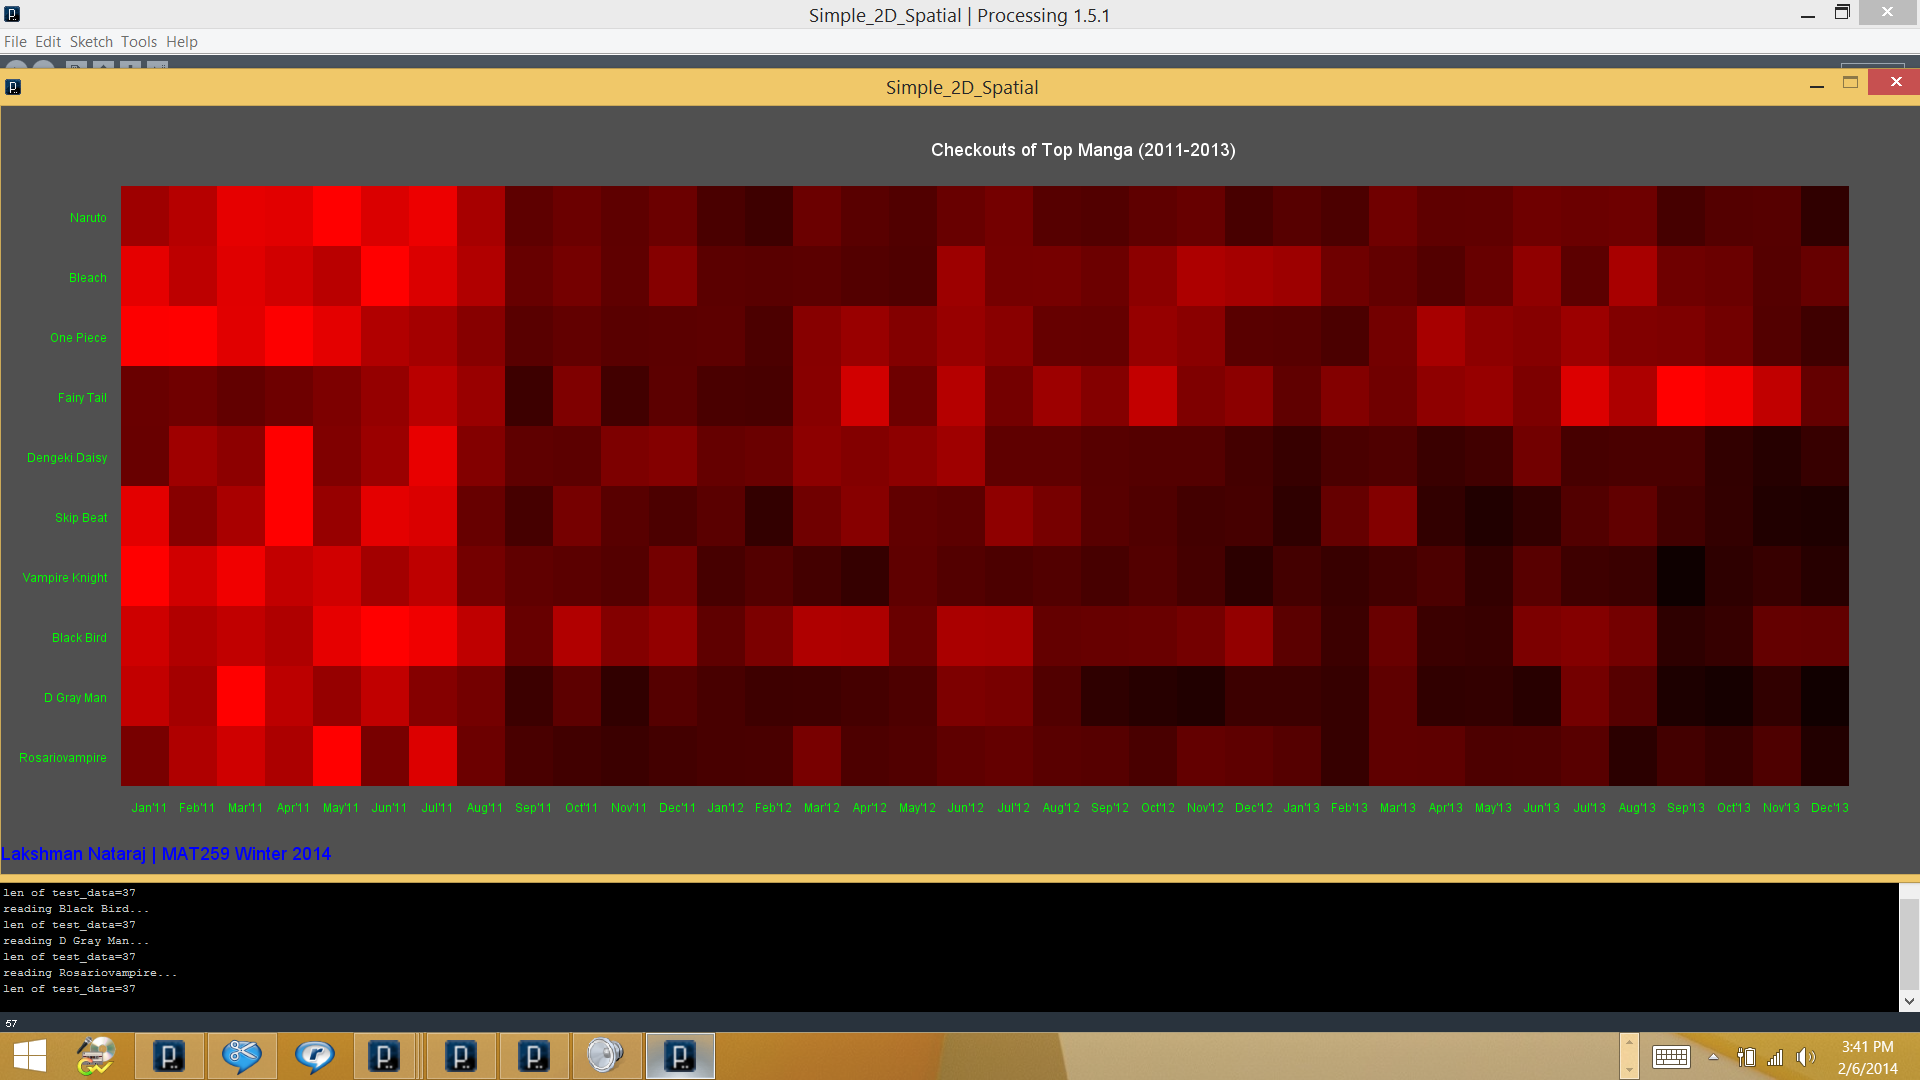
In this assignment, I plan to analyze the checkouts for some of the top 10 manga and visualize them in a 2D spatial map. Specifically, I'm interested in observing the trend for every month from 2011-2013 (3 years, 12 months). For every manga, I would end up with a 1-D array of length 36 (12 times 3) and for 10 manga, a 2-D array of width 36 and height 10 (10x36).
The top 20 manga I obtained from the website mangapanda.com is shown below:
1. Naruto
2. Bleach
3. One Piece
4. Fairy Tail
5. Dengeki Daisy
6. Skip Beat
7. Vampire Knight
8. Black Bird
9. Soul Eater
10.Rosario-Vampire
Challenge:
Names like Bleach, One Piece and other common names, the queries are often not comics. So I had to first go and check the dewey classes for the comics. It seems the deweyClass for all comics is 741.5952. A count of all checkouts for this deweyClass got me a total of 934,610 (almost 1 Million!) entries. However, since I'm only interested in some specific manga, I modified the query with the exact deweyClass.
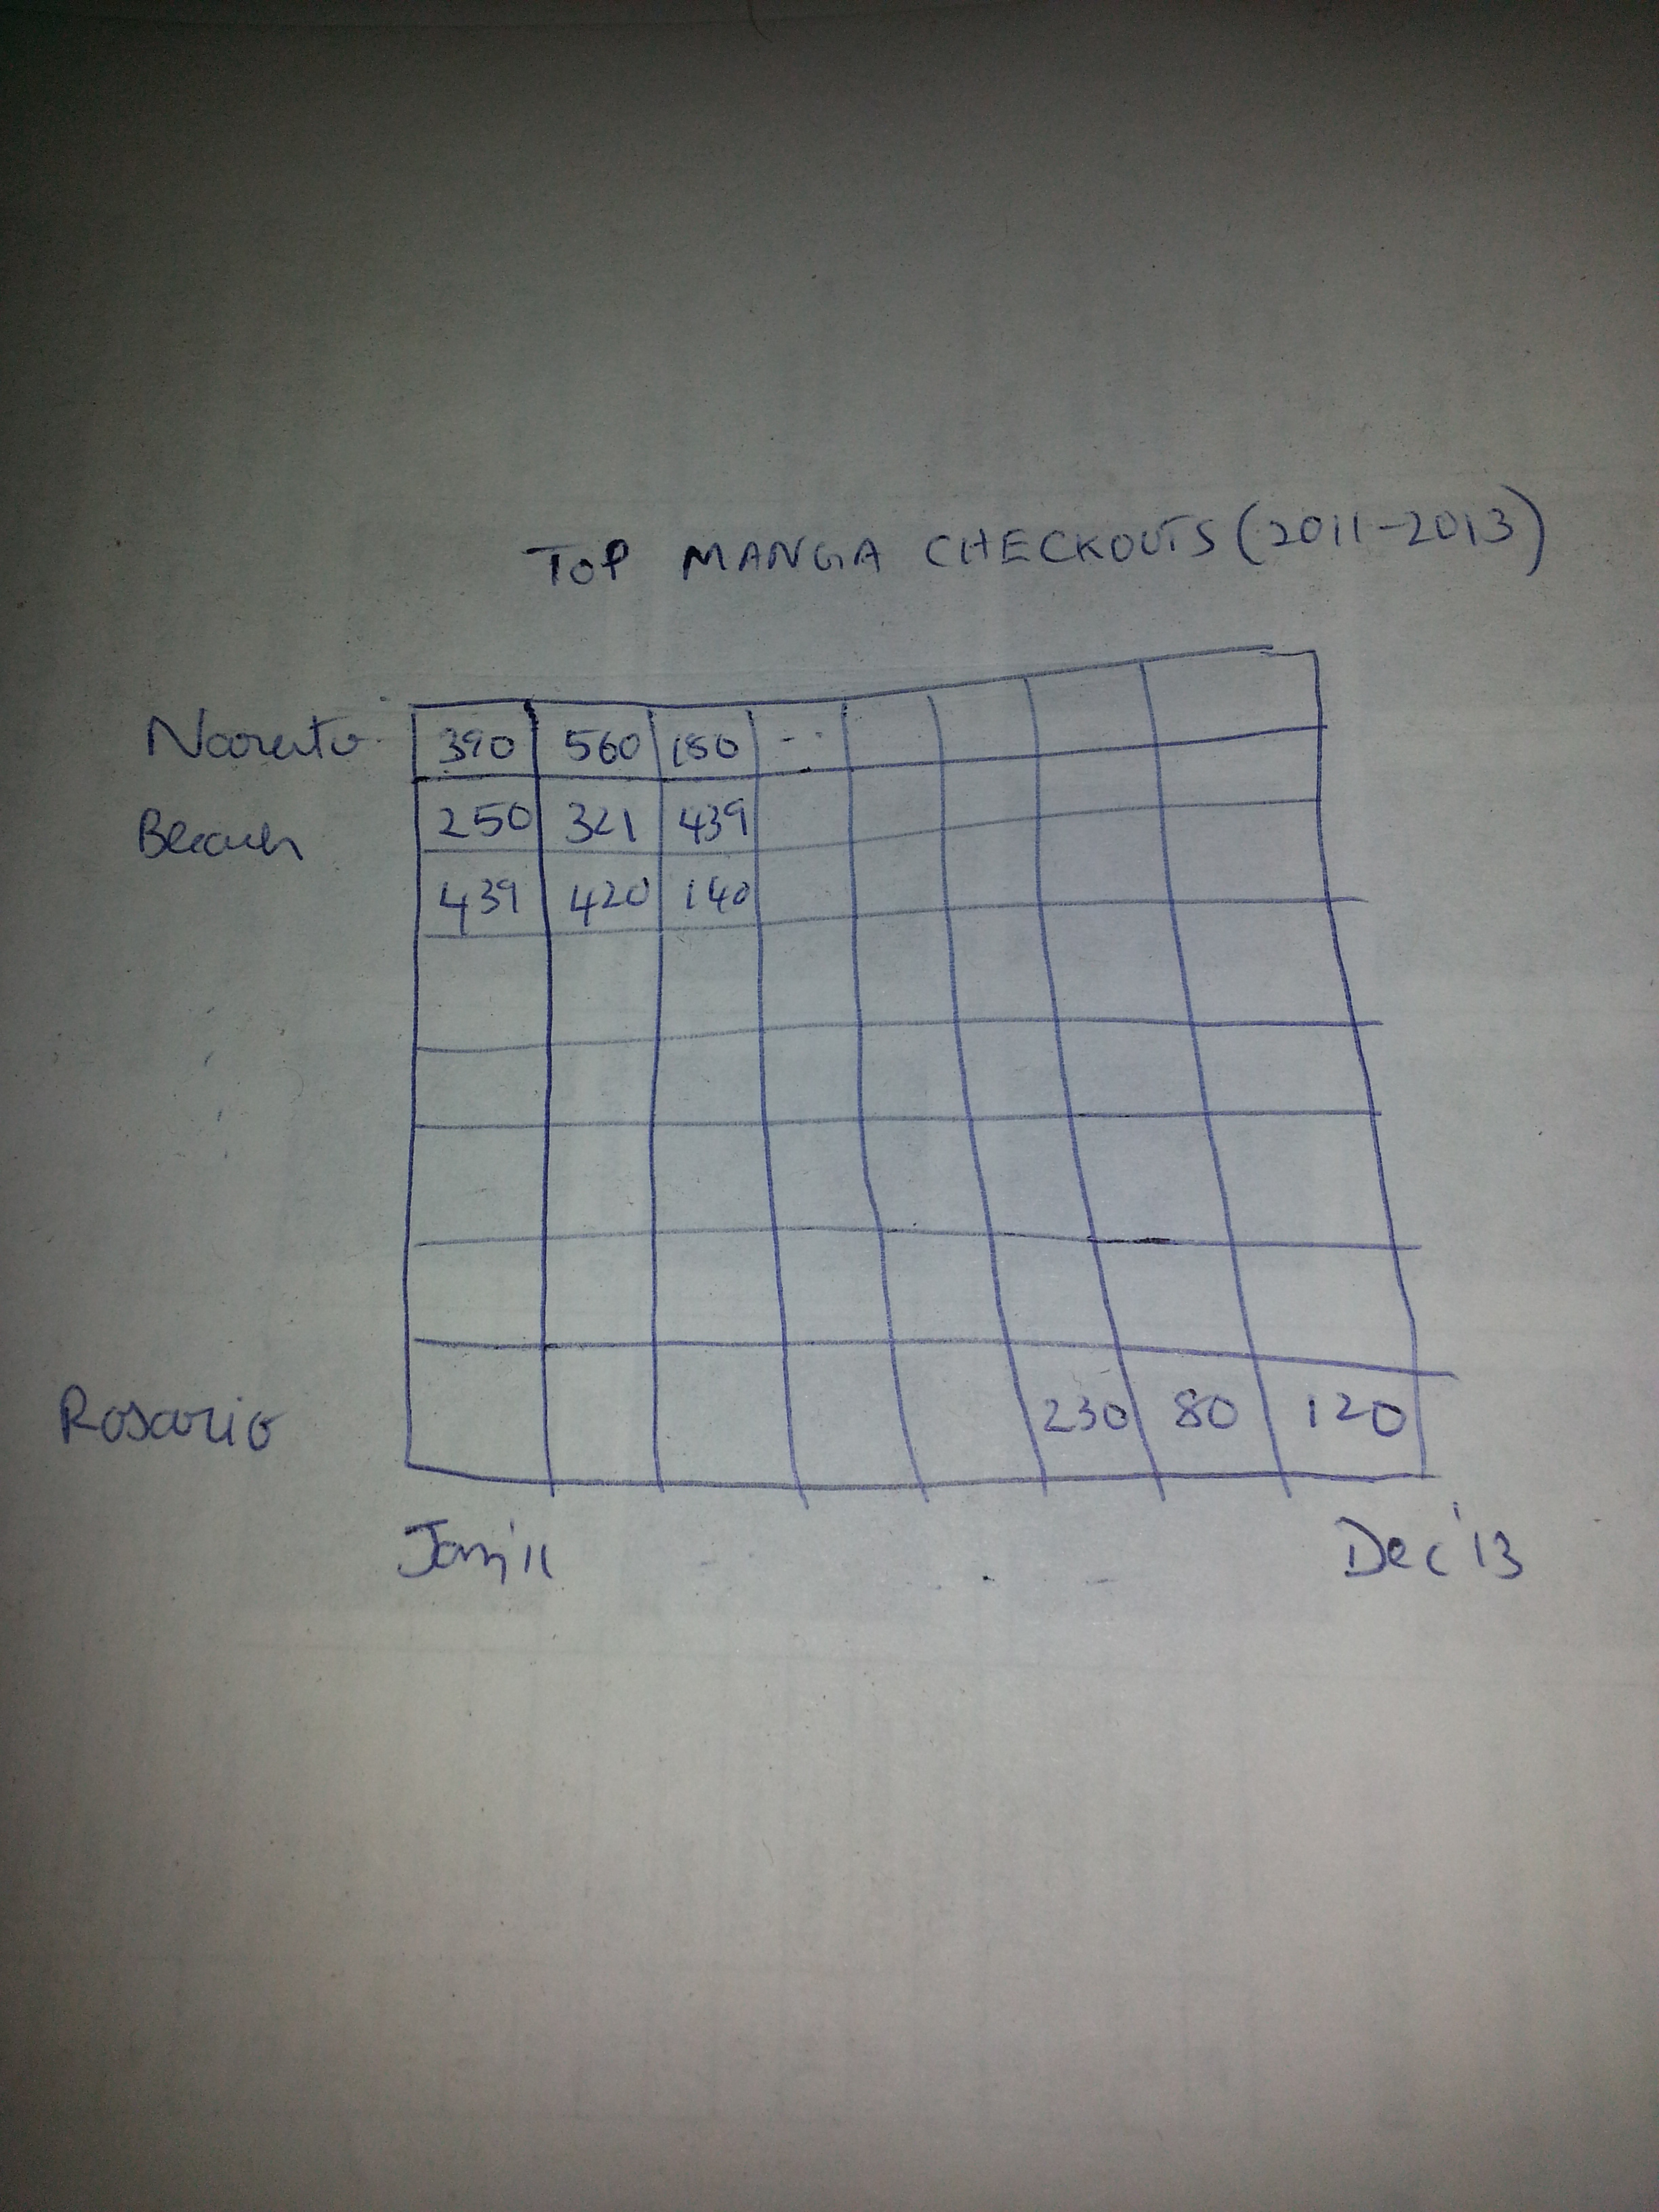
Background and Sketches
Doodle
SELECT year(cout),month(cout),count(*) FROM spl2.inraw
where (title like "%rosario%" and itemtype="acbk")
and (year(cout)>="2011" and year(cout)<"2014")
and deweyClass = "741.5952"
group by year(cout),month(cout)
limit 0,1000000;
Query
A sample query that returns 36 values from Jan 2011 to Dec 2013: SELECT year(cout),month(cout),count(*) FROM spl2.inraw
where (title like "%rosario%" and itemtype="acbk")
and (year(cout)>="2011" and year(cout)<"2014")
and deweyClass = "741.5952"
group by year(cout),month(cout)
limit 0,1000000;
Final Visualization
.
Code
Control
Press 1 for different normalization