Daily check-out variance in the Dewey Decimal System
MAT 259, 2014
Grant McKenzie
Introduction
A "signature" does not only apply to the human autograph, but also applies to data and human
behavior. For example the "check-out" history of a specific book could be used to describe the
book. Rather than individual books, I plan to explore the "check-out signatures" of specific
classes of material in the Seattle Public Library. I believe that certain classes of material have
more similar check-out signatures than others and a visualization of this data would be quite
informative. For example patrons of the library may checkout books related to Fishing and
Cooking at similar times which show signatures very different than books related to Ice Hockey.
Background and Sketches
The foundation of this assignment will be the Dewey Decimal Class system.
The 3 digit base
code (before the decimal place was extracted producing a total of 1000 possible Dewey Classes.
In reality the Seattle Public Library system only contains items tagged with one of 915 Dewey
Classes 1 . For each of these 915 Dewey Classes, an array of check-out times was extracted
aggregated by the hour of the day. Normalizing this data produced an array with 12 entities (12
open hours of the library) that sums to 1 for each of the Dewey Classes. The hours were then
grouped in to "perceived parts of the day." The hours between 8a-11a where classified as
Morning, 11a-3p as Afternoon and 3p-7p as Evening. Summing the normalized "check-out"
counts across these groups and multiplying the number (bounded by 0 and 1) by 255 produced
three distinct values for each of the Dewey Classes; values that were represented Red, Green and
Blue in an RGB color pallet.
Additionally, a CSV file 2 containing the numeric Dewey Decimal value along with it's "Name" property were downloaded since numeric values are often hard to interpret. This was used to describe (label) the rectangles in the final visualization.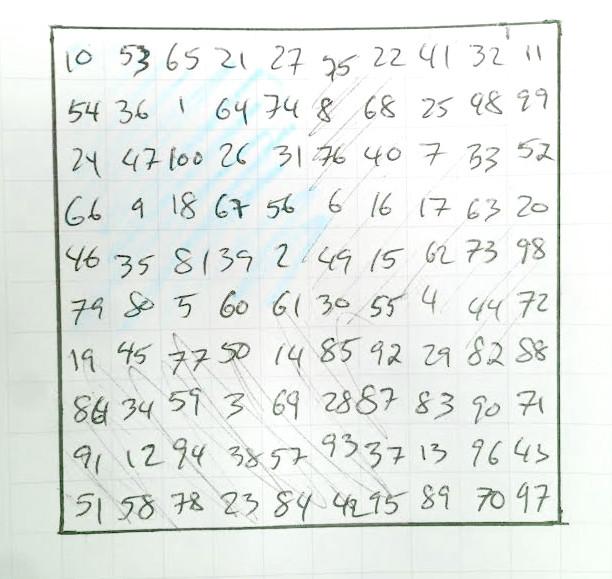
Additionally, a CSV file 2 containing the numeric Dewey Decimal value along with it's "Name" property were downloaded since numeric values are often hard to interpret. This was used to describe (label) the rectangles in the final visualization.
Query
Find out the real number of distinct Dewey Classes in the SPL2 "outraw" dataset:
SELECT count(distinct substring(deweyClass,1,3)) from spl2.outraw;
Aggregate the count of check-outs from "outraw" by the Dewey Class and the Hour of the day:
SELECT substring(deweyClass,1,3) as ddc, hour(cout) as hr, count(*)
as count_hr
FROM spl2.outraw
WHERE deweyClass <> ''
GROUP BY ddc, hr
ORDER BY ddc, hr;
Design Decisions
Originally, I wanted to use a Self Organizing Map approach to this assignment (Figure 1).
Unfortunately time and the complexity got the best of me so I took a more standard approach
which allowed me to show all of the Dewey Classes in the SPL dataset rather than just a subset of
100. By temporally clustering the item check-outs in to Morning, Noon and Evening, I was able to
describe each of the Dewey Classes by 3 numerical values (between 0 and 1). Multiplying these
values by 255 allowed the Dewey Classes to be represented on a RGB color scale. For example, a
high proportion of "check-outs" in the morning returns a color value high in RED and lower in
others.
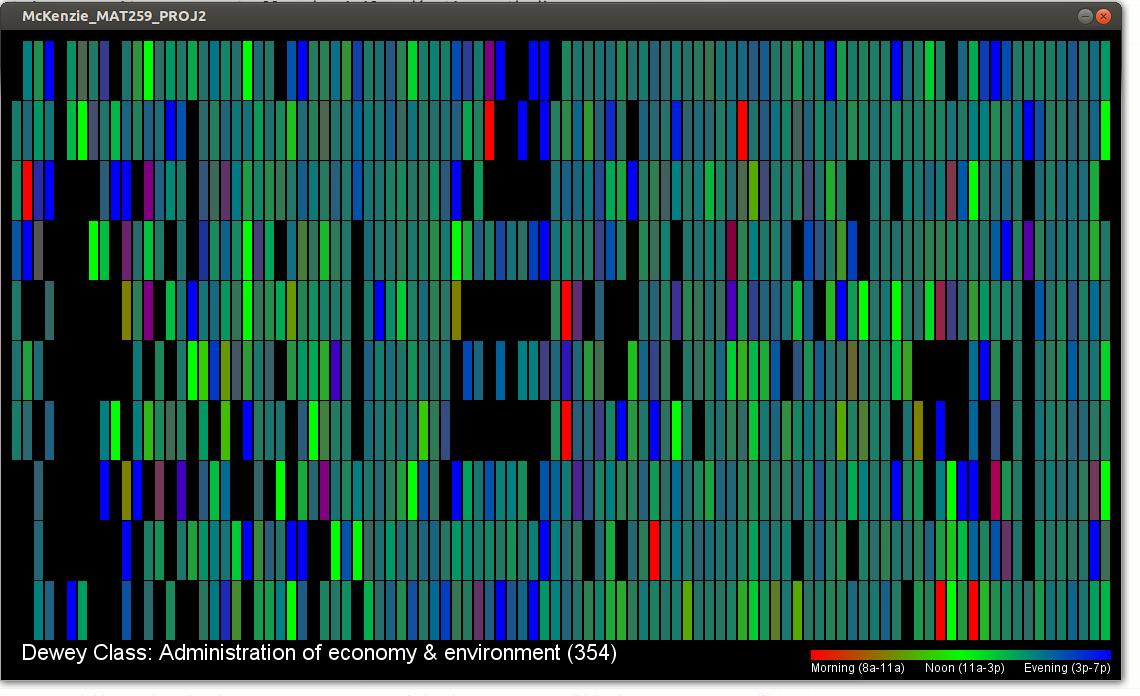
I plotted out the Dewey Classes in rectangles (10px by 60px) and organized them by rows and columns. Each column represents a "section" of the Dewey Class System and each section contains up to 10 classes. The difficulty with showing 915 classes is that labeling is an issue. While I do feel it is important to first look at the visualization without any labels (to really appreciate the artistic side of the data), I decided to add a "mouse over" label that states the name and number of each Dewey Class as you move around the visualization. Lastly, I also included a legend to describe what the colors represent (shown in the bottom right corner of the visualization (Figure 2).
I plotted out the Dewey Classes in rectangles (10px by 60px) and organized them by rows and columns. Each column represents a "section" of the Dewey Class System and each section contains up to 10 classes. The difficulty with showing 915 classes is that labeling is an issue. While I do feel it is important to first look at the visualization without any labels (to really appreciate the artistic side of the data), I decided to add a "mouse over" label that states the name and number of each Dewey Class as you move around the visualization. Lastly, I also included a legend to describe what the colors represent (shown in the bottom right corner of the visualization (Figure 2).
Results
Code