Three-Dimensional Interactive Project
MAT 259, 2013
Yeu-Shuan Tang
Introduction
The purpose of this project is to show the correlation between popular items and dewey. To see how top 30 popular items locate in dewey categories, I plot the checkout amount of each item by month during 2006-2011.
Sketches
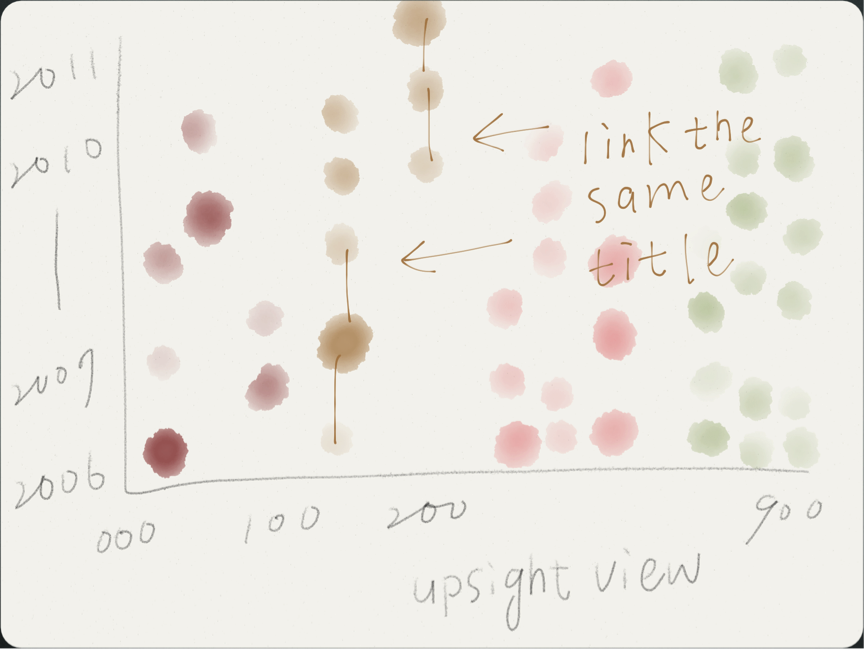
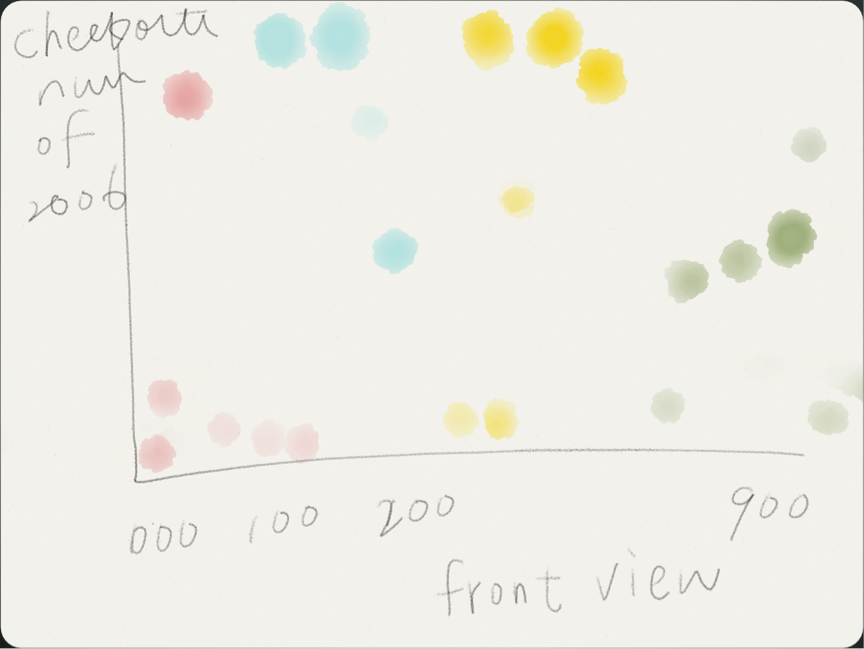
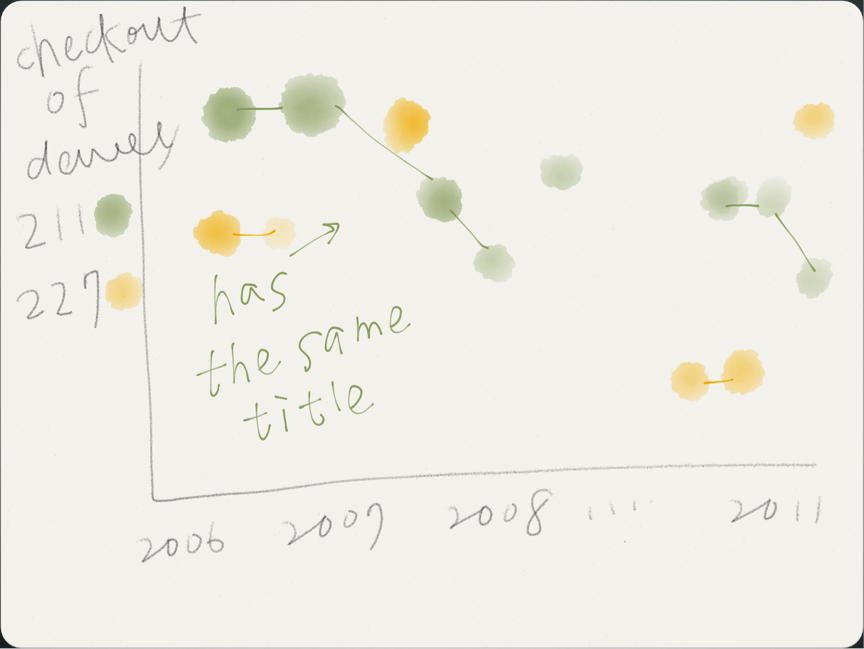
Query
select
month(o), dewey, count(*),title ,kind
from
kind,
activity,
title,
dewey
where
dewey >0
and dewey.bib = activity.bib
and kind.item = activity.item
and title.bib = activity.bib
and month(o) = 1
and year(o) = 2008
group by title
order by month(o) , count(*) DESC limit 30 ;
Query Explanation
First, I query the top popular 30 items from Seattle Public Library once a month, and then save all seventy-two months in five data files: month, kind, title, dewey, and count. In Processing, I just read those files, and analyze them first in setup function .
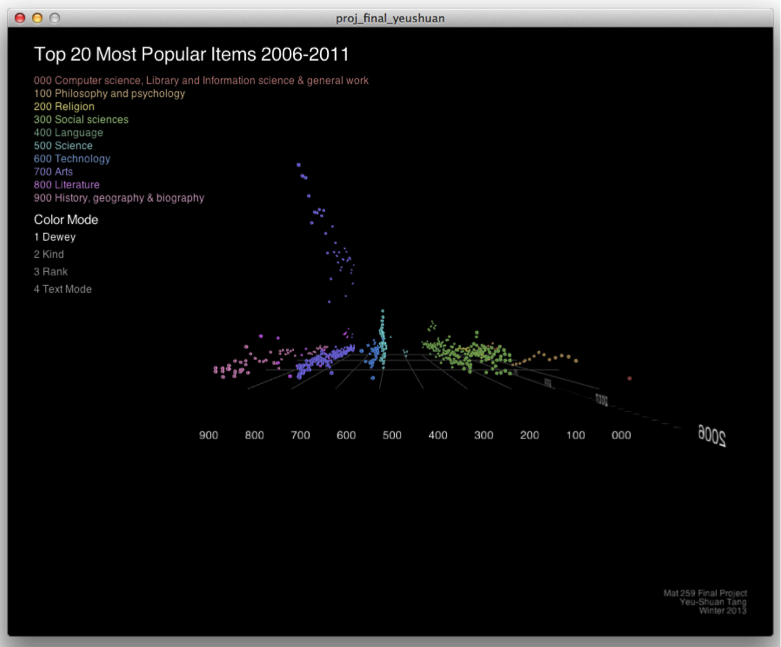
Results and Analysis
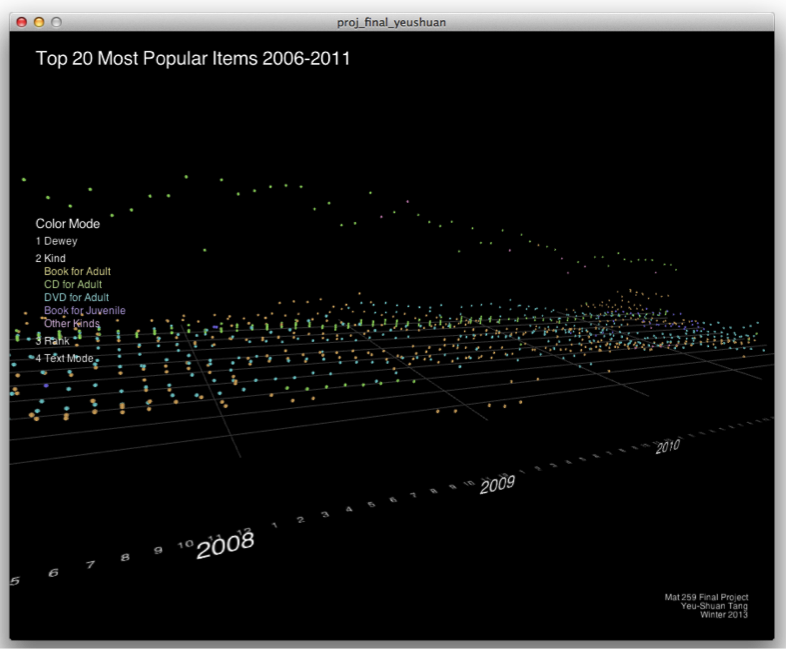
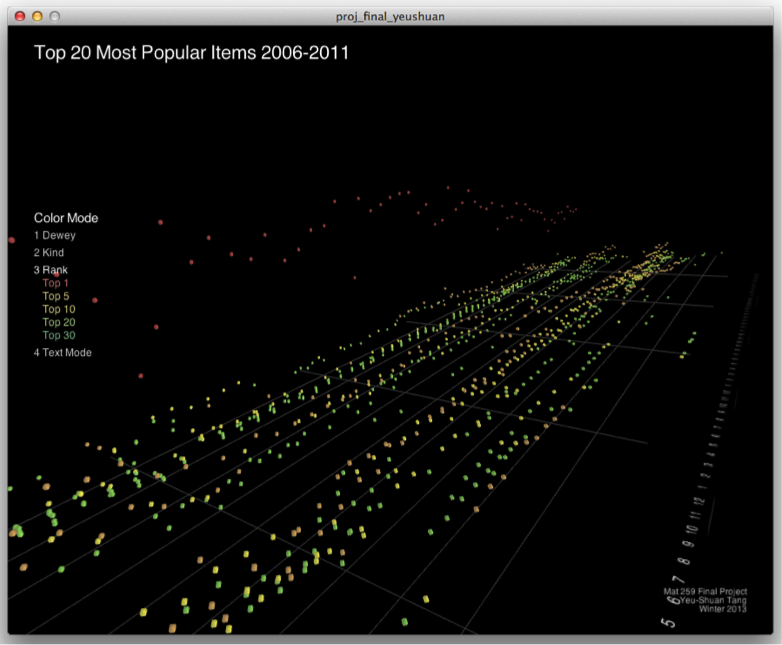
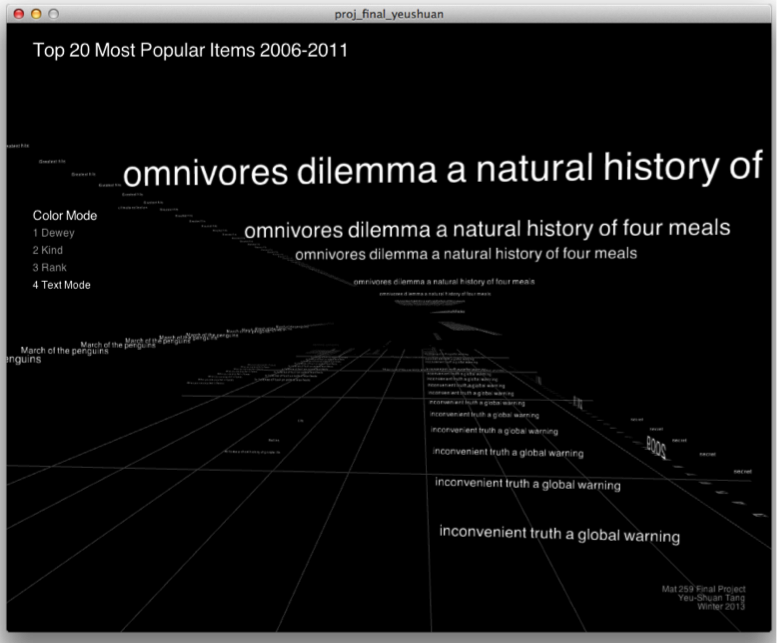
There are four different mode of this program. The height of each sphere represents the checkout number, and spheres are plot in different months and dewey numbers. I changed some sphere details and also frame rate in order to speed up the program.
First mode is colored by different dewey numbers. As you can see, the most popular items are around dewey number “700.”
Code
Control
Color Mode
1: Dewey
2: kind
3: Rank
4: Text Mode
1: Dewey
2: kind
3: Rank
4: Text Mode