Three-Dimensional Interactive Project
MAT 259, 2013
Scott Bcesar
Introduction
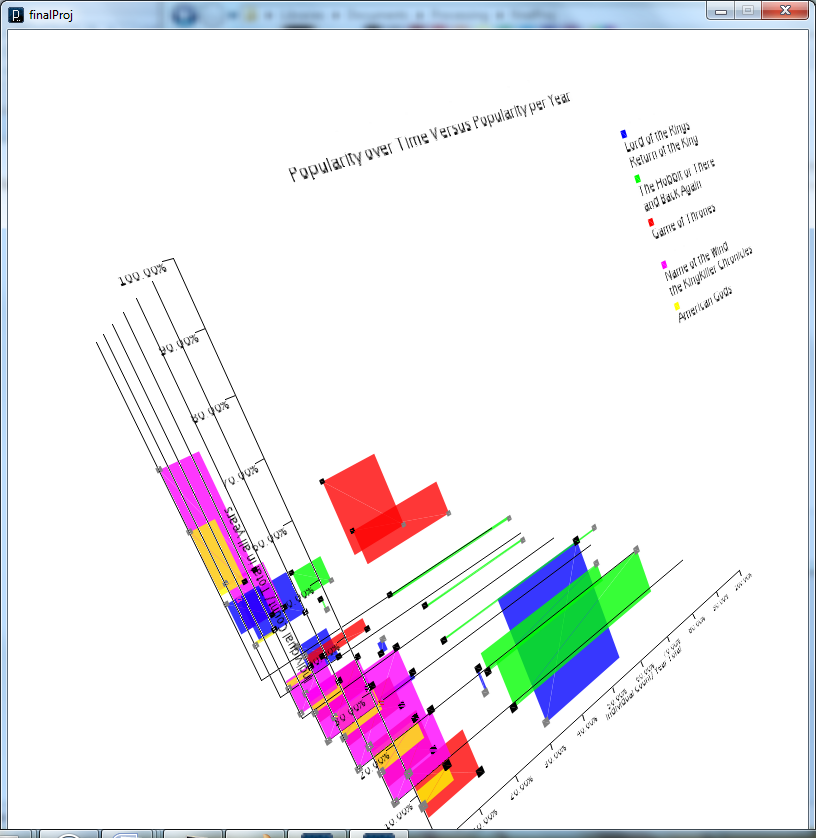
I wanted to extend my 2d comparative visualization, so I started by converting from averaging the 2 sets to defining the rectangle which bounds the two sets, then plotting those along the z axis. This qudrangle view I hoped would make the data presented in my first comperative 2d visulization more clear and easy to follow.
Query
select
count(*) as count,
sum(case when (title = "lord of the rings return of the king") then 1 else 0 end) as lotrrotk,
sum(case when (title = "hobbit or There and back again") then 1 else 0 end) as hobbit,
sum(case when (title = "game of thrones") then 1 else 0 end) as got,
sum(case when (title = "name of the wind the kingkiller chronicle day 01") then 1 else 0 end) as notw,
sum(case when (title = "american gods") then 1 else 0 end) as ag,
year(o) as years,
month(o) as months
from
title inner join activity on activity.bib=title.bib inner join collection on activity.item=collection.item
where
(title= "lord of the rings return of the king"
or title = "hobbit or There and back again"
or title = "game of thrones"
or title = "name of the wind the kingkiller chronicle day 01"
or title = "american gods")
and year(o)>=2006
group by
YEAR(o), MONTH(o) ASC
limit
100
Results and Analysis
Code
Control