Three-Dimensional Interactive Project
MAT 259, 2013
Ramon Rovirosa
Introduction
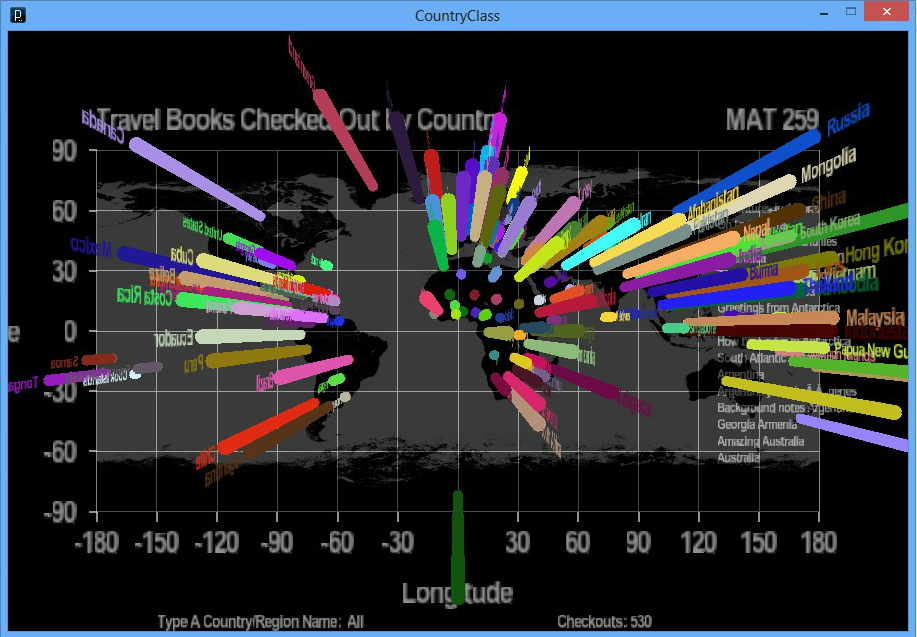
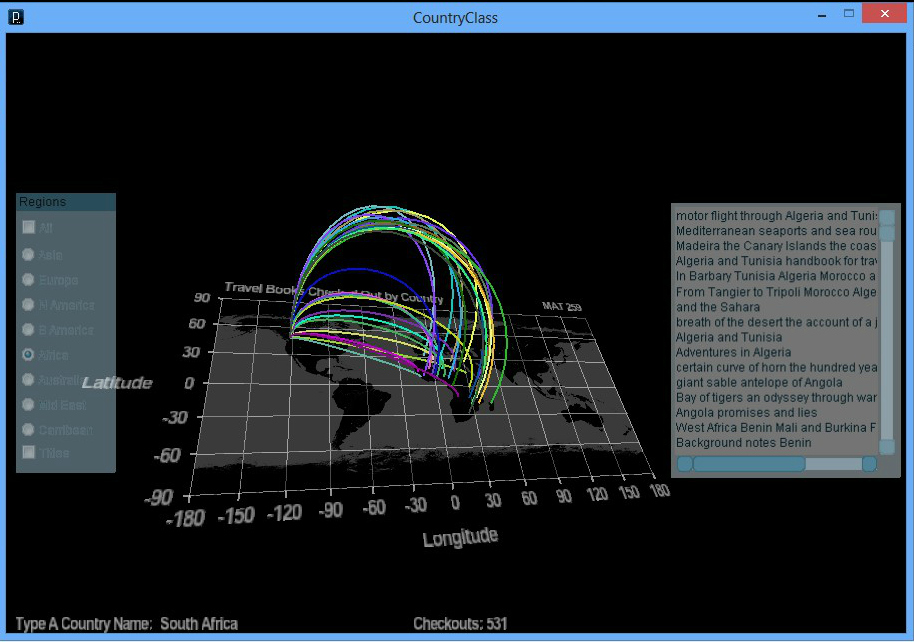
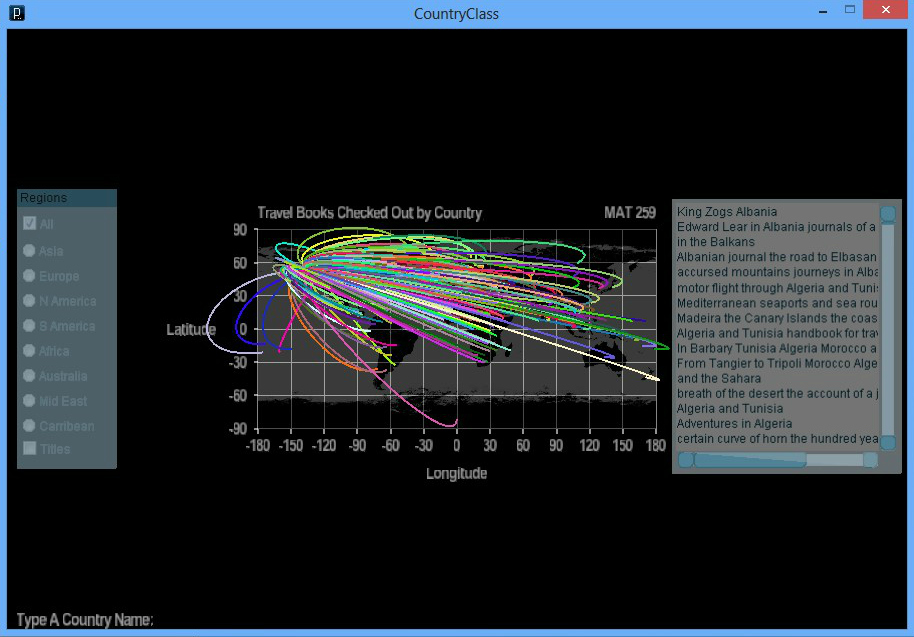
The point of my visualization was to track books & other media items about the subject of travel from around the world in a 3d space. The information is displayed with a cylinder for each country over its Latitude and Longitude, and the cylinder height representing the number of checkouts for books on that country. One can also search for a regions such as the Middle East, Europe, Africa, South America, etc...
Sketch
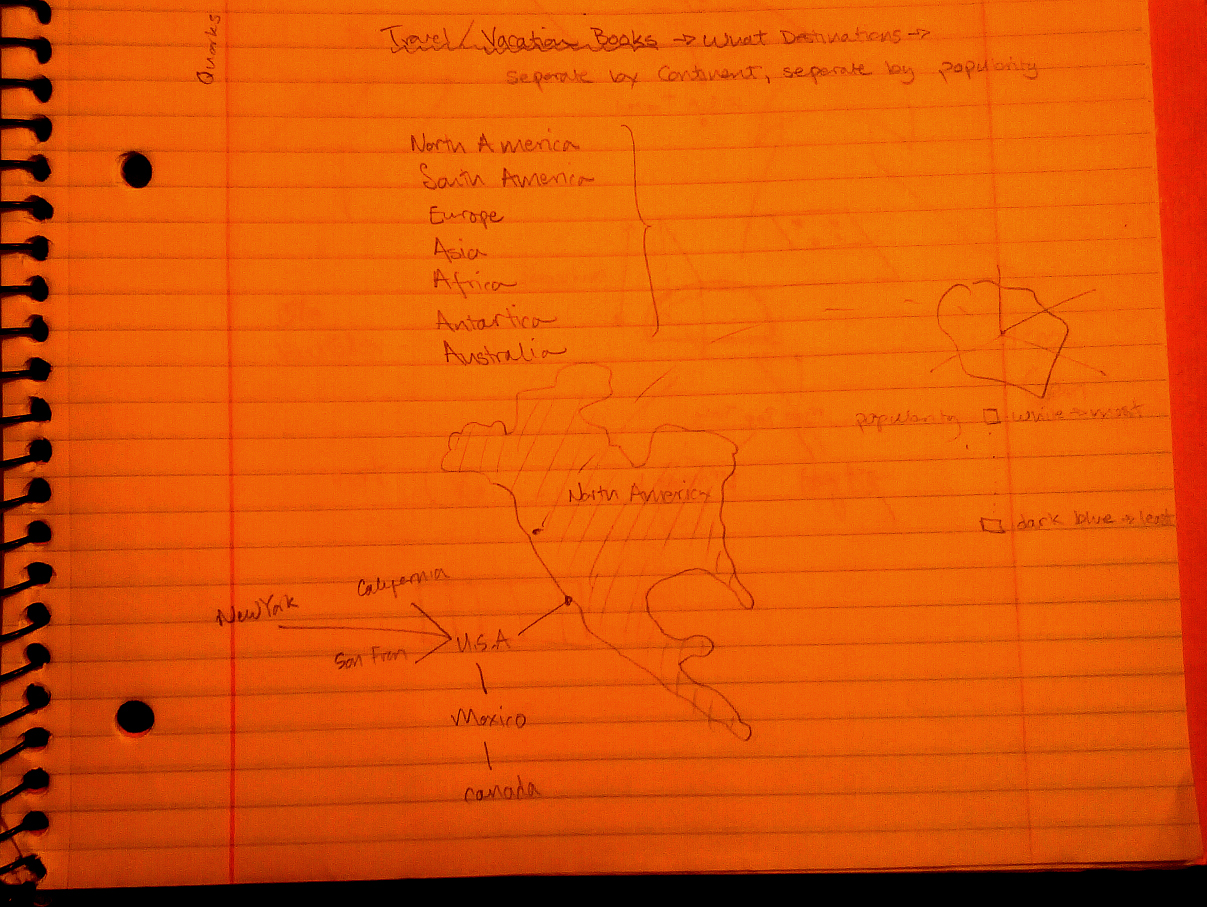
Query
SELECT title as Title,
Count(IF(subj like '%travel%', 1, NULL)) as travelCount
FROM inraw where subj like '%travel%'
GROUP BY title
Having Count(IF(subj like '%travel%', 1, NULL)) > 1;
Results and Analysis
Overall, this project went through many changes and restructurings. The hardest part was to display all the information I wanted to effectively. Working in 3d was fun yet challenging. I hope that from the visualization with minimal explanation a patron could look at my project and understand what I was trying to convey.
Version 1.
Version 2.
Version 1.
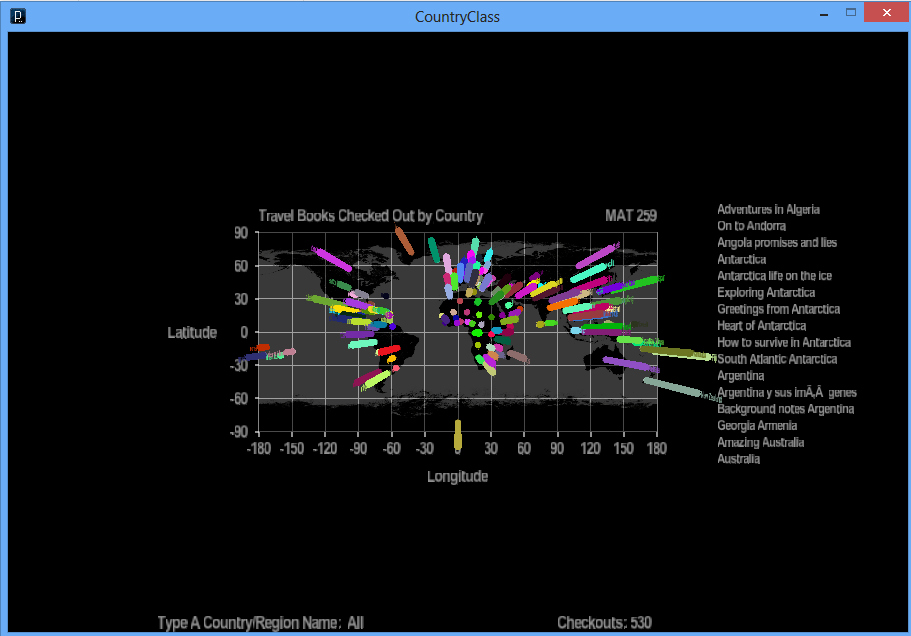

Version 2.
Code
I used Processing and Peasycam.
Download the libraries for processing 1.5.1: audioutils, BezierSQLib, colorutils, controlIP5, datautils, G4P, GLGraphics, json, peasycam, simutils, toxiclibs_p5, toxiclibscore, verletphysics, volumeutils.
Run in Browser
Source Code
Download the libraries for processing 1.5.1: audioutils, BezierSQLib, colorutils, controlIP5, datautils, G4P, GLGraphics, json, peasycam, simutils, toxiclibs_p5, toxiclibscore, verletphysics, volumeutils.
Run in Browser
Source Code
Control