External Correlation
MAT 259, 2013
Jay Byungkyu Kang
Introduction
This project has been extended from the previous dataset(transaction records of the books having the top 3 social medias(Facebook, Twitter and LinkedIn) on their title) in order to visualize the correlation-based implication between NYTimes and SPL data sets.
Query
SELECT DATE_FORMAT(o,'%Y,%m') as coutmonth, count(*)
FROM activity, `title`
WHERE activity.bib = title.bib
AND LOWER(title) like '%__KEYWORD__%'
AND year(o) > 2007
AND year(o) < 2013
GROUP BY coutmonth
Explanation
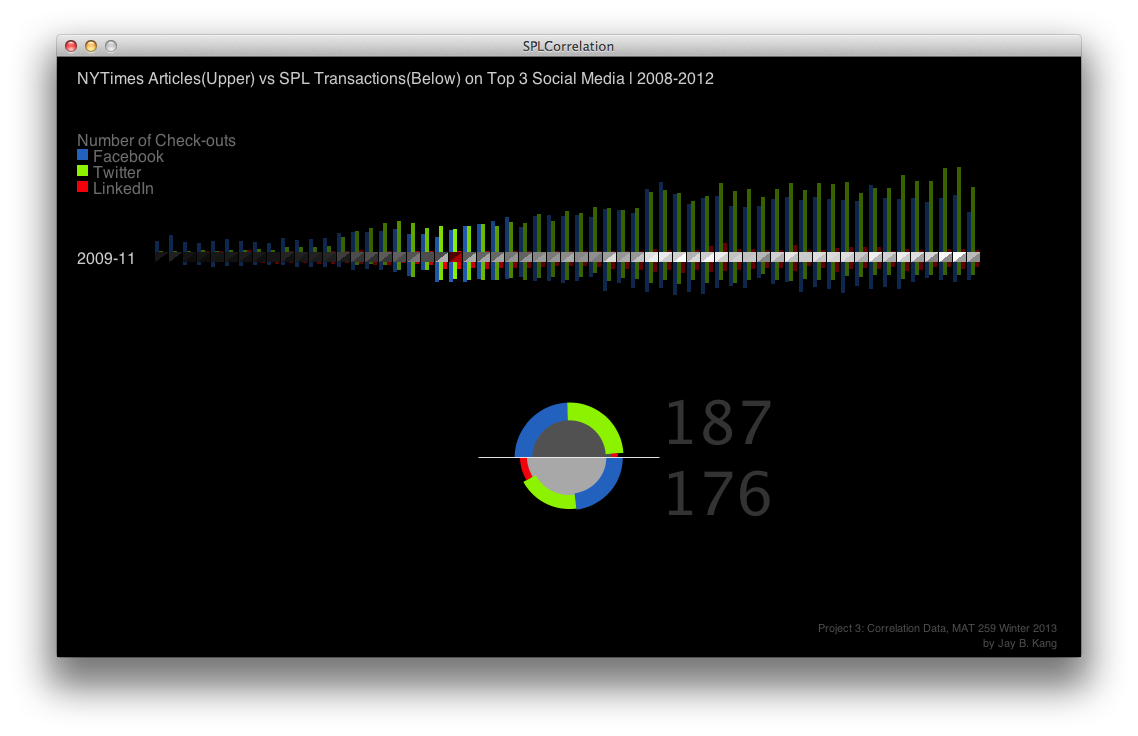
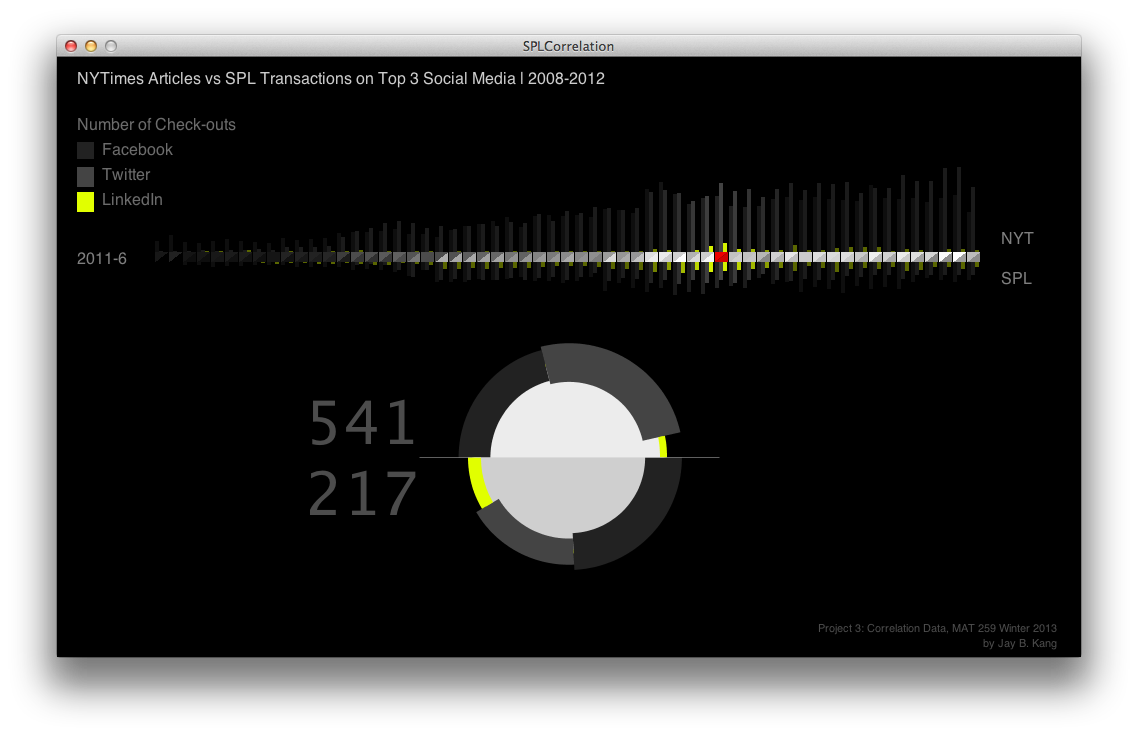
The distribution of transaction records are visualized in histogram on the lower side of the horizontal axis. At the same time, number of articles from New York Times having the same three keywords are visualized on the upper side of the axis. You can hover your mouse cursor on the axis to see the spotlighted portion of the entire plot. At the area below of the graph, a disc diagram shows number of records of each category in different color, size and arc length. Each element represents as follows:
- Upper hemisphere : New York Times dataset.
- Lower hemisphere : Seattle Public Library dataset.
- Size of the disc : Total checkouts (NYT + SPL)
- Three colors : Facebook, Twitter and LinkedIn groups.
- Arc length : ratio of the group in terms of the number of records in each dataset.
In this visualization, data sets are locally stored in csv file format due to security and accessibility reasons.
Spotlight animation is also added as an additional interactivity with mouse hovering. This function helps users focus on a specific time slot since this visualization is focused on comparison task.
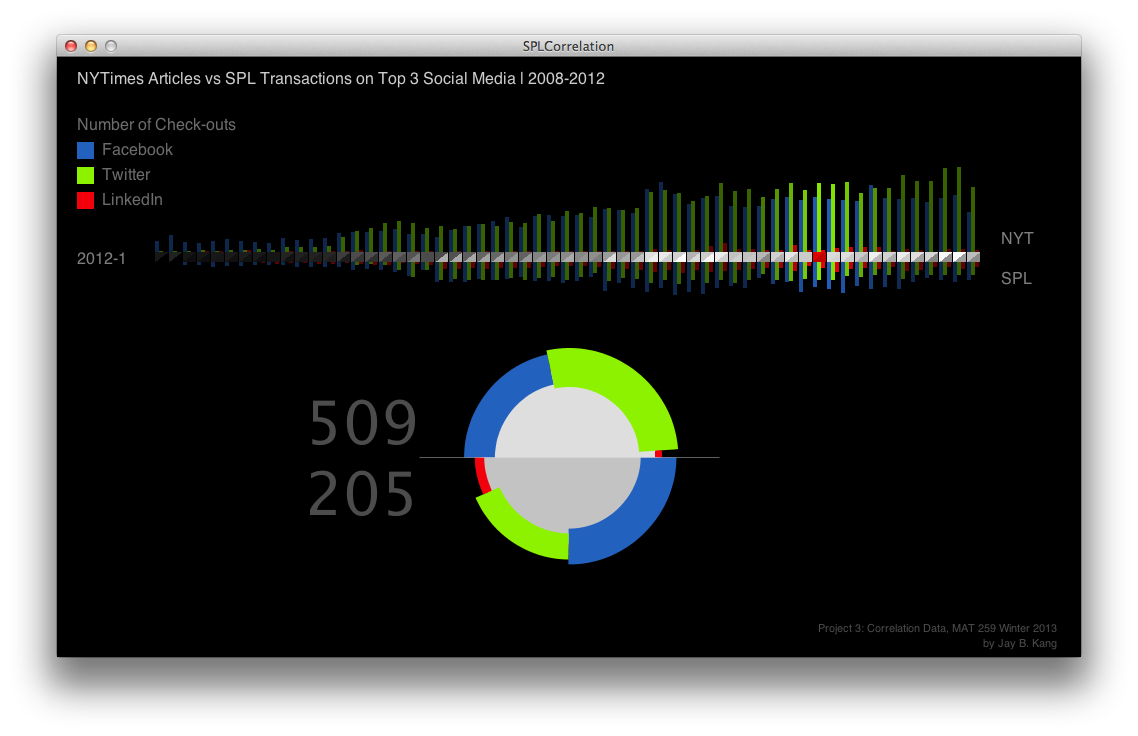
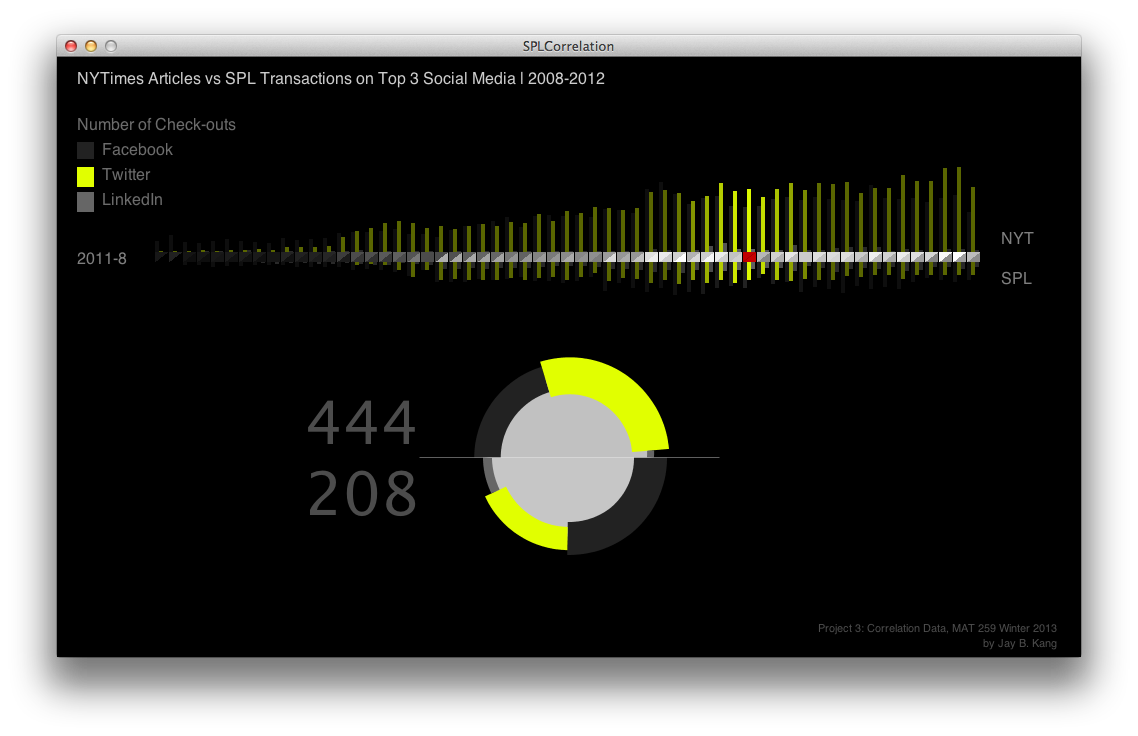
Results and Analysis
As can be seen in the attached screen shots, Facebook keeps decreasing in both SPL checkouts and NYTimes articles in terms of the number of items. However, the statistics of Twitter in NYTimes article shows continuous increase and this, perhaps, can be considered as a unique impact of Twitter on specific fields such as politics or business. A number of blogs, news columns and scientific papers have claimed that Twitter is being utilized as an important medium for propagating/disseminating political opinions or campaigns and commercial advertisements in addition to general communications between individual users. This unique phenomena of Twitter distinguishes itself from the other social media.
Code
I used Processing and NYTimes - The Article Search API (http://developer.nytimes.com/docs/article_search_api/)
I used json and bezierSql libraries.
Run in Browser
Source Code
I used json and bezierSql libraries.
Run in Browser
Source Code
Control
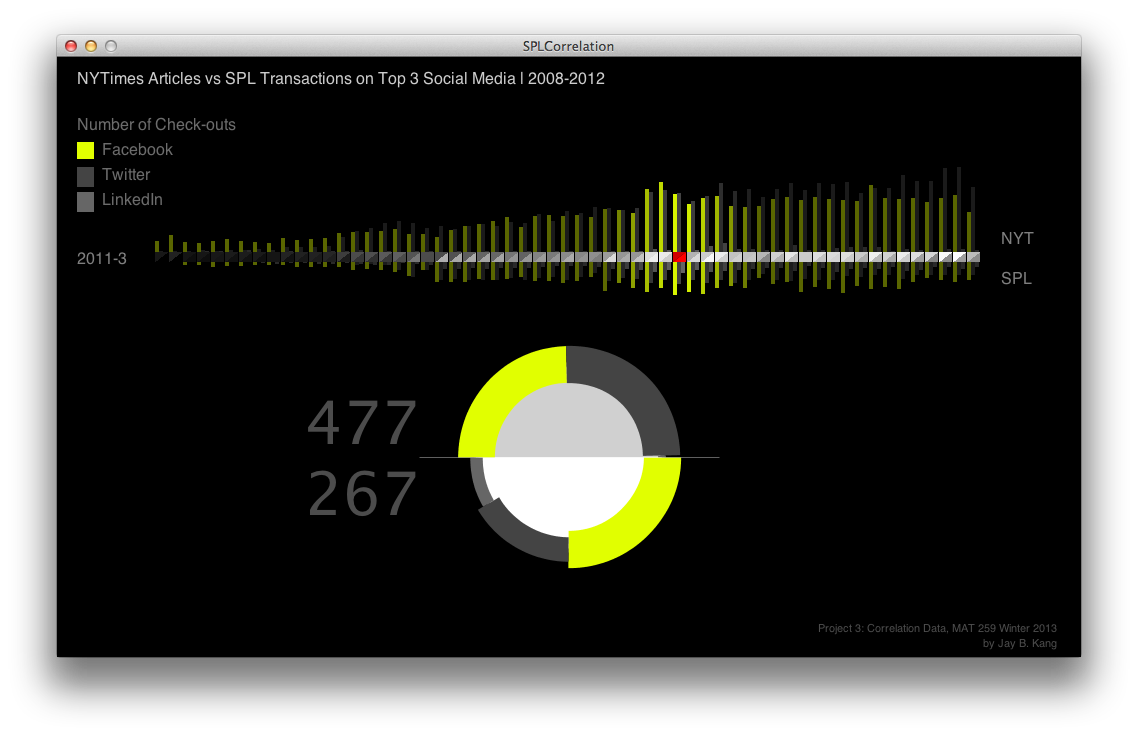
[1-3] highlight individual data set by color
[0] turn off highlighting
[0] turn off highlighting