2D Spatial Map
MAT 259, 2013
Jay Byungkyu Kang
Introduction
As social media such as Facebook or Twitter become more important in our daily life, they are considered as crucial tools for various objectives. For instance, most of the major companies use them to develop aggressive marketing strategies. Moreover, recently, Twitter has been widely used as a tactical medium for political campaigns in many countries.
Therefore, I would like to visualize the distribution of transactions of contents which contain one of the most frequently used social media: Twitter, Facebook and LinkedIn. Each of the above social networking services has a distinctive character of its own.
Therefore, I would like to visualize the distribution of transactions of contents which contain one of the most frequently used social media: Twitter, Facebook and LinkedIn. Each of the above social networking services has a distinctive character of its own.
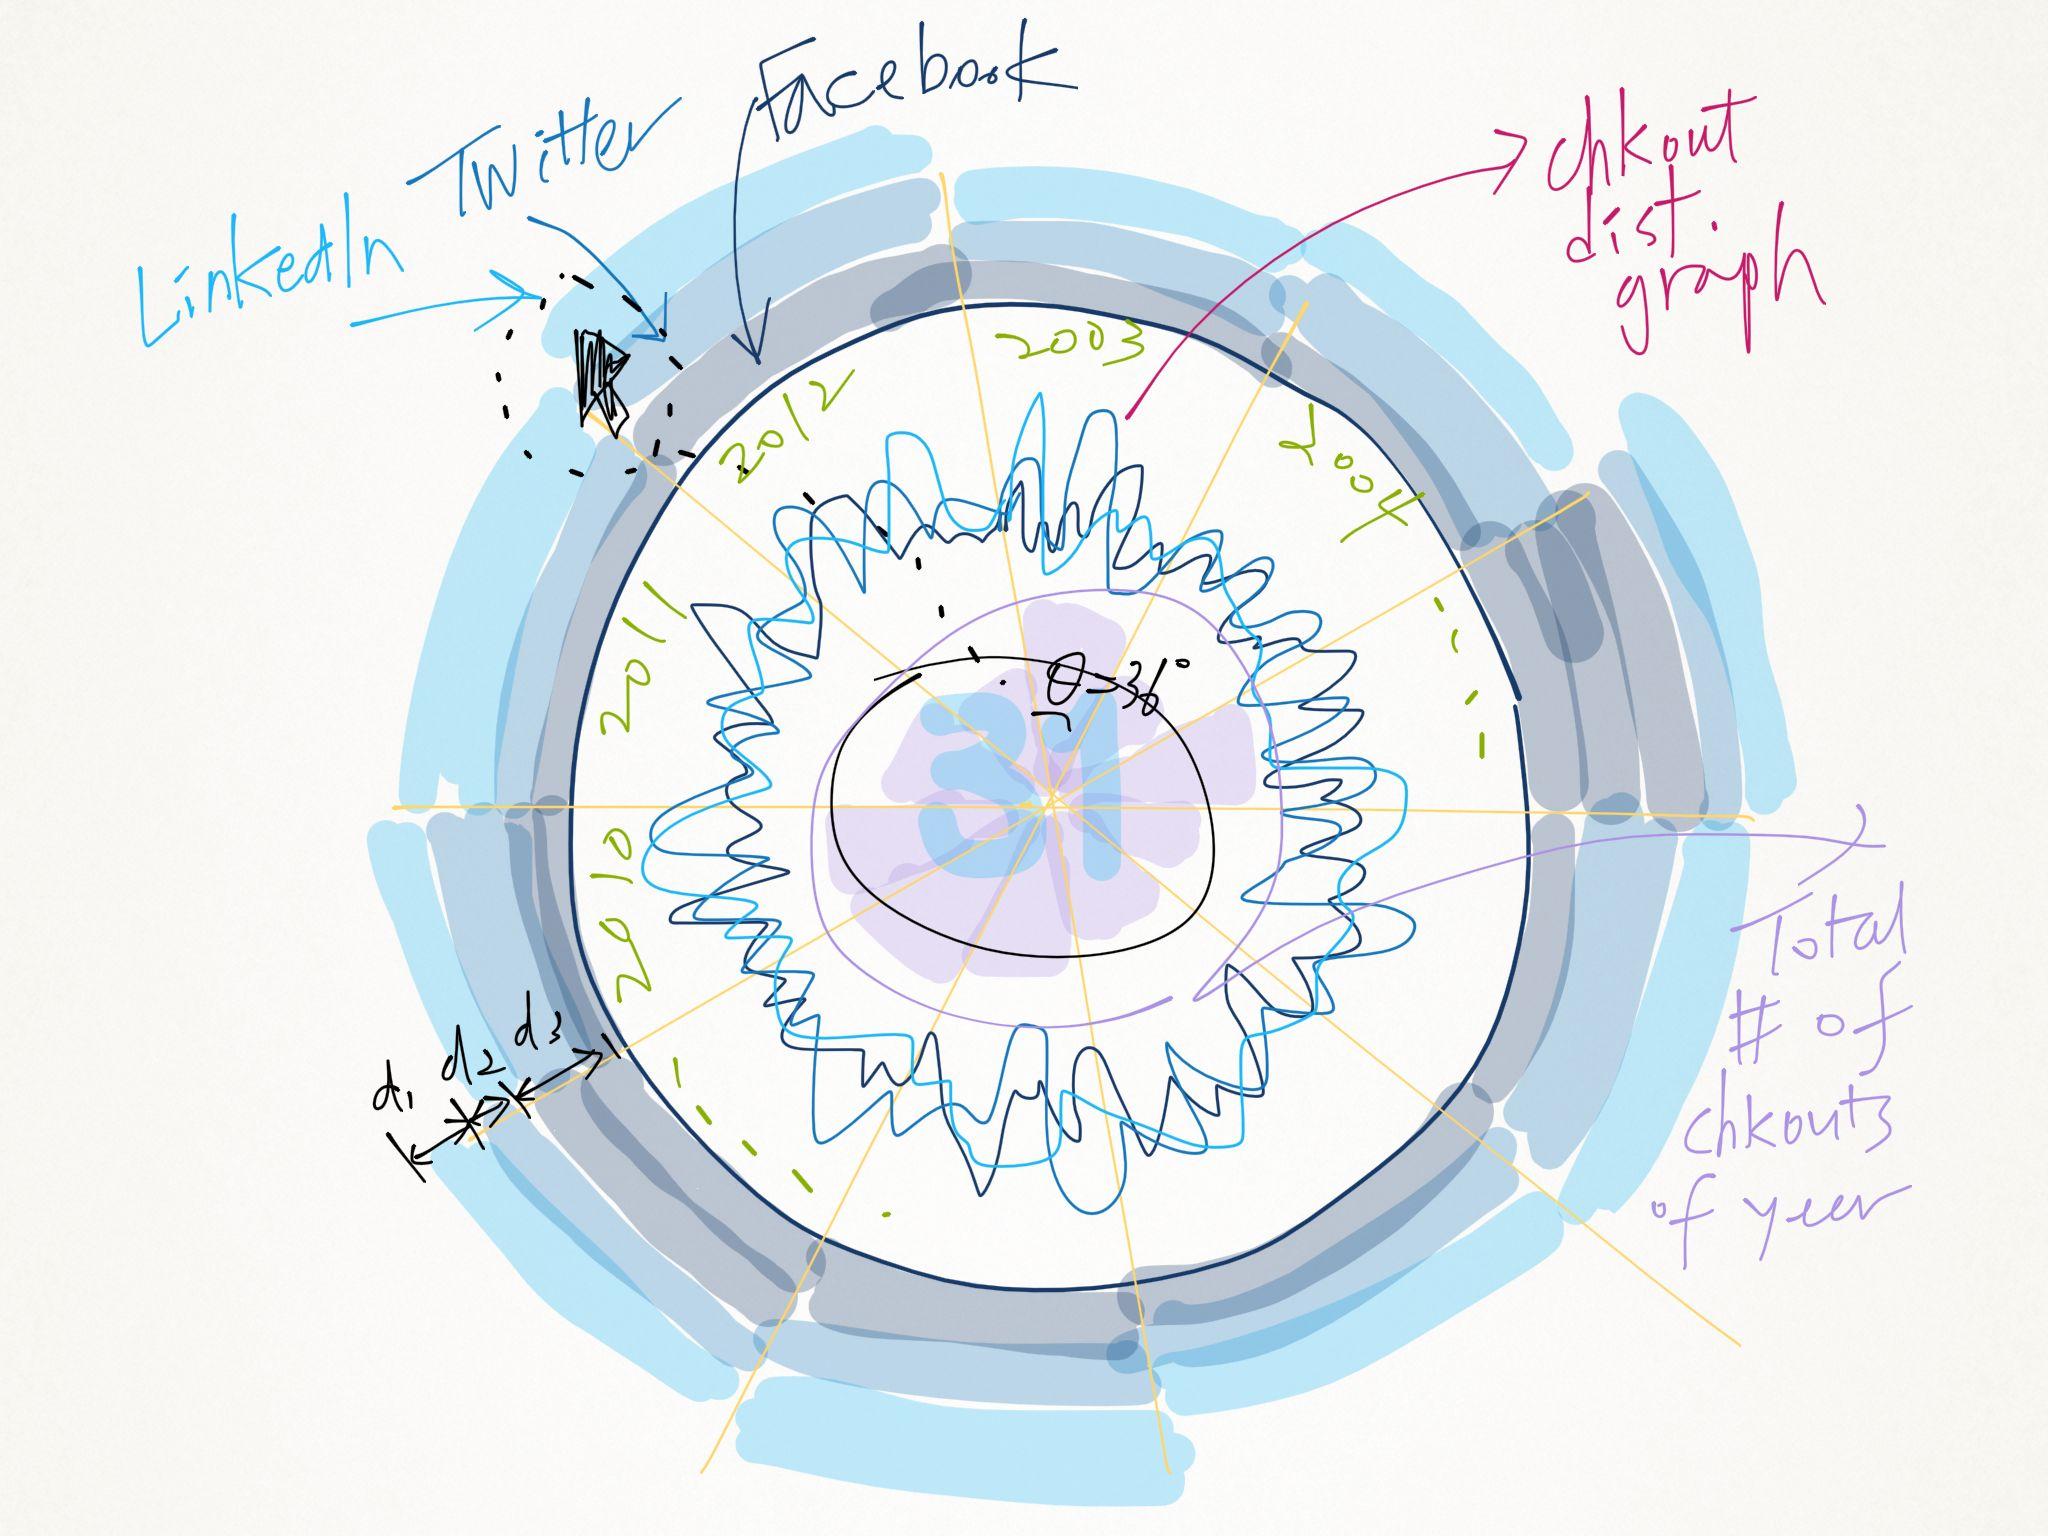
Background
and Sketches
and Sketches
Query
SELECT
count(*), DATE_FORMAT(o,'%Y-%m') as coutmonth, SUBSTRING(dewey,1,1) as dw
FROM title, activity, dewey
WHERE
title.bib = activity.bib AND
activity.bib = dewey.bib AND
LOWER(title) like '% + keywords[index] + %' AND
(SUBSTR(dewey,1,1) = '6' OR SUBSTR(dewey,1,1) = '0' OR SUBSTR(dewey,1,1) = '3')
AND year(o) > 2007
AND year(o) < 2013
GROUP BY coutmonth, dw;
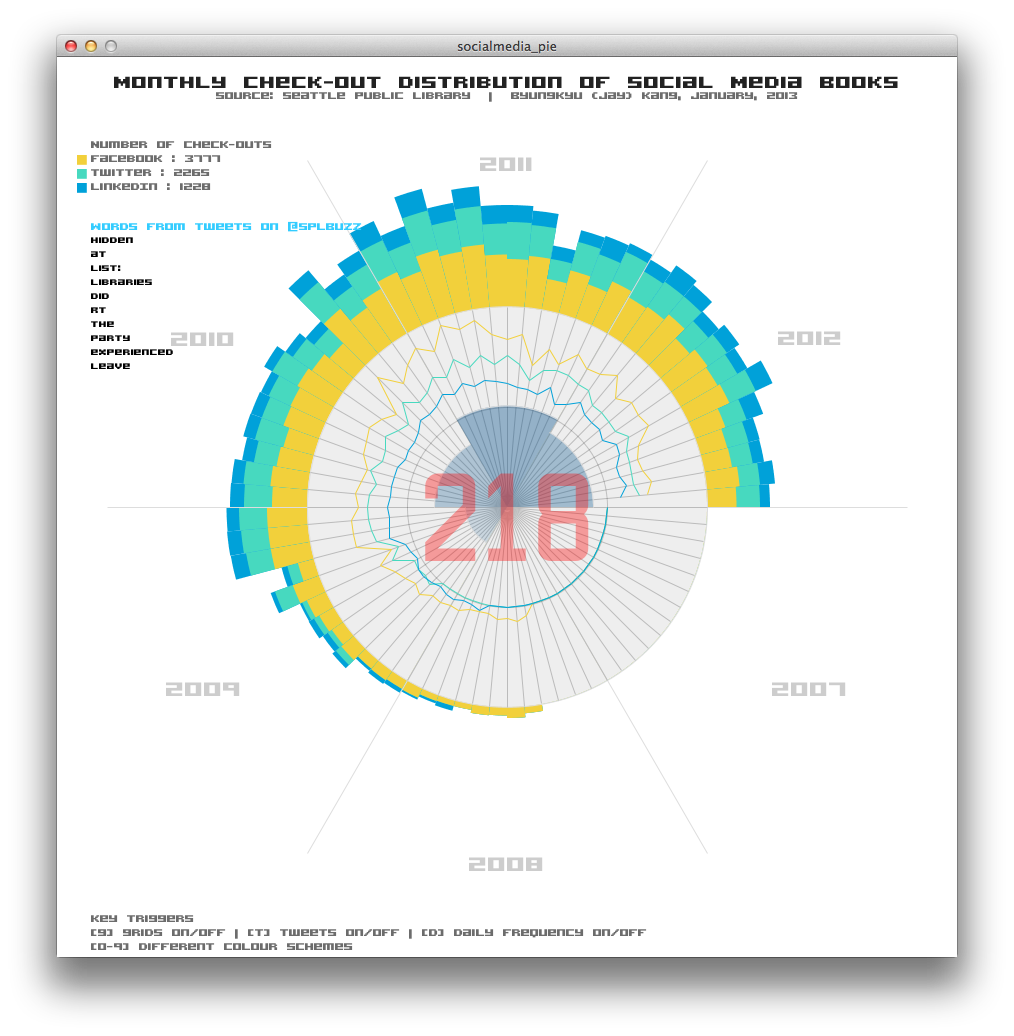
Analysis
As can be seen below, we can easily see the overall popularity of social media based on the distribution of the check-outs of relevant materials in the SPL. We can also compare the popularity(in terms of the number of transactions) across different years or months. Moreover, the implementation is delivering some interactivity. For instance,
Code