2D Spatial Map
MAT 259, 2013
Anastasiya
Introduction
Background
and Sketches
and Sketches
Query
Query Explanation
Results and Analysis
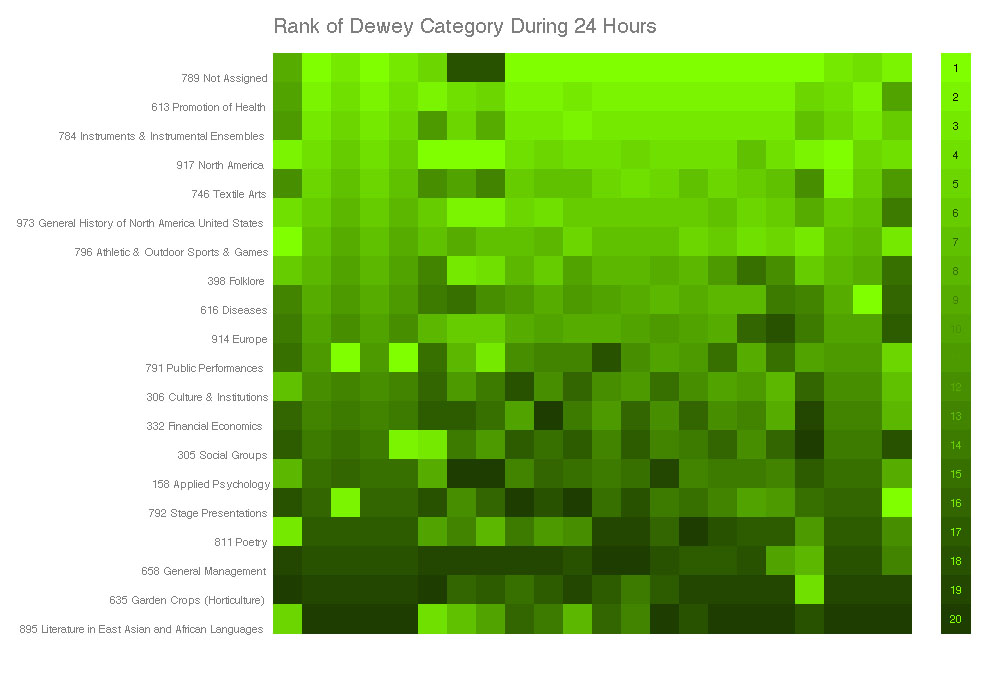
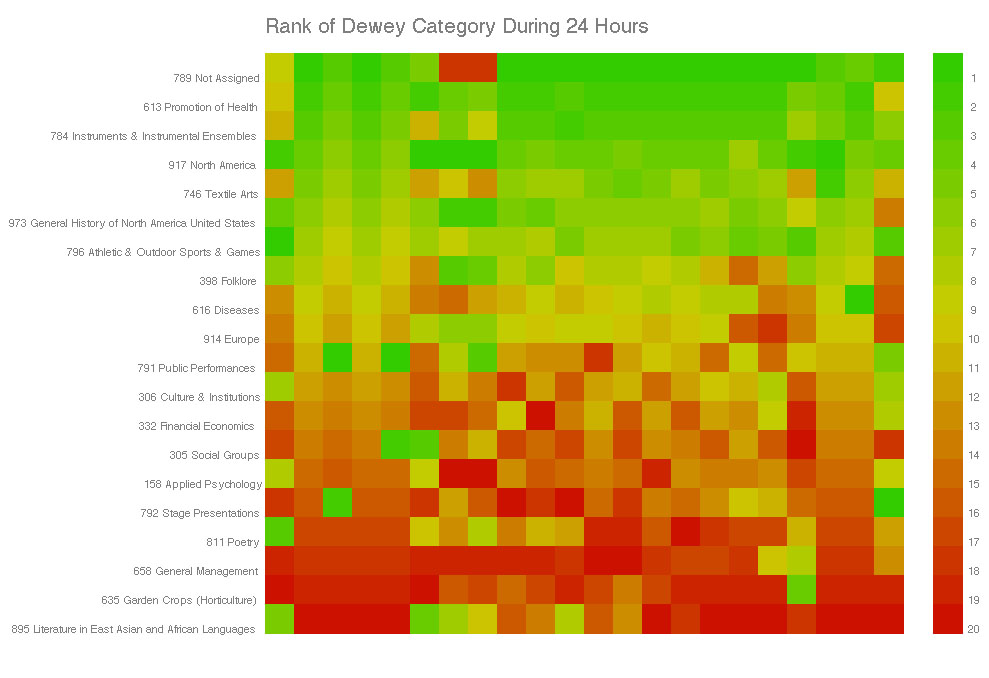
I changed my idea, I used the code that Yoon wrote to show the ranks of the dewey classes in each hour and modified it so that you can look across each row (dewey category) and see how it's rank changes based on the brightness of the squares. You can see for example that dewey class 789 falls in rank at 8 and 9 am and also see how much the ranks fluctuate for each class based on the diference in brightness.
Also you can look at the vertical columns to see how the categories compare in rank to each other.
Screenshot and code attached.
Code