External Correlation
MAT 259, 2012
Yoon Chung Han
Introduction
My goal of this project was to investigate how many items related to North Korea and South Korea were checked out from 2005 to 2011. And I was also interested in different results between NYTimes and Seattle Public Library since NYTimes is based on newspaper and online articles, and Seattle Public Library contains many different kinds of mediums and contents. I was curious how much items people checked out, and how it would be related to each other over years. In this data visualization, I mostly focused on color contrast: Red as North Korea and Blue as South Korea. The two color represent the national colors in national flags, and it directly shows the two countries' different identities. Through this research, I was surprised that there were quite many items checked out over years, and NYTimes and SPL showed different peak times.
Query
select year(cout), month(cout), count(*) from inraw where cout > '2005-01-01' and title like '%North Korea%' group by year(cout), month(cout) order by year(cout), month(cout);
Process
First, I searched the checked out data by using this query.
select year(cout), month(cout), count(*) from inraw where cout > '2005-01-01' and title like '%North Korea%' group by year(cout), month(cout) order by year(cout), month(cout);
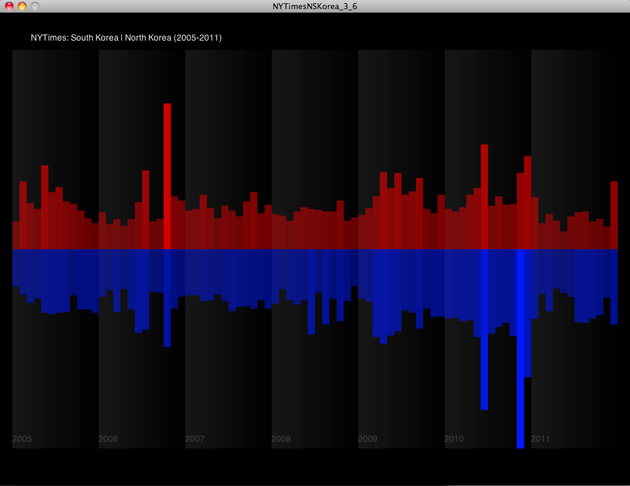
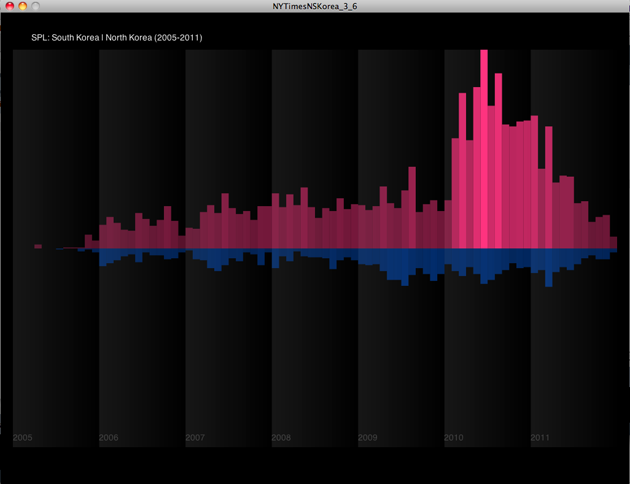
Over years and months, I achieved the different numbers, and I visualized the numbers by heights of bars. And as a representation of "Taeguk" in Korea's national flag, I arranged the two bars inversely; Red bars(North Korea) were arranged upward, and Blue bars(South Korea) were arranged downward.
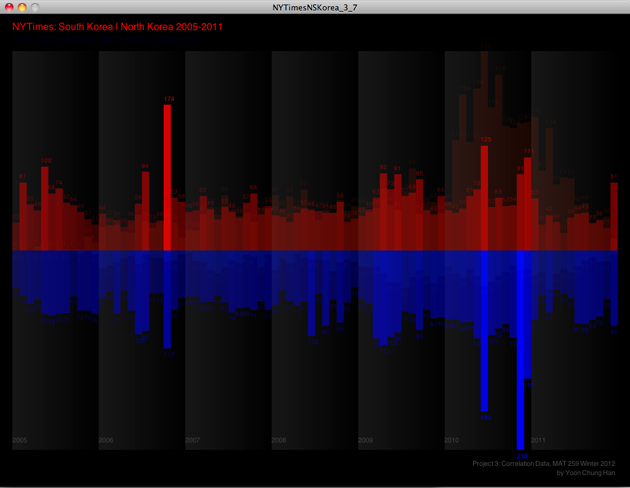
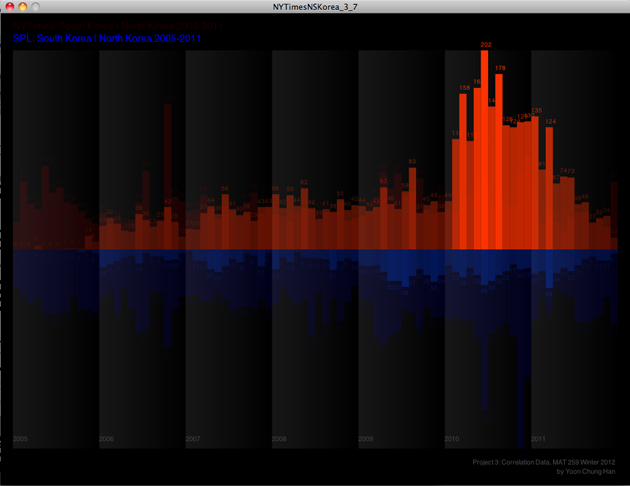
However, in order to compare those two results, I should fix the interaction and way of showing two results. So, I changed to use mouse movement as a way of changing two pages. If you move your mouse from left to right, you can see the result from NYTimes to SPL. Now, it's easy to compare those two datas and results. Total numbers of checked out items are also appeared right above each bar, so it's easy to get the details of the data results.
select year(cout), month(cout), count(*) from inraw where cout > '2005-01-01' and title like '%North Korea%' group by year(cout), month(cout) order by year(cout), month(cout);
Over years and months, I achieved the different numbers, and I visualized the numbers by heights of bars. And as a representation of "Taeguk" in Korea's national flag, I arranged the two bars inversely; Red bars(North Korea) were arranged upward, and Blue bars(South Korea) were arranged downward.
However, in order to compare those two results, I should fix the interaction and way of showing two results. So, I changed to use mouse movement as a way of changing two pages. If you move your mouse from left to right, you can see the result from NYTimes to SPL. Now, it's easy to compare those two datas and results. Total numbers of checked out items are also appeared right above each bar, so it's easy to get the details of the data results.
Result and
Analysis
Analysis
Code