these are my projects from George Legrady's MAT 259 class, Data Visualization. for this class, i
installed MySQL 5.5, imported the Seattle Public Library transaction data, normalized the data into
several tables and then indexed those tables to make queries fast. several students in the class
used my database because it provided reasonable query execution times. before this class, i had
never installed or designed a database and i could not write an SQL query to save my life.
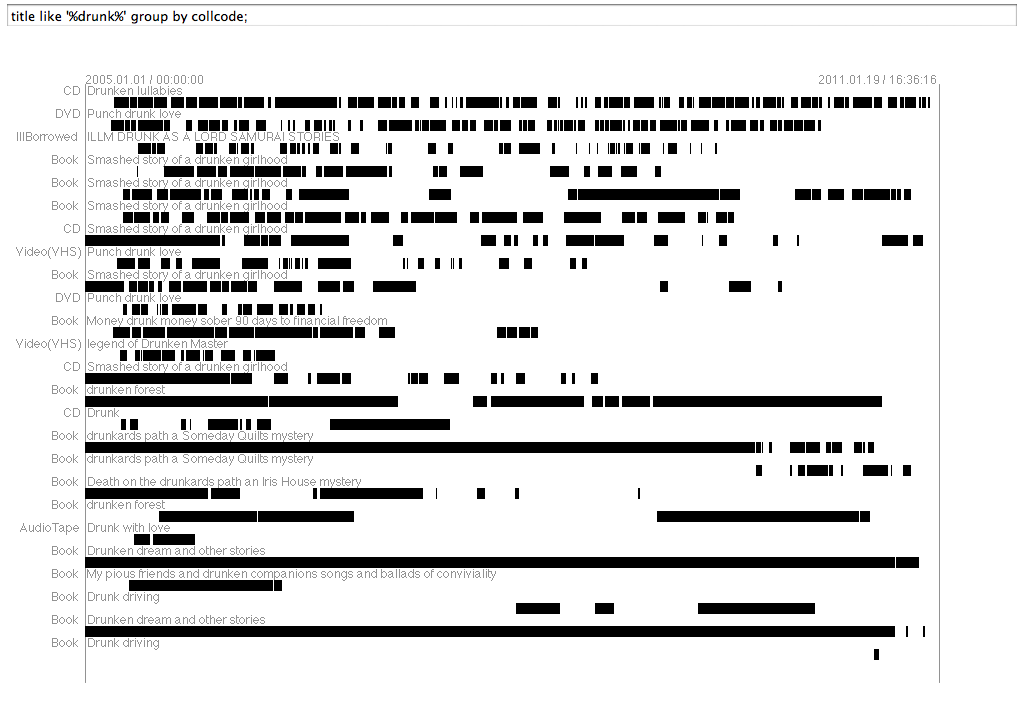
sqlFrequencyMap (run)
with my first project, i was still studying the data and organizing my database. so, instead of
trying to visualizing a particular subset of the data, i made an interactive tool to help me find
interesting data and test my database. this piece expects you to enter a fragment of an SQL query.
it prefixes your fragment with select barcode,itemtype,title from items where ,
executes the completed SQL query, and then dynamically visualizes the result of the complete query
by showing check-in and check-out transactions over time. try entering title like '%fear%'
limit 15; or title like '%drunk%' group by collcode; (don't forget the
; and don't forget to hit the enter key). once your query finishes, click in the
applet to give it focus. then use the left and right keys move backwards and forwards in time and
the up and down keys zoom in and out.
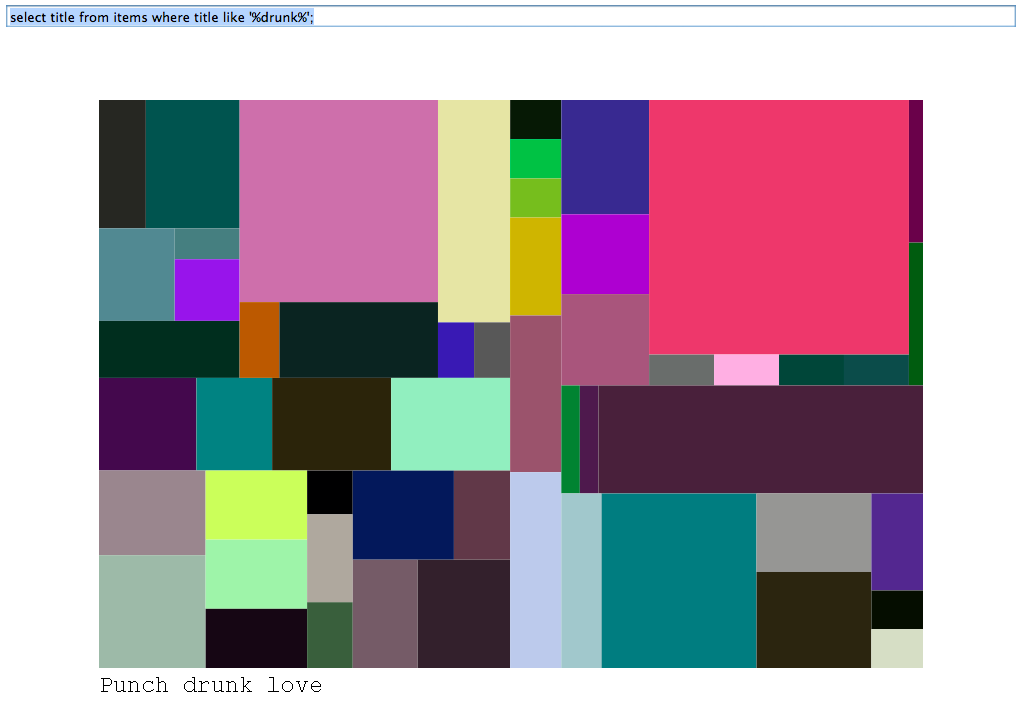
sqlTreeMap (run)
for my second project, i wanted to make another interactive visualization that could accept arbitrary
SQL queries (no prefixing queries like in my first project). this applet expects a complete,
well-formed SQL query. the visualization adds the first column of each row to the treemap,
so the size of a partition of the treemap is proportional to the number of rows returned from my
database for the given query. try entering select title from items where title like
'%fear%'; or select i.title from items i, transactions t where i.barcode = t.barcode
and i.title is not null and i.title like '%drunk%';. a partition is highlighted in black
when the mouse moves over it and a portion of the data is shown at below the treemap.
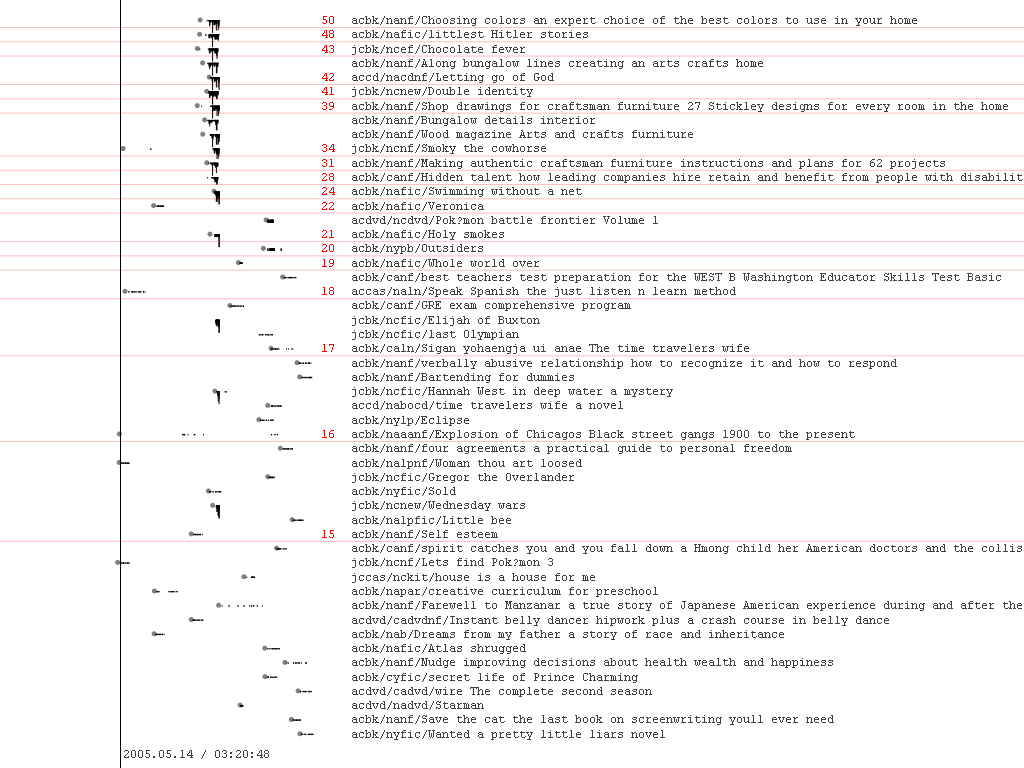
showAnomalies7 (run)
i started my final project with an interesting subset of data to show. this piece highlights items
that seem anomalous, items that are checked in many times for only one check-out
date-time. i organized these by number of times checked-in, descending. that these items have so many
check-in times has something to do with the way the library processes books that are put on hold.
little gray circles represent check-out date-times. thin red lines separate the anomalies into
classes: 50 check-ins, 48, 43, 42 and so on. finally, the item types, collection tags and titles are
shown. navigation is similar to my first project.